Department of Pulmonary Medicine, Huadong Hospital, Fudan University, Shanghai, 200040, People's Republic of China.
Department of Pulmonology Medicine, Shuguang Hospital Affiliated to Shanghai University of Traditional Chinese Medicine, Shanghai, 201203, People's Republic of China.
Int J Chron Obstruct Pulmon Dis. 2021 Feb 4;16:215-223. doi: 10.2147/COPD.S285927. eCollection 2021.
To explore the correlation of respiratory resistance in stable COPD patients measured by broadband 3-dimensional impulse oscillometry (3D-IOS) and traditional pulmonary function test (PFT). To access the diagnostic value of 3D-IOS in COPD.
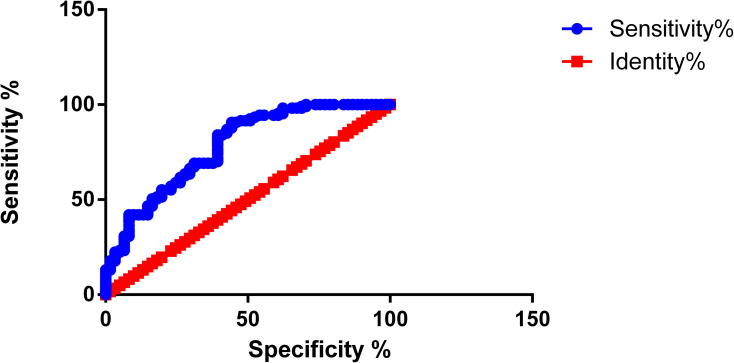
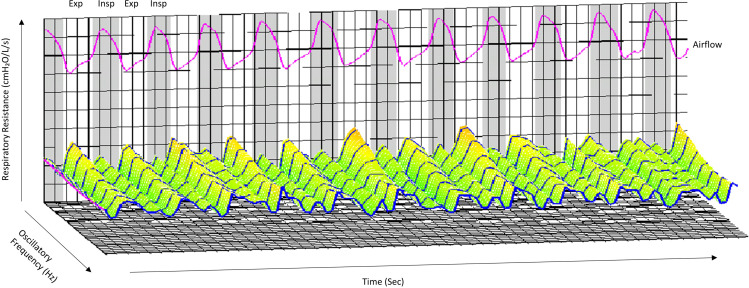
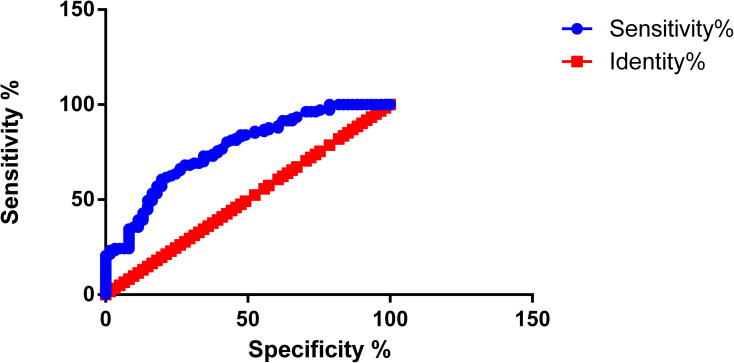
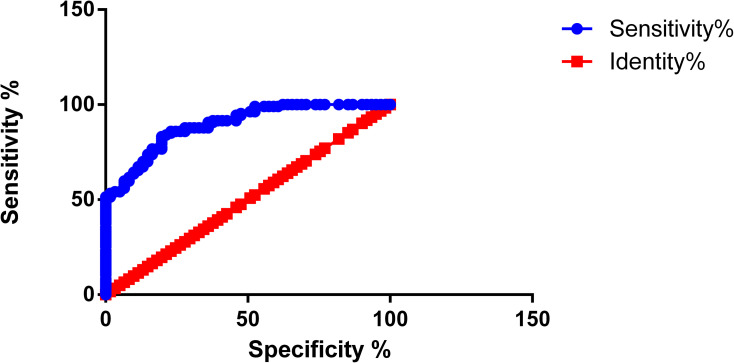
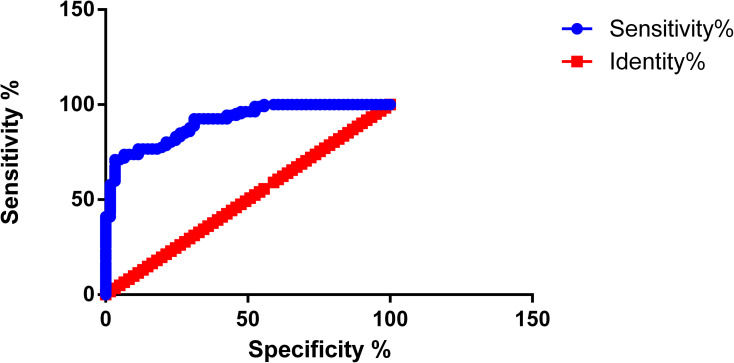
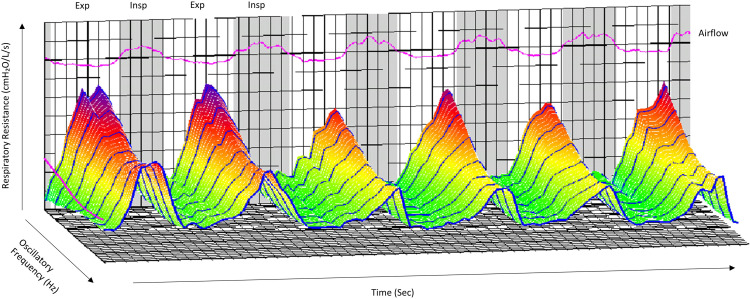
A total of 107 COPD patients and 61 healthy subjects as controls were chosen to collect and statistically analyze the data of R5, R5-R20, R20, X5 and Fres measured by broadband 3D-IOS and FEV1%pred, FVC%pred and FEV1/FVC by PFTs. The diagnostic value of broadband 3D-IOS parameters in COPD was evaluated by receiver operating characteristic curve (ROC). 3D-colored images used to show dynamic changes of respiratory resistance in COPD.
The COPD group showed significant increases in R5, R20, R5-R20 and Fres, and a decrease in X5 (<0.05). With the increase of GOLD grade, R5, R5-R20 and Fres increased whereas X5 decreased (<0.05). Compared with FEV1%pred, FVC%pred and FEV1/FVC in the COPD group, R5, R5-R20 and Fres were negatively collated (<0.05), whereas X5 was positively collated (<0.01). R20 was uncorrelated with the traditional lung function parameters (>0.05). Fres and FEV1/FVC (r=-0.467), and X5 and FEV1%pred (r=0.412) showed the strongest correlation. The AUC of R5, R5-R20, X5 and Fres was 0.7808, 0.7659, 0.8947 and 0.9095, respectively. Typical 3D-colored images of COPD displayed a green pattern in the inhalation phase and yellow-red-blue graduation in the expiration phase.
R5, R5-R20, X5 and Fres measured by broadband 3D-IOS can reflect the change of respiratory resistance in COPD. And they have good correlation with the traditional lung function parameters (FEV1%pred, FVC%pred, FEV1/FVC). Fres has the highest diagnostic accuracy. Comprehensive analysis of R5, R5-R20, Fres and X5 helps to determine the degree of respiratory obstruction in COPD. X5 and Fres can reflect changes in lung tissue compliance. 3D-colored images can visually show the change of respiratory resistance and reactance in COPD.
探讨应用三维脉冲震荡(3D-IOS)技术检测稳定期 COPD 患者呼吸阻力的相关性,并评估其在 COPD 中的诊断价值。
选择 107 例 COPD 患者和 61 例健康体检者作为对照组,分别采用 3D-IOS 技术和传统肺功能检查(PFT)检测 R5、R5-R20、R20、X5 和 Fres,并进行统计学分析。应用受试者工作特征曲线(ROC)评估 3D-IOS 各参数在 COPD 中的诊断价值。采用 3D 彩色图像直观显示 COPD 患者呼吸阻力的动态变化。
COPD 组 R5、R20、R5-R20 和 Fres 显著升高,X5 降低(P<0.05)。随着 GOLD 分级的增加,R5、R5-R20 和 Fres 逐渐升高,而 X5 逐渐降低(P<0.05)。与 COPD 组 FEV1%pred、FVC%pred 和 FEV1/FVC 比较,R5、R5-R20 和 Fres 呈负相关(P<0.05),而 X5 呈正相关(P<0.01)。R20 与传统肺功能参数无相关性(P>0.05)。Fres 与 FEV1/FVC(r=-0.467)、X5 与 FEV1%pred(r=0.412)相关性最强。R5、R5-R20、X5 和 Fres 的 AUC 分别为 0.7808、0.7659、0.8947 和 0.9095。典型 COPD 的 3D 彩色图像在吸气相呈绿色,呼气相呈黄-红-蓝色渐变。
3D-IOS 检测的 R5、R5-R20、X5 和 Fres 能反映 COPD 患者呼吸阻力的变化,与传统肺功能参数(FEV1%pred、FVC%pred、FEV1/FVC)有较好的相关性,其中 Fres 诊断准确性最高。综合分析 R5、R5-R20、Fres 和 X5 有助于判断 COPD 患者呼吸阻塞程度,X5 和 Fres 可反映肺组织顺应性的变化。3D 彩色图像可直观显示 COPD 患者呼吸阻力和电抗的变化。