The Walter and Eliza Hall Institute of Medical Research, Parkville, 3052, Australia.
Department of Medical Biology, The University of Melbourne, Parkville, 3010, Australia.
F1000Res. 2020 Dec 10;9:1444. doi: 10.12688/f1000research.27893.1. eCollection 2020.
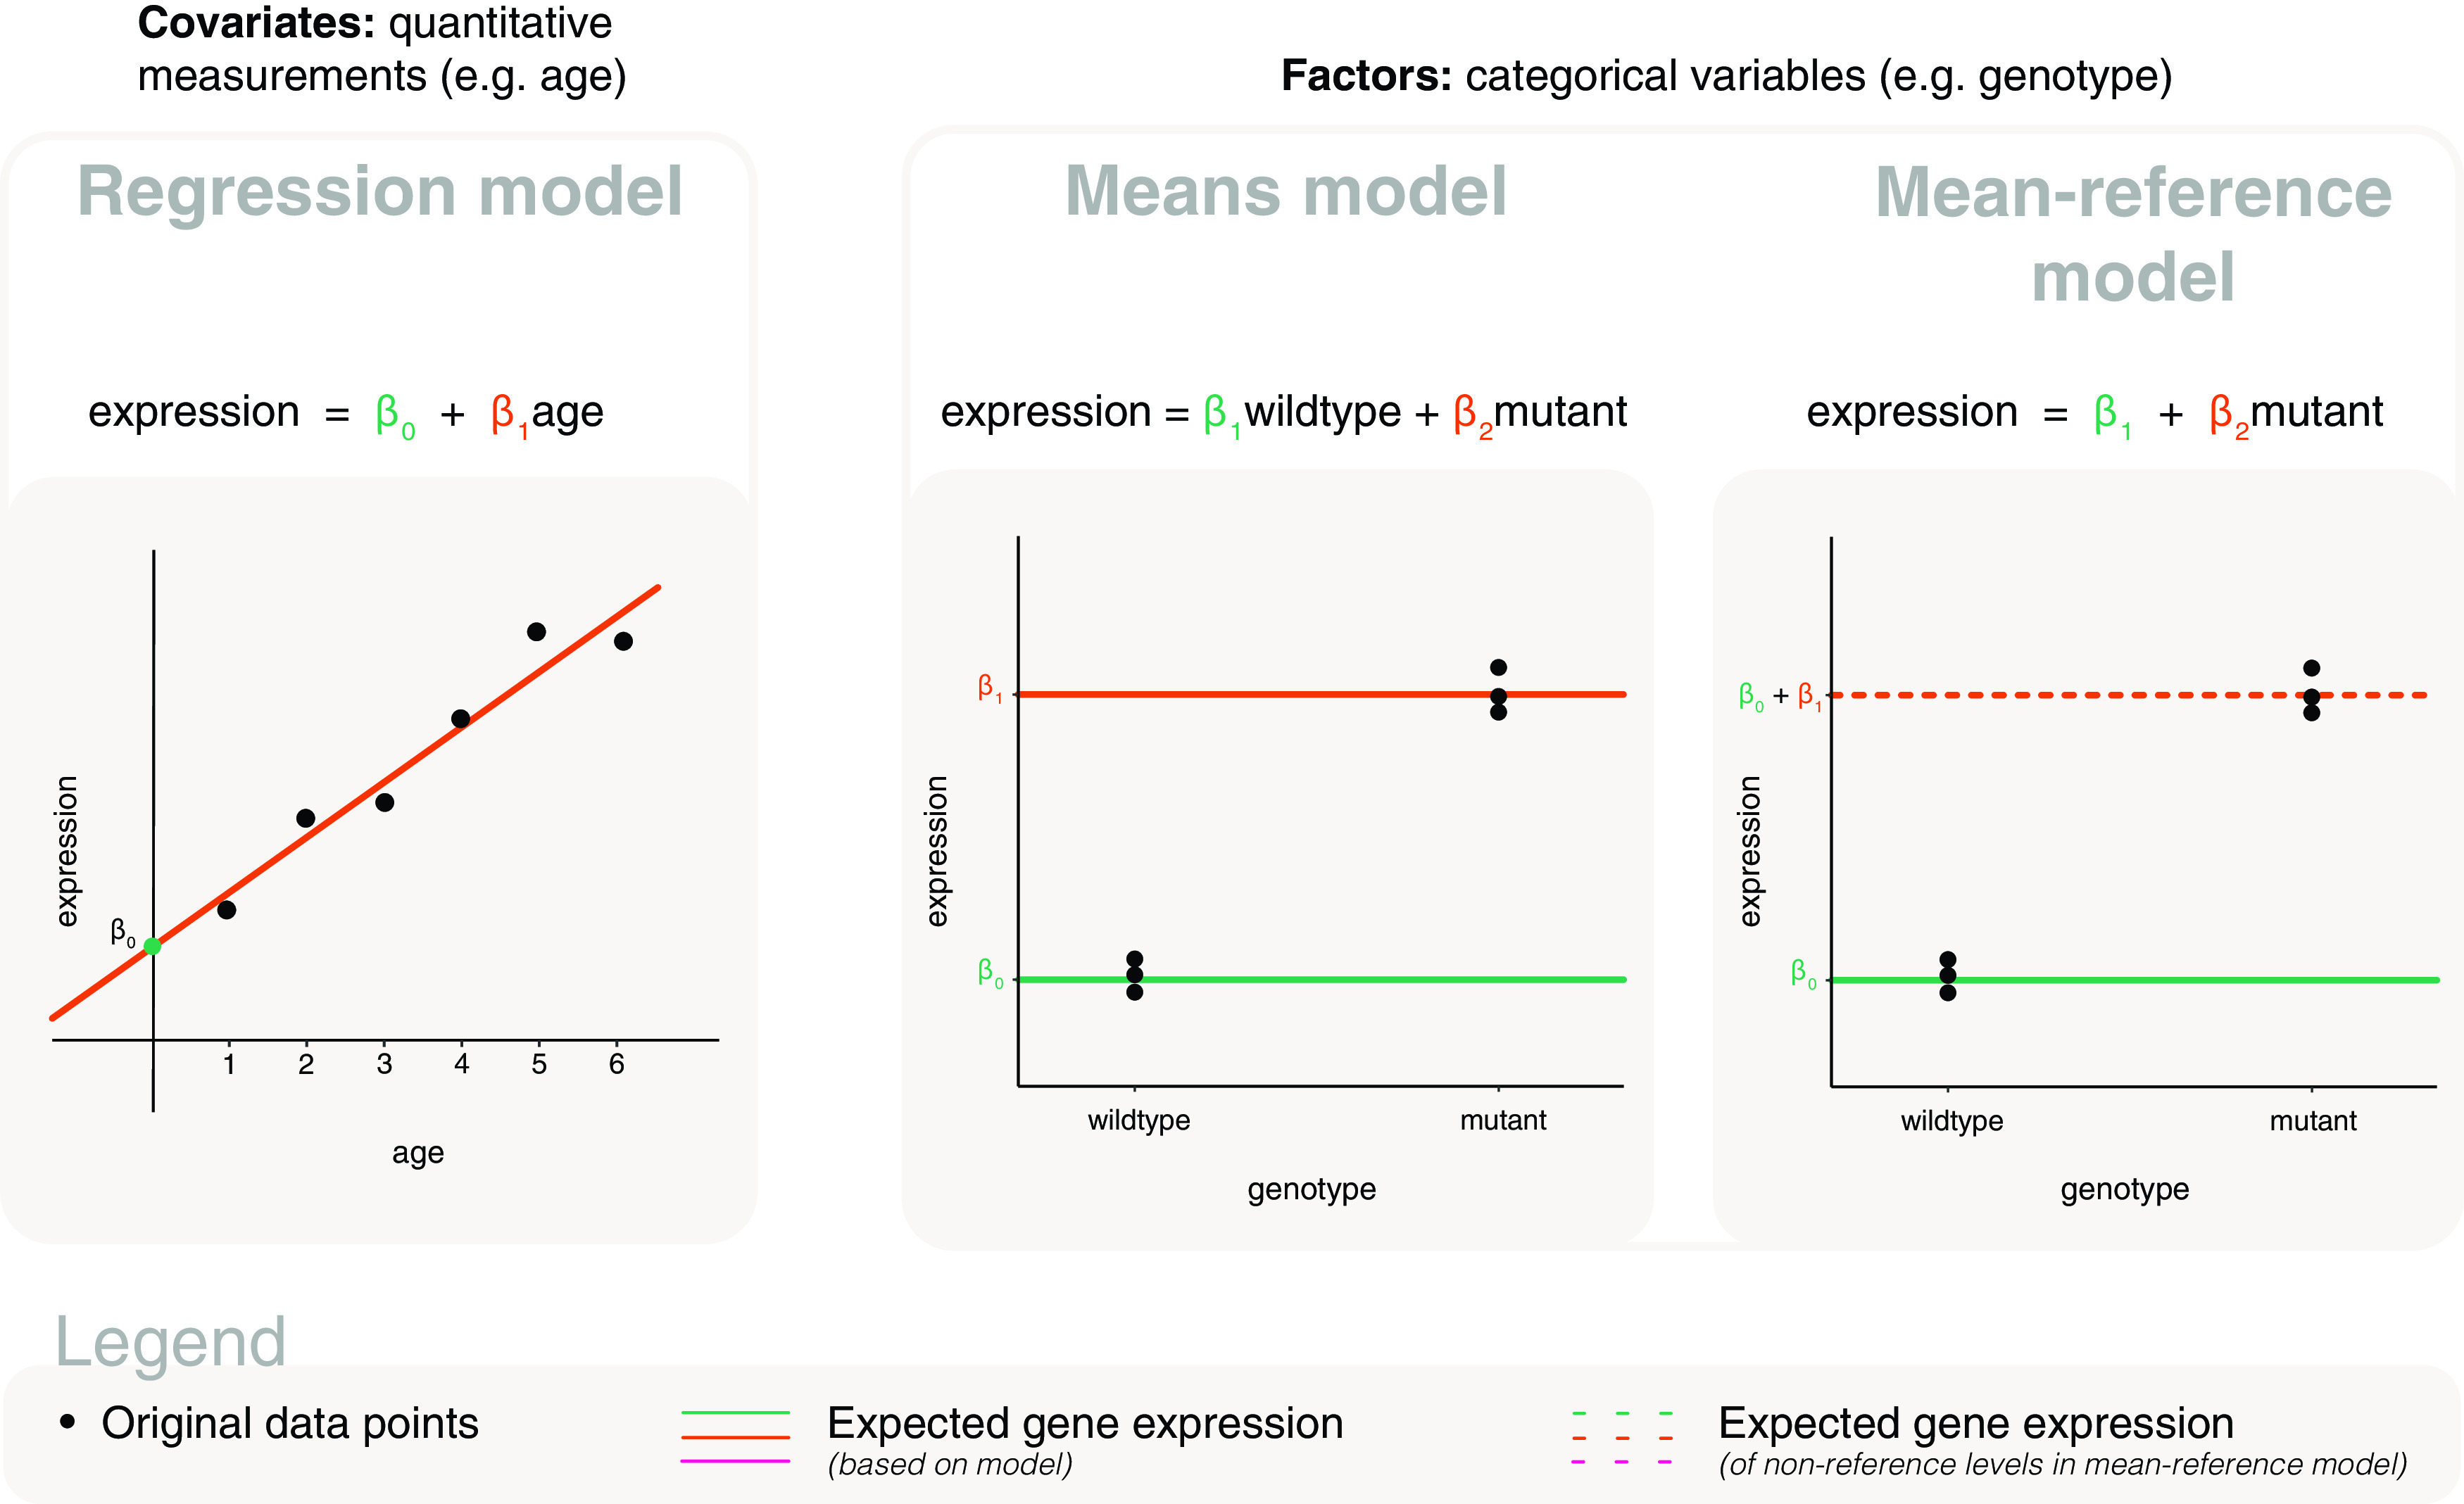
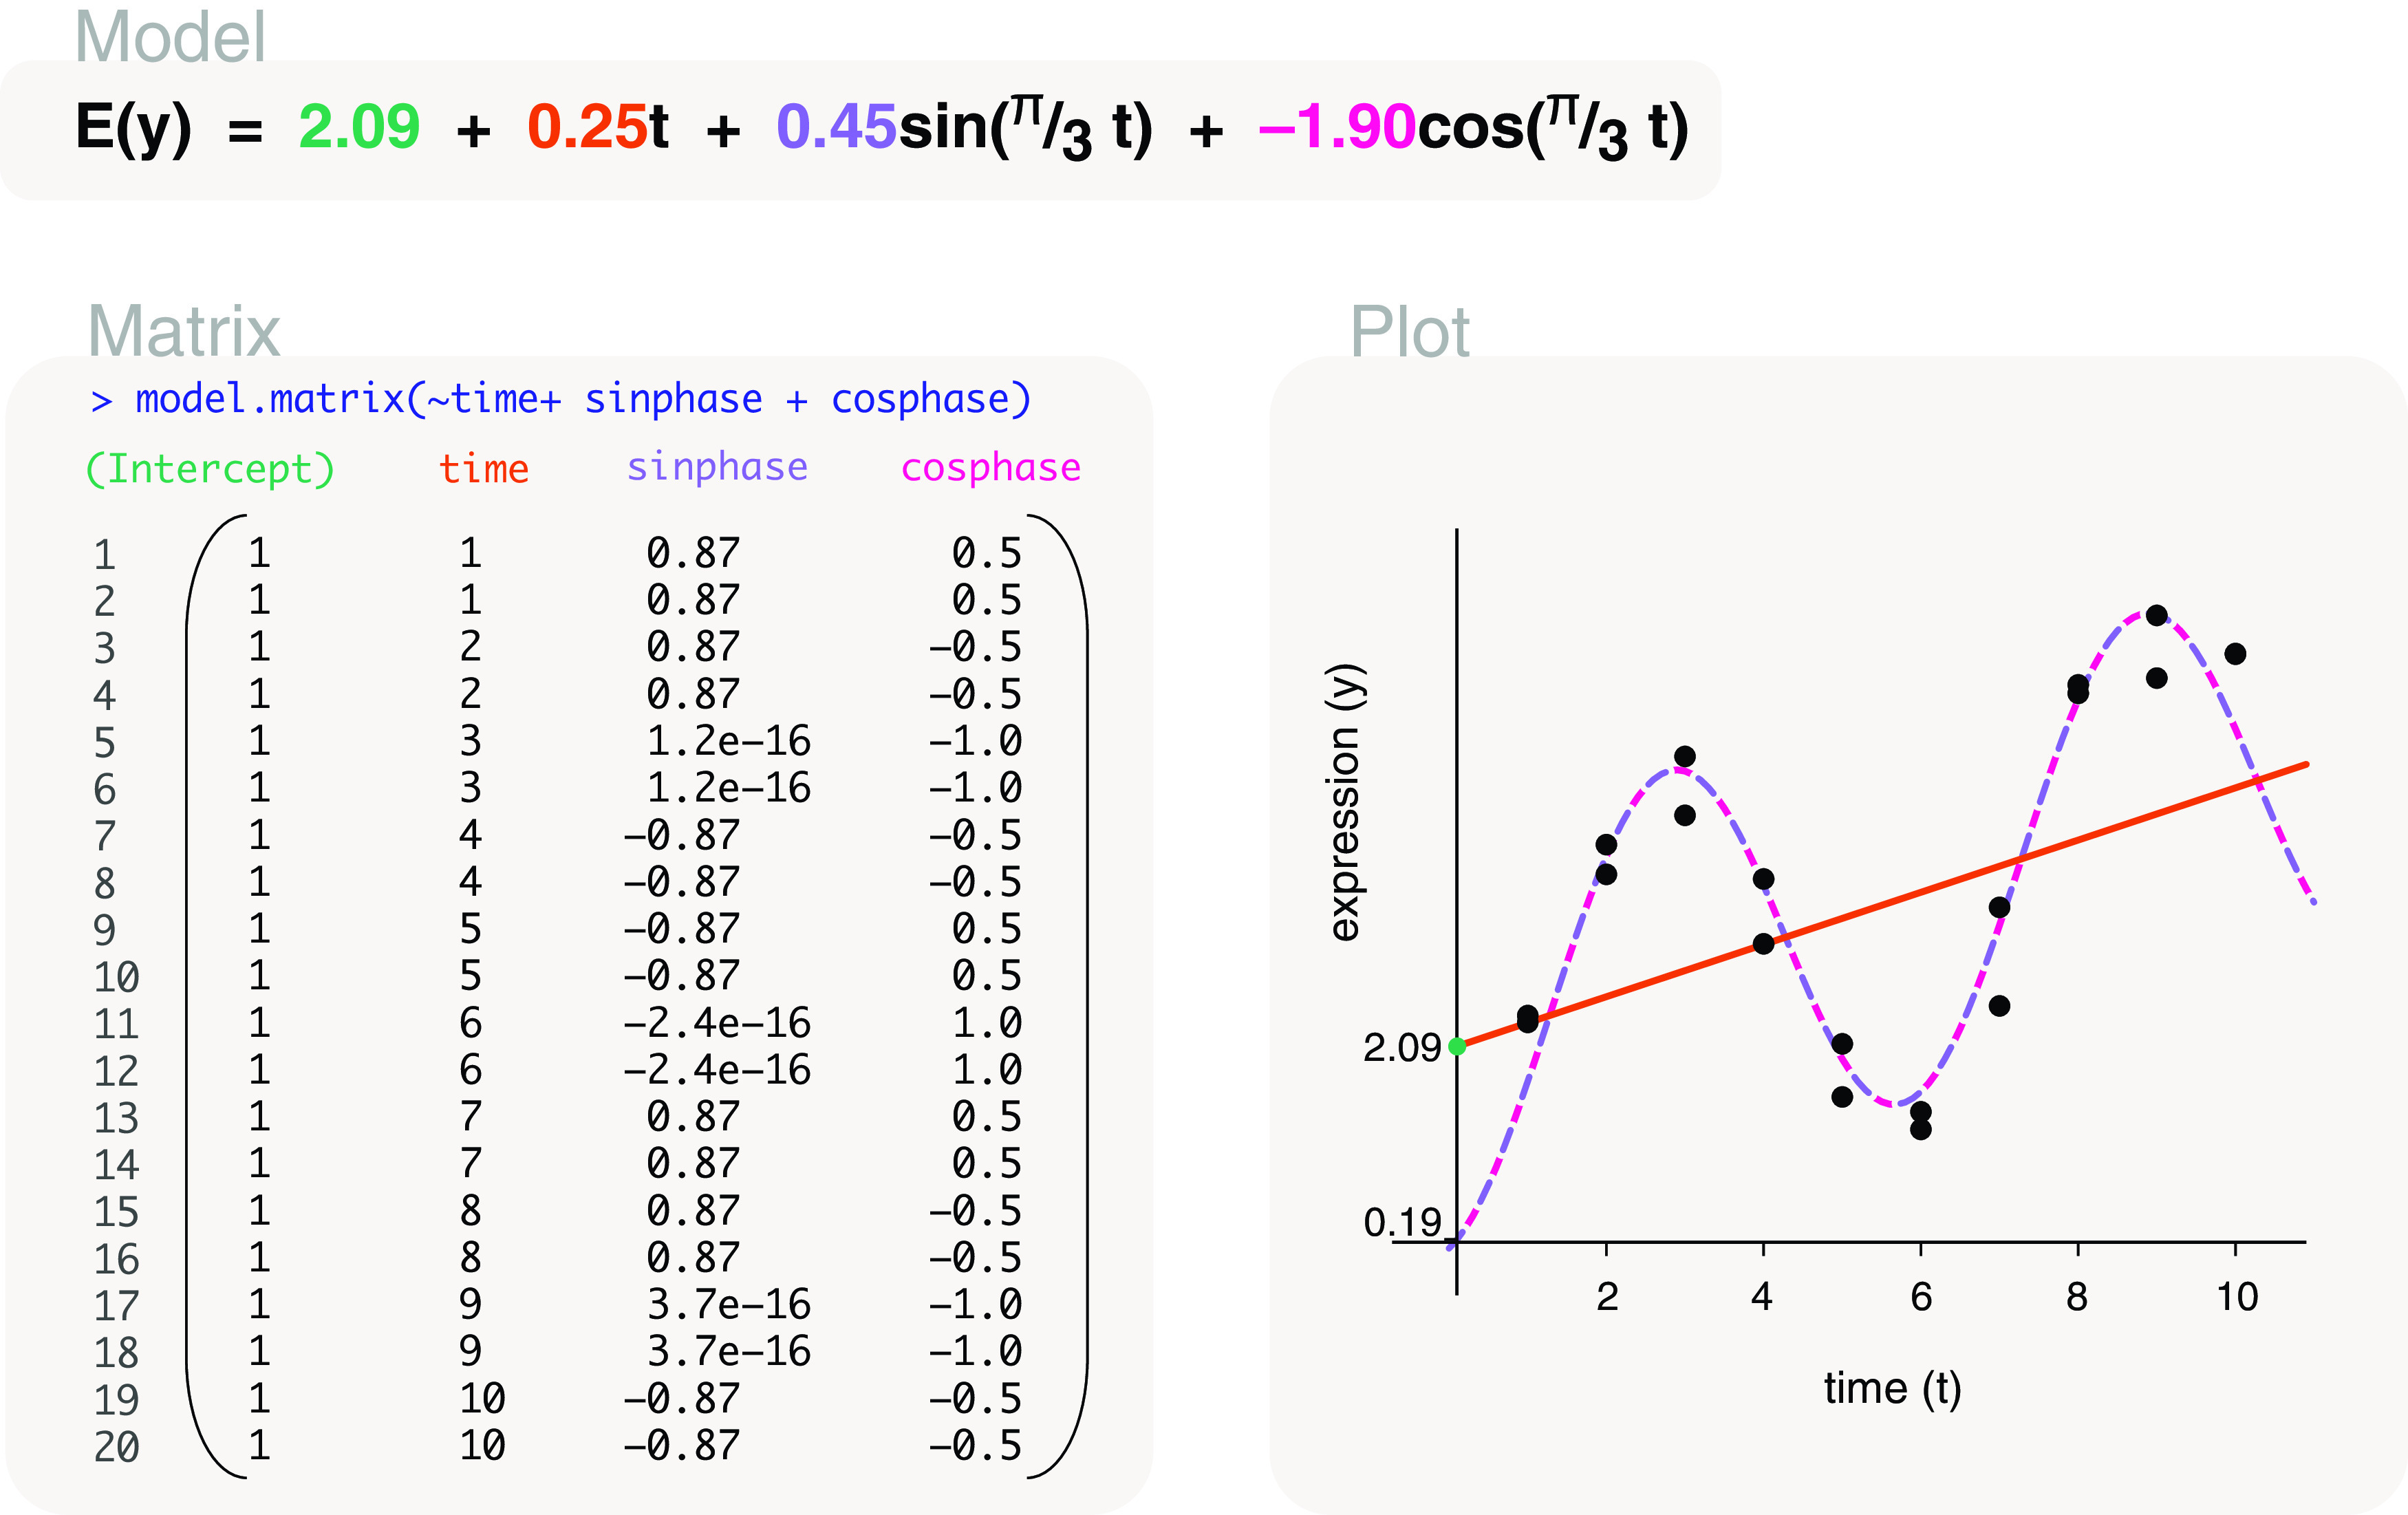
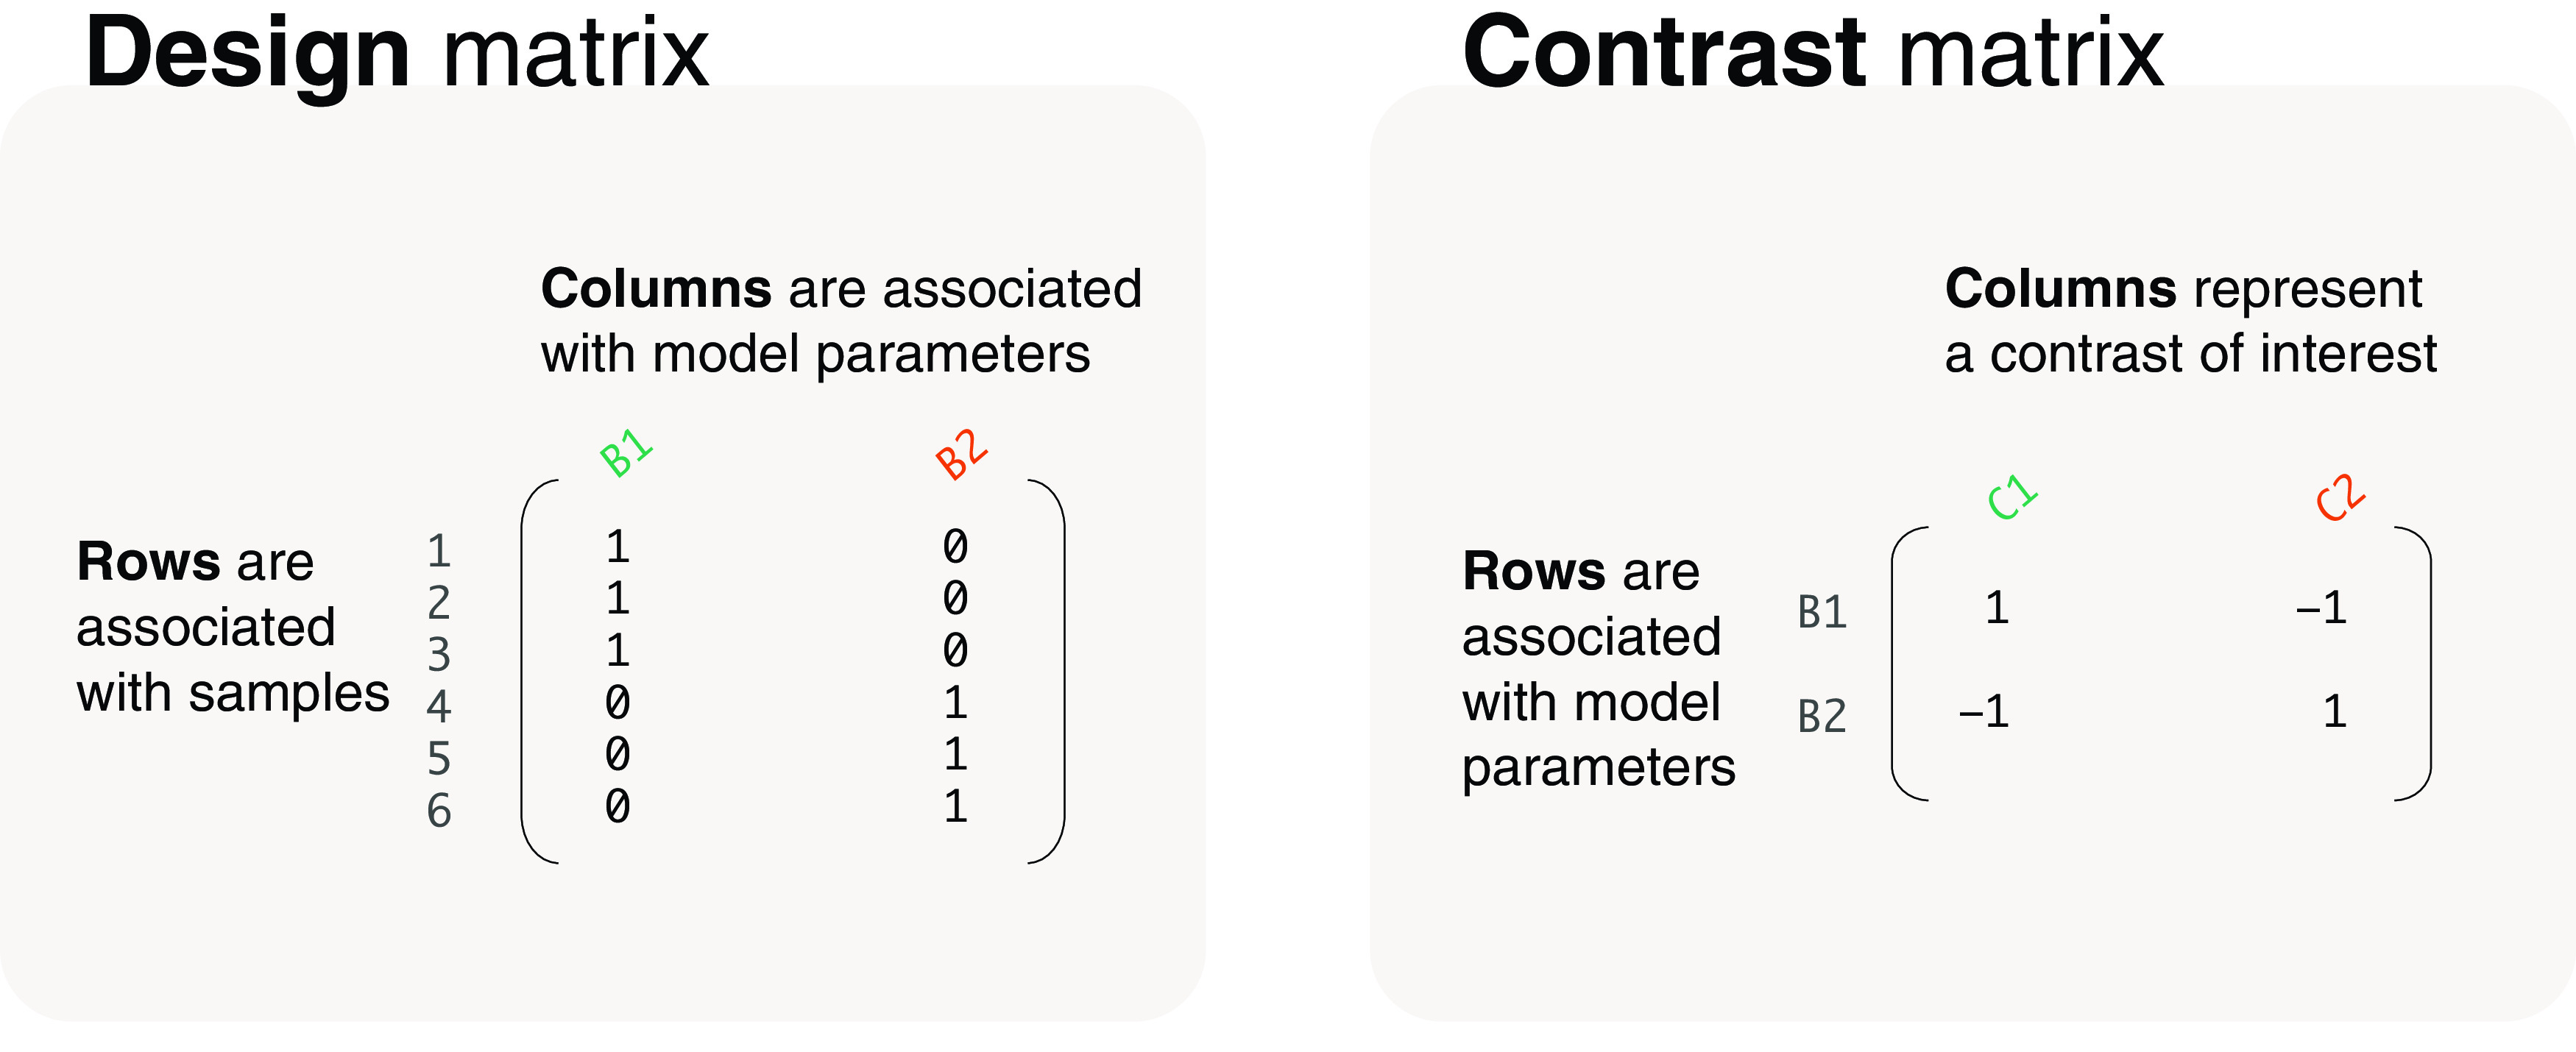
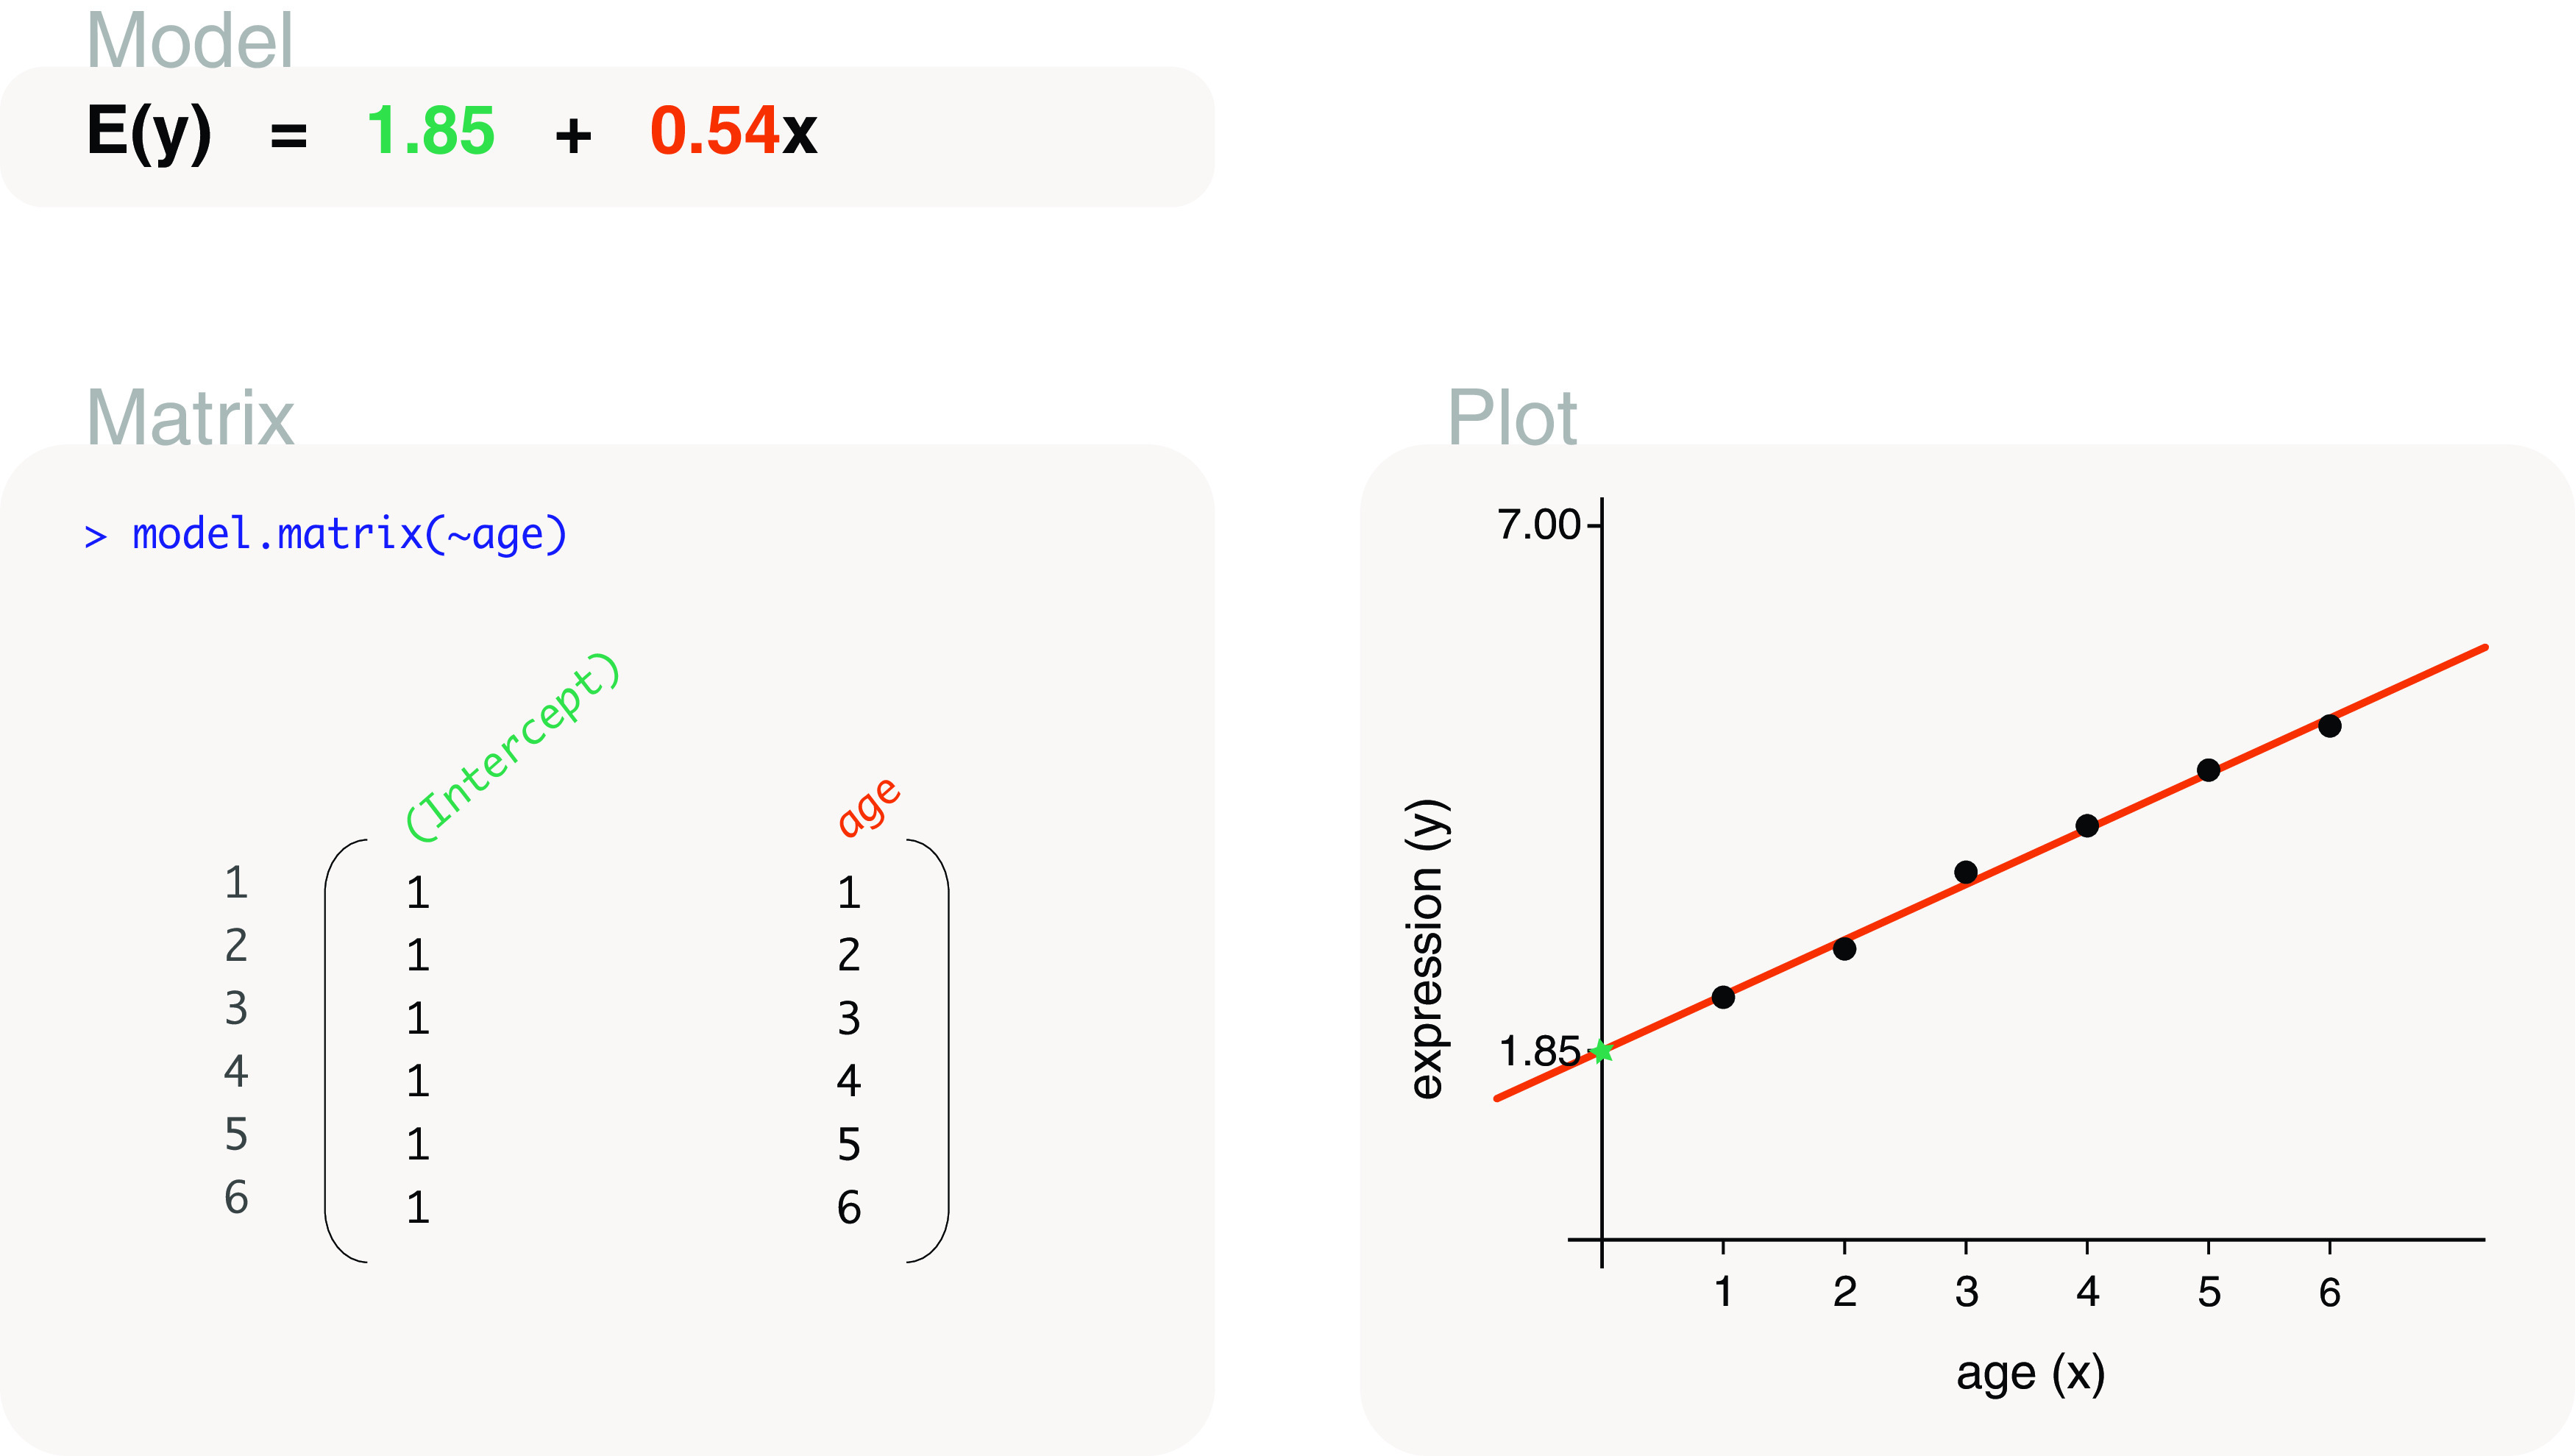
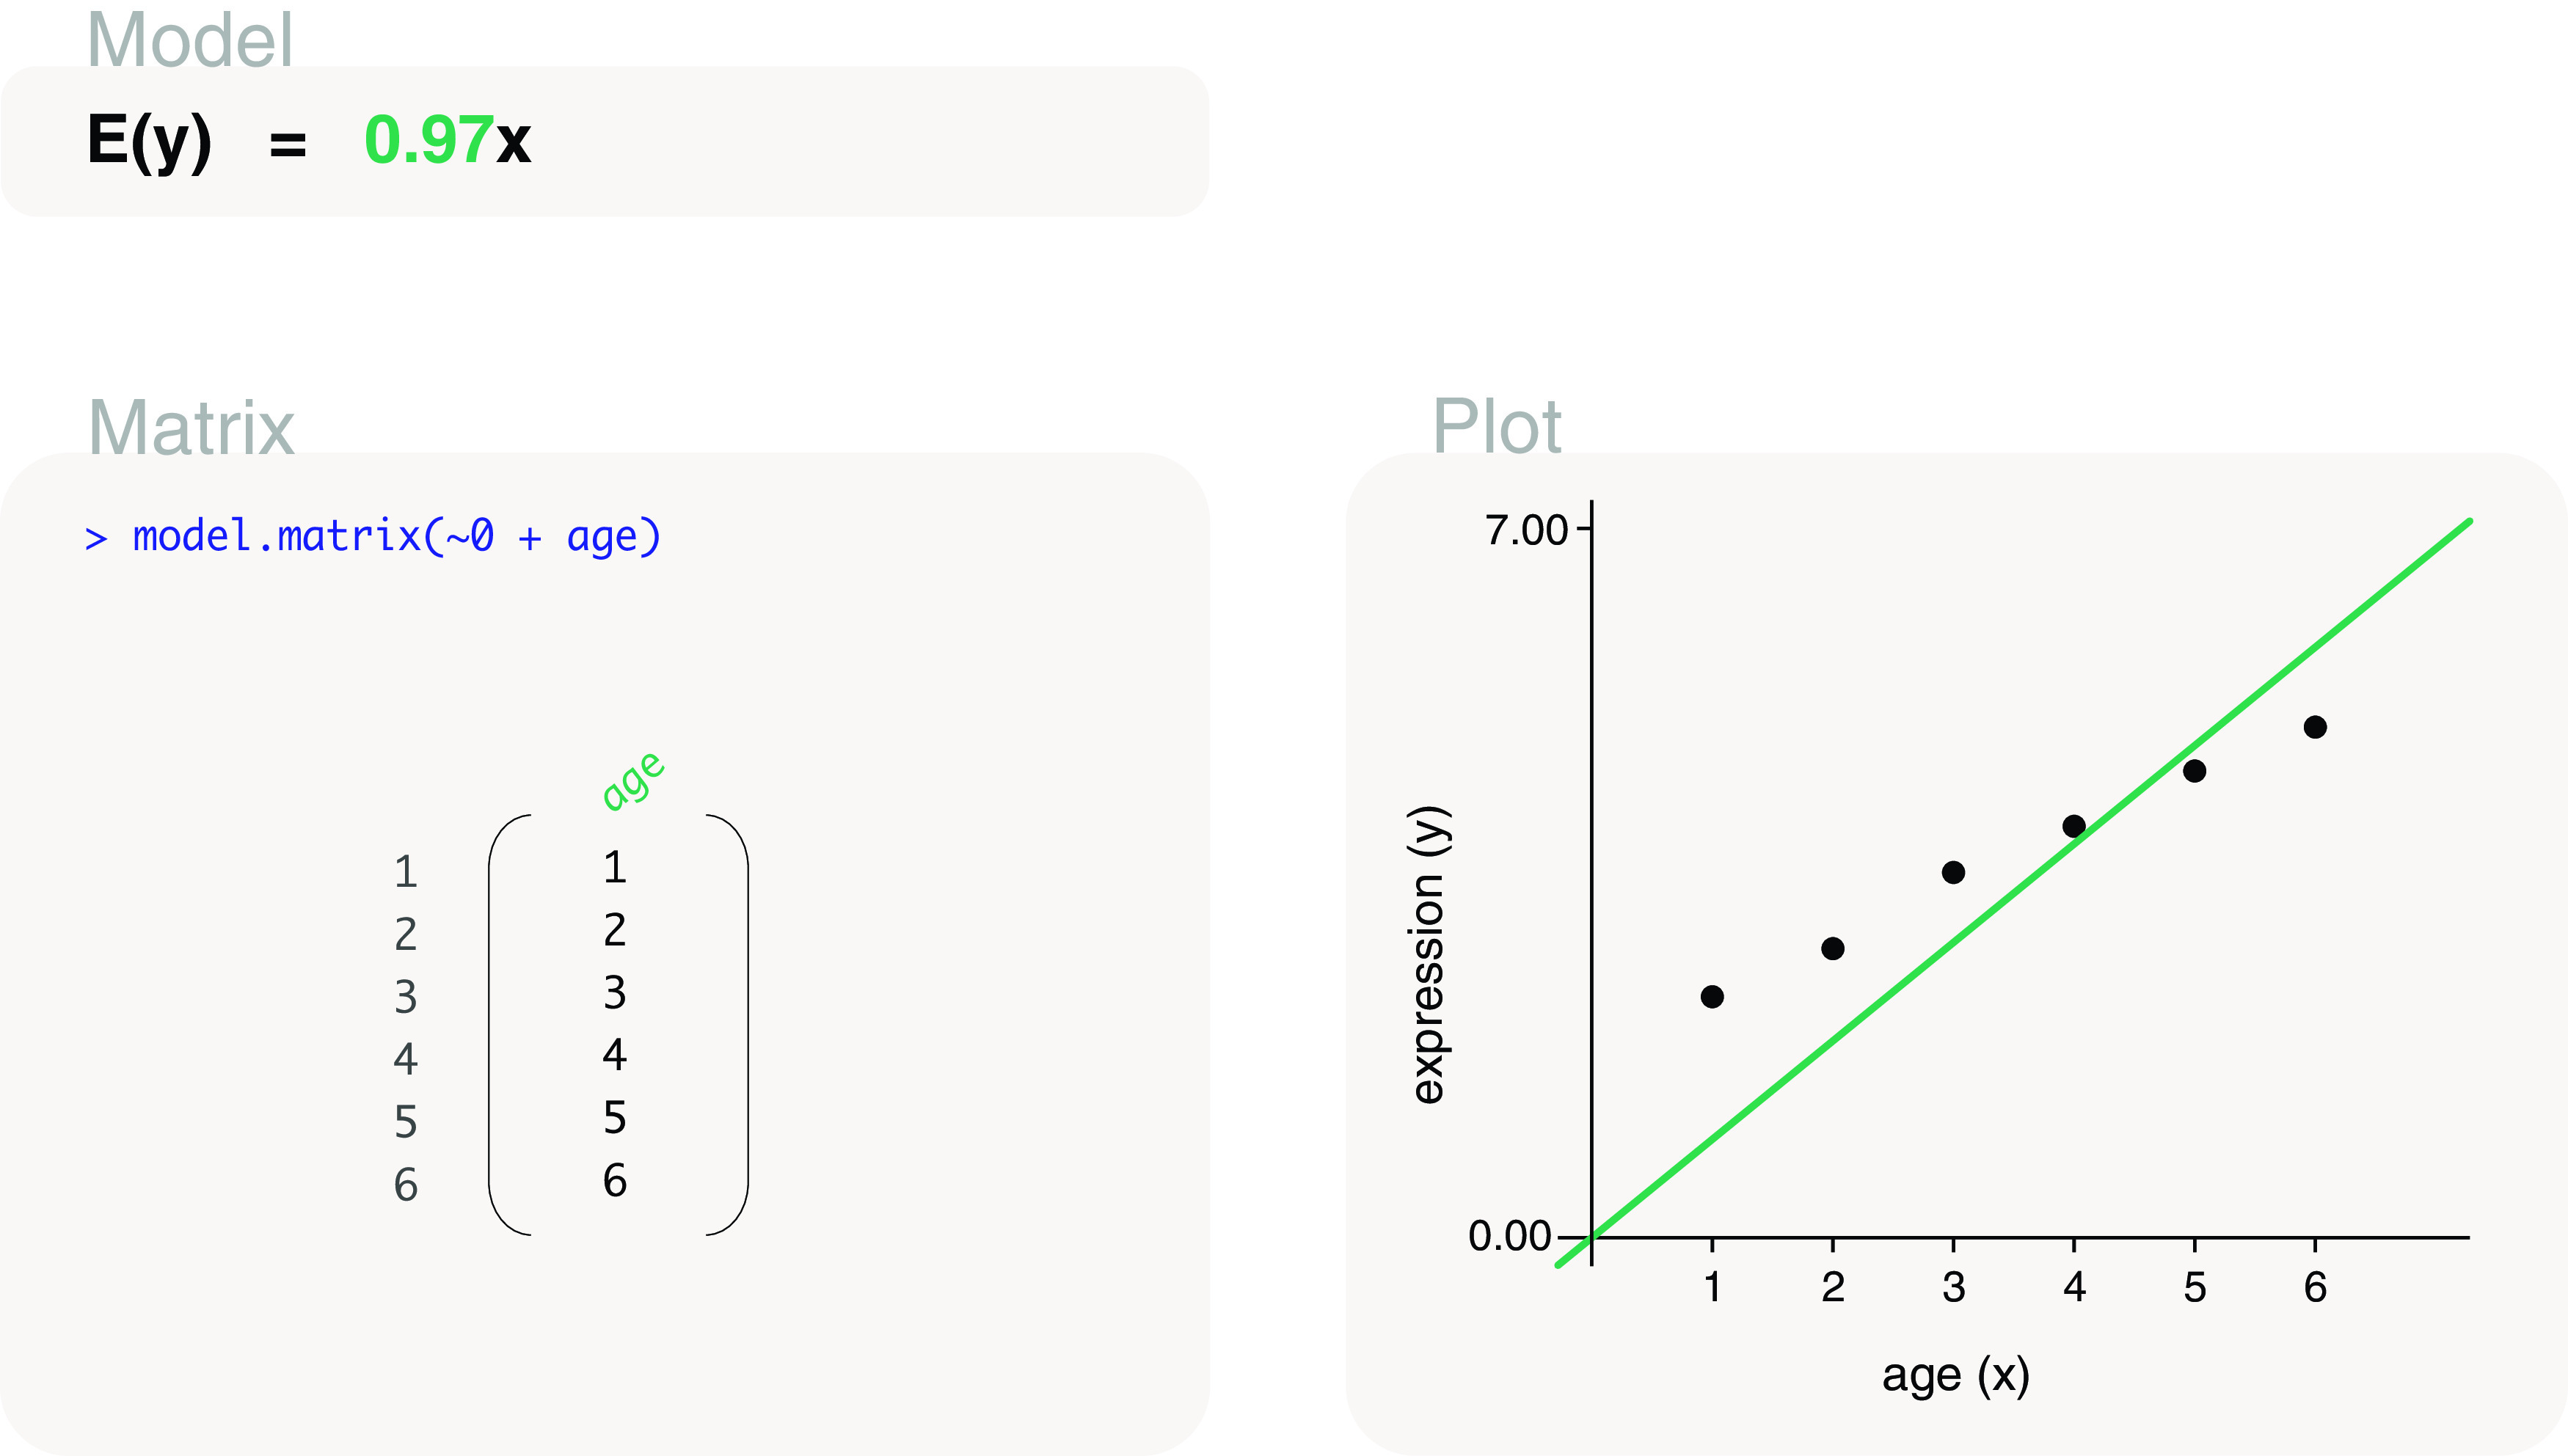
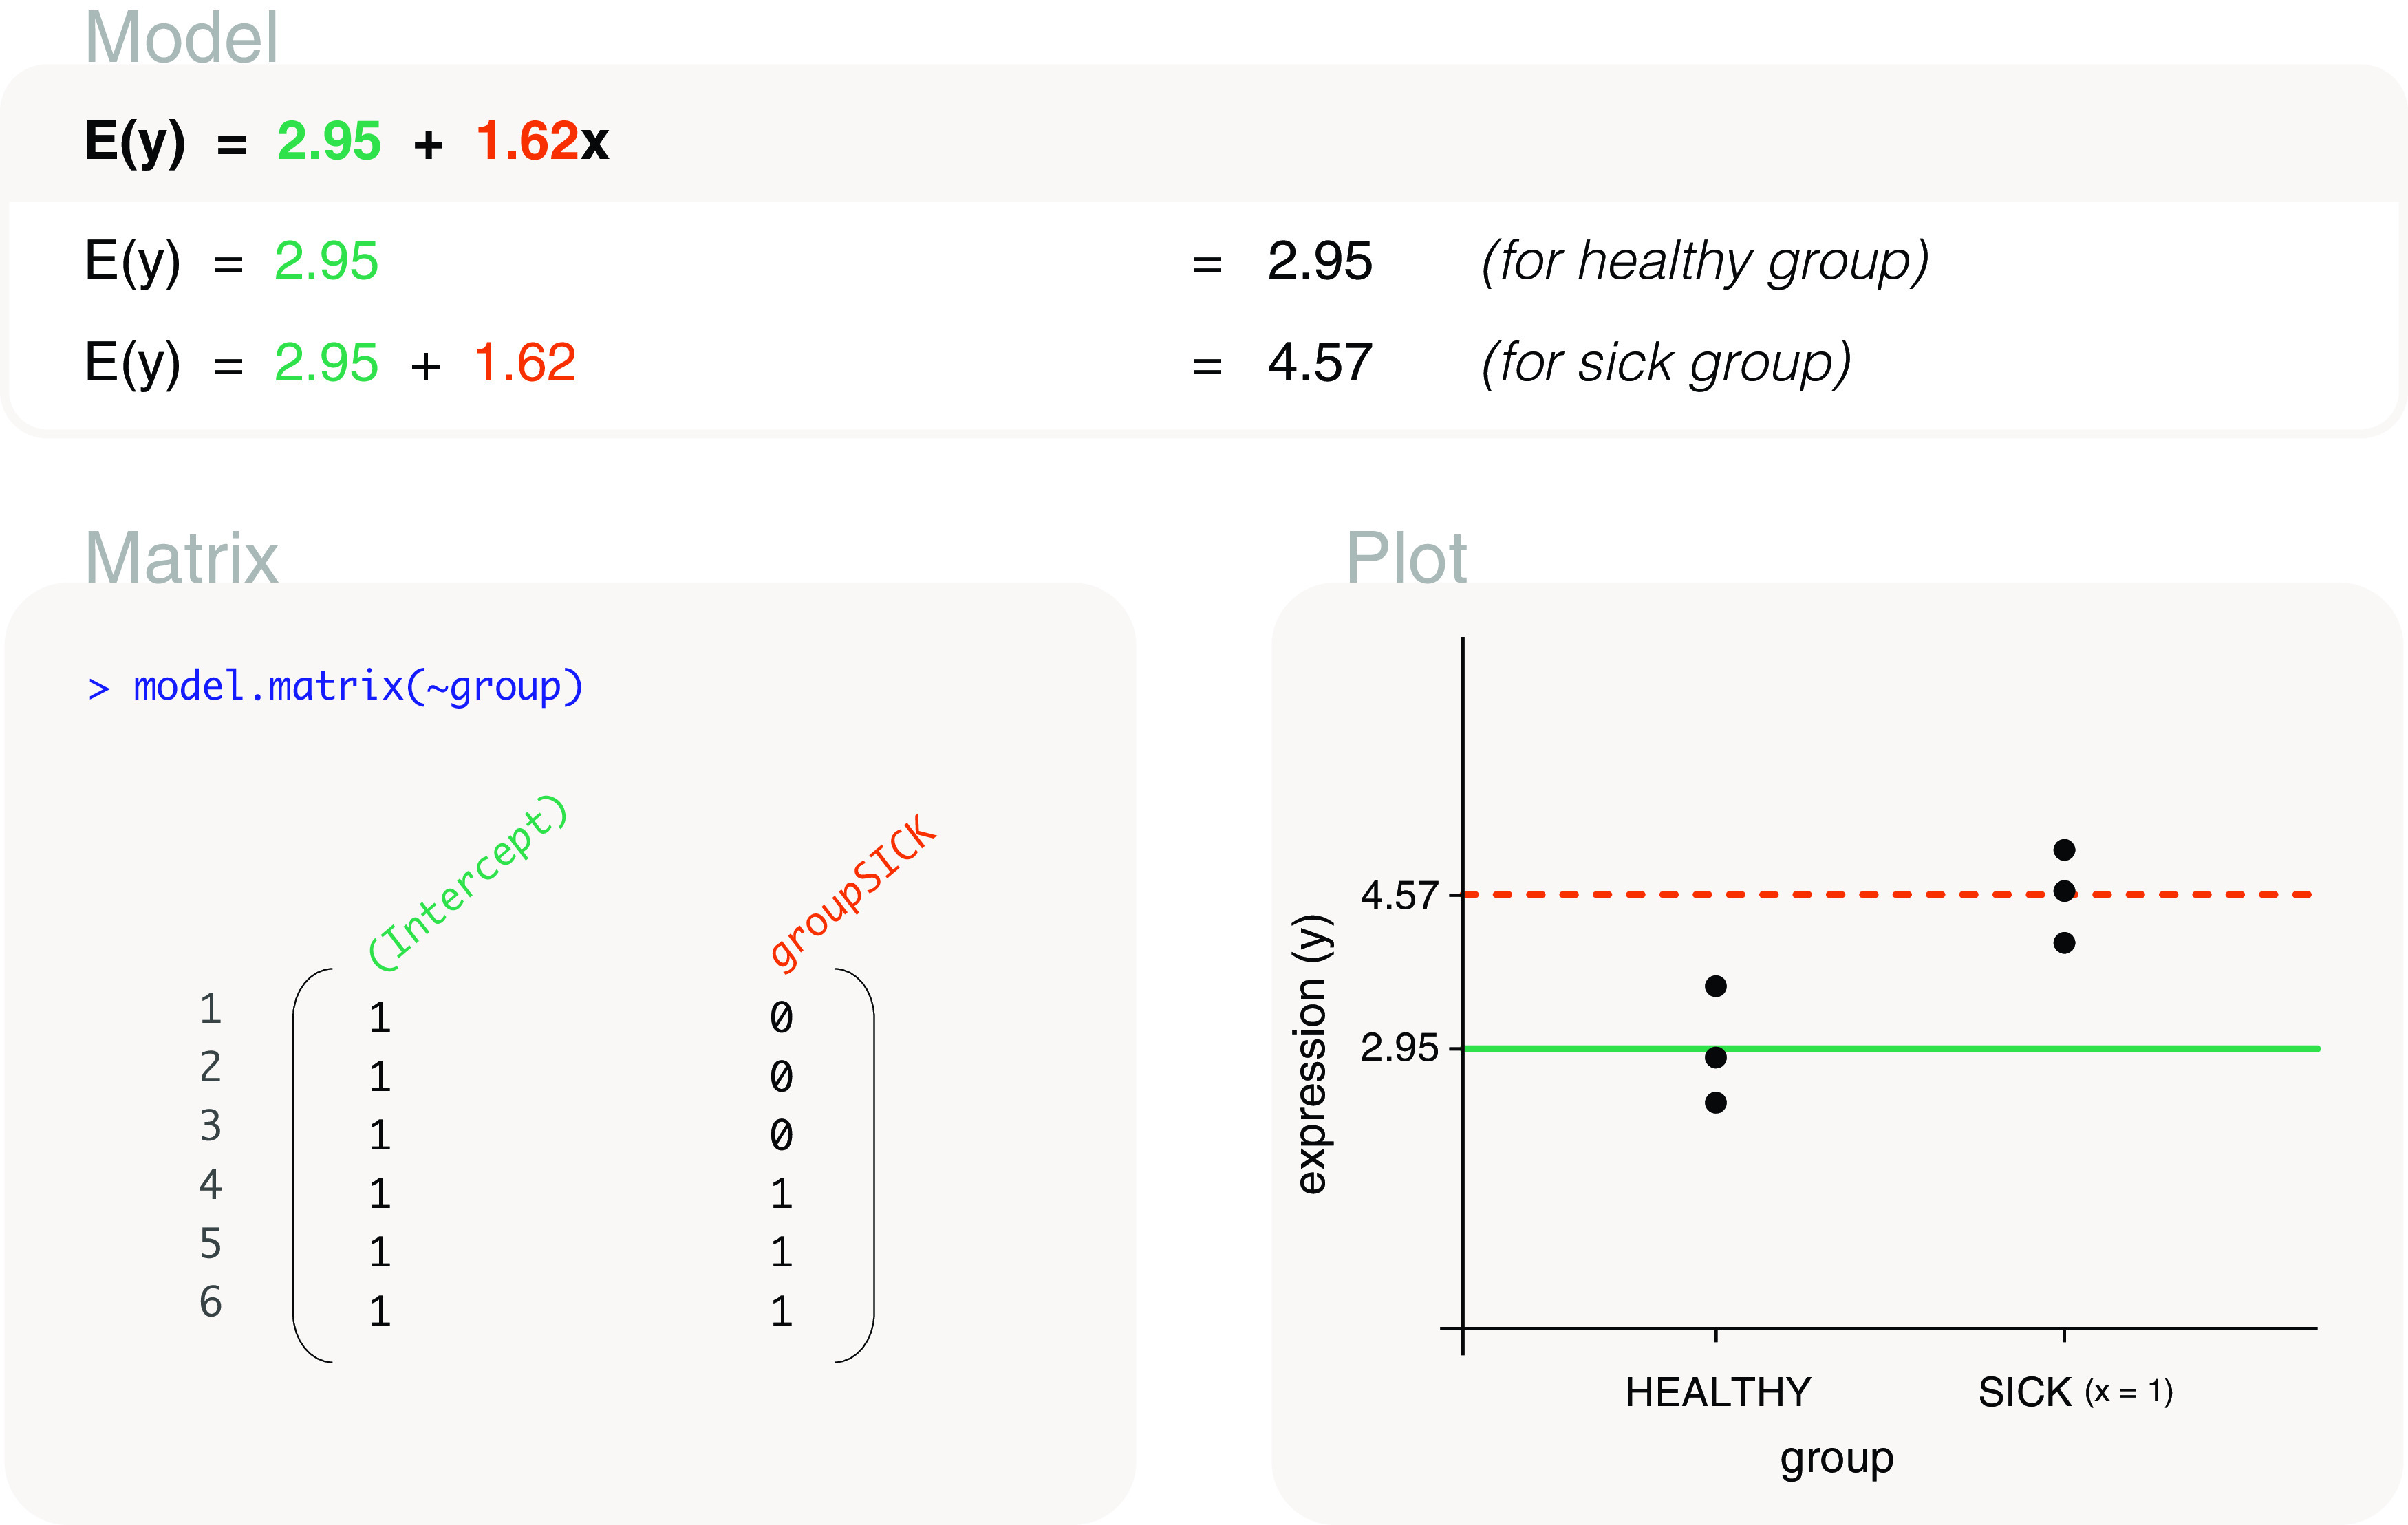
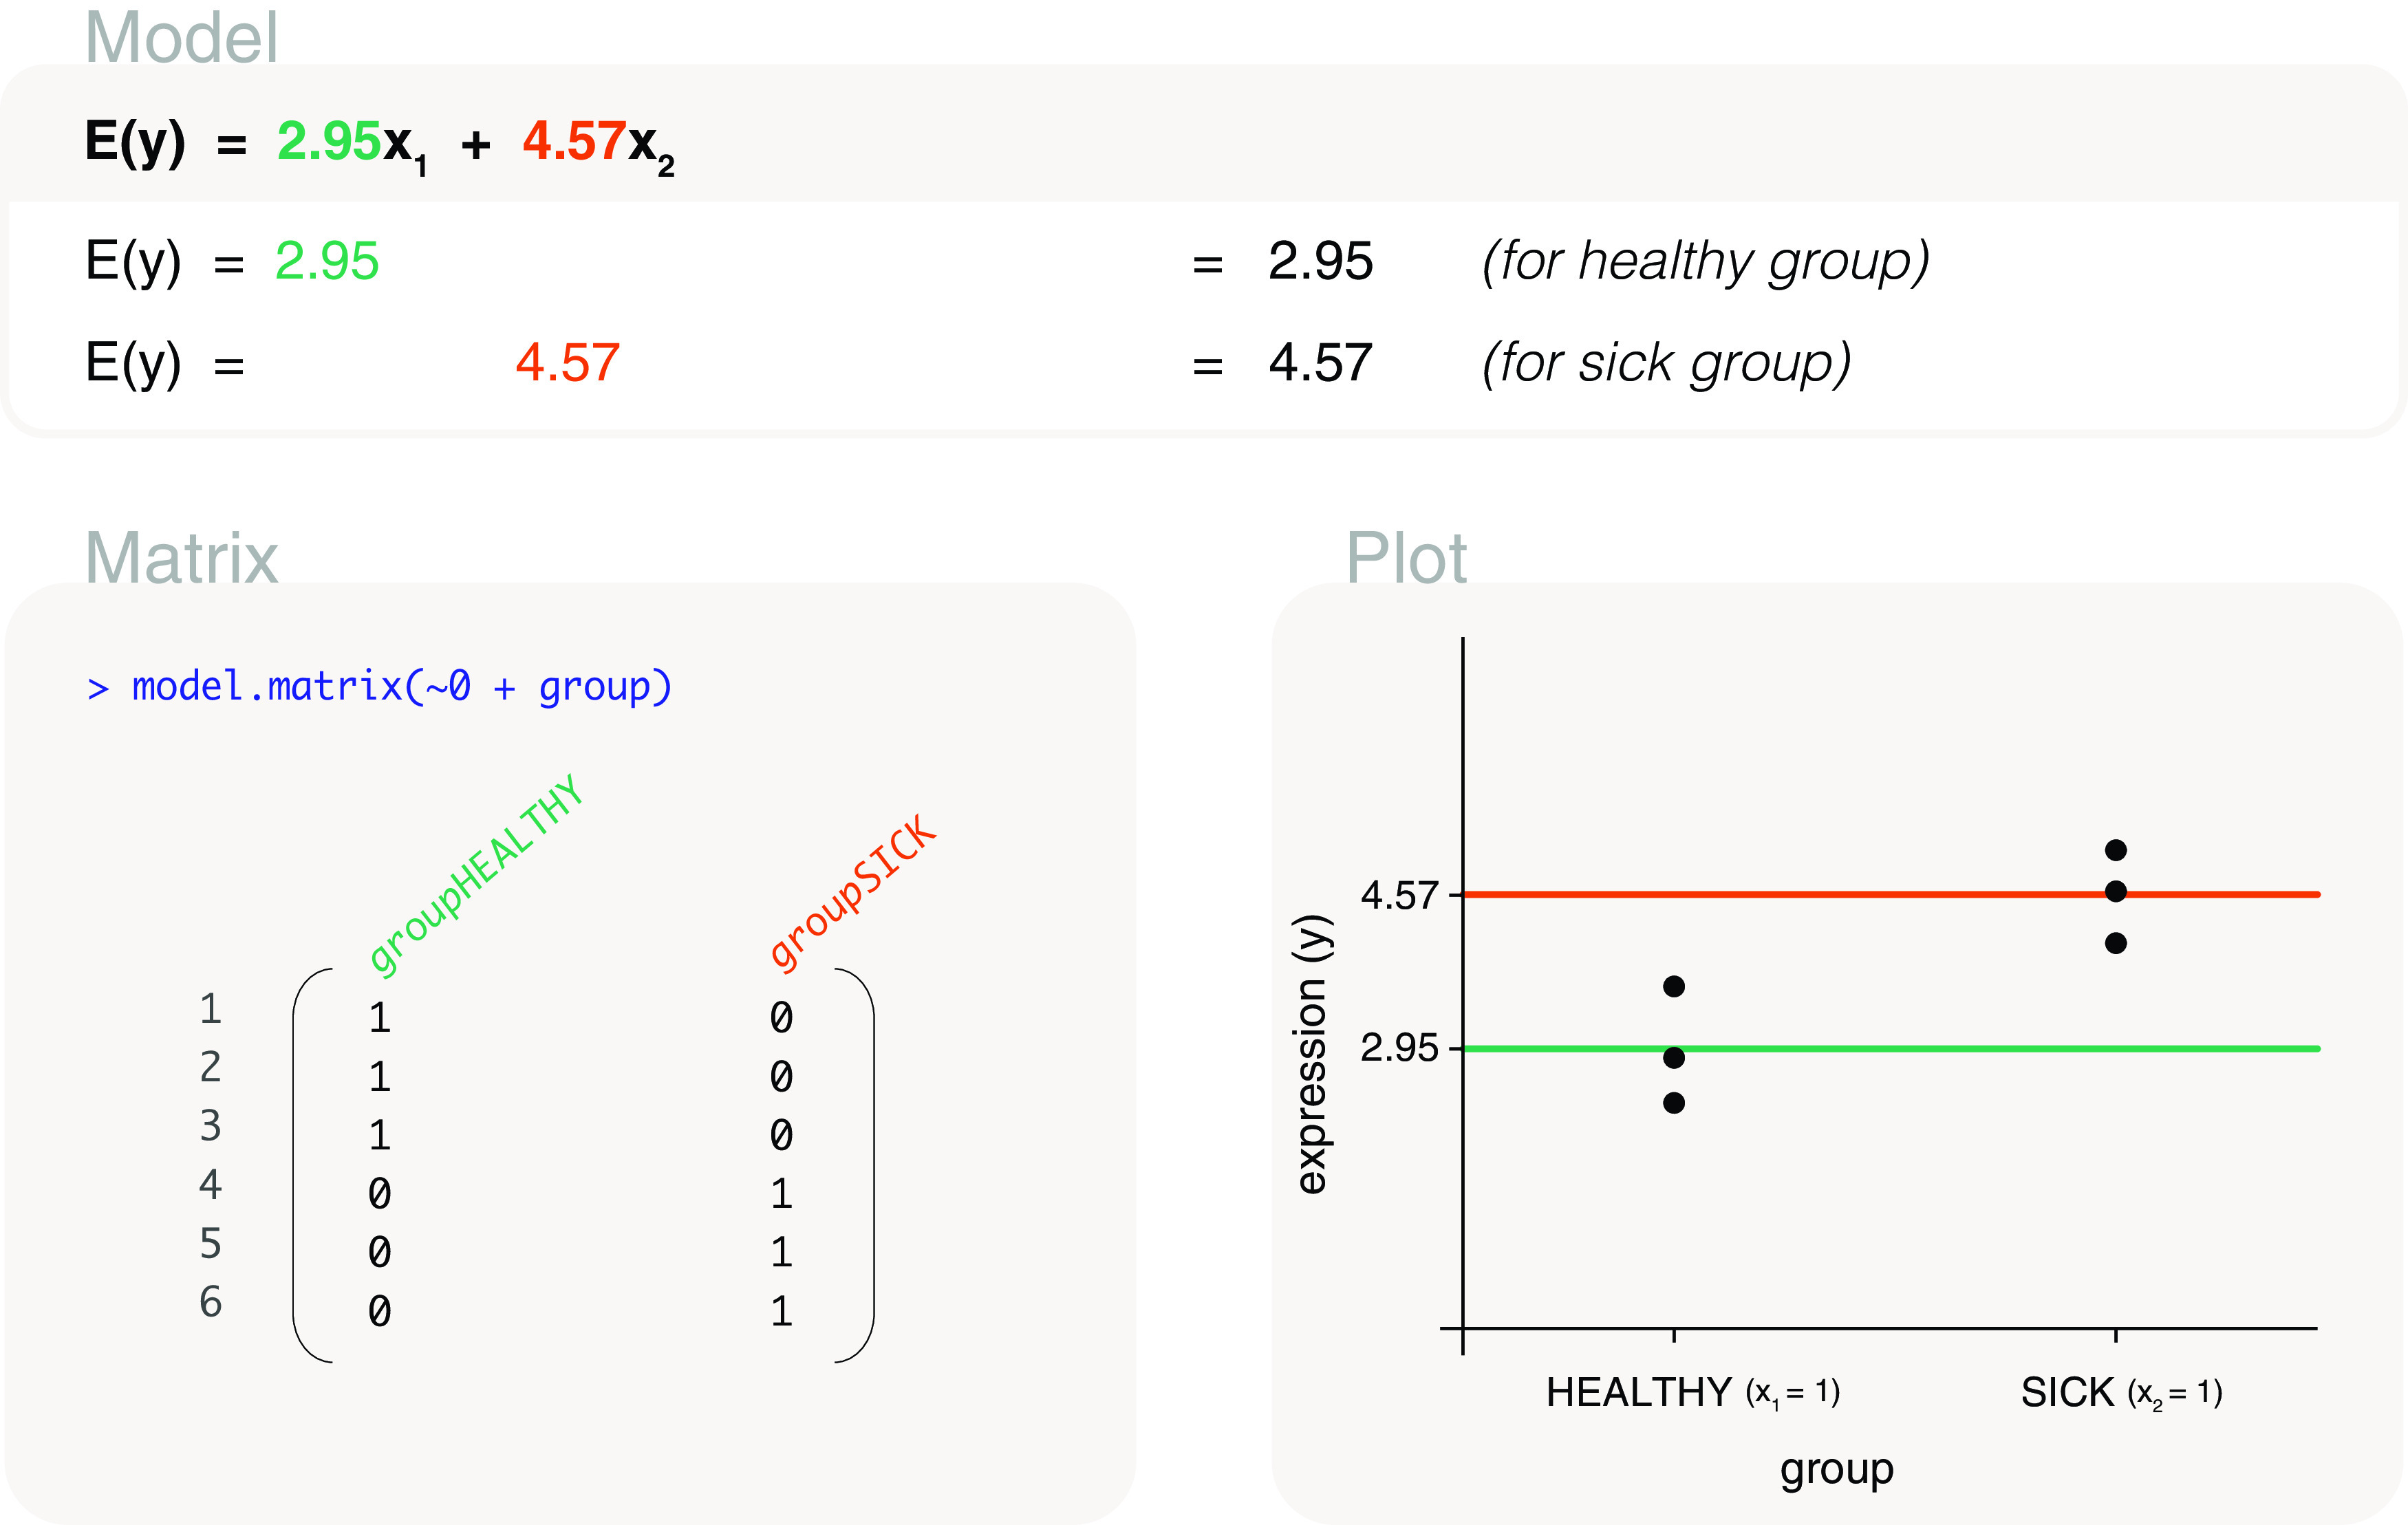
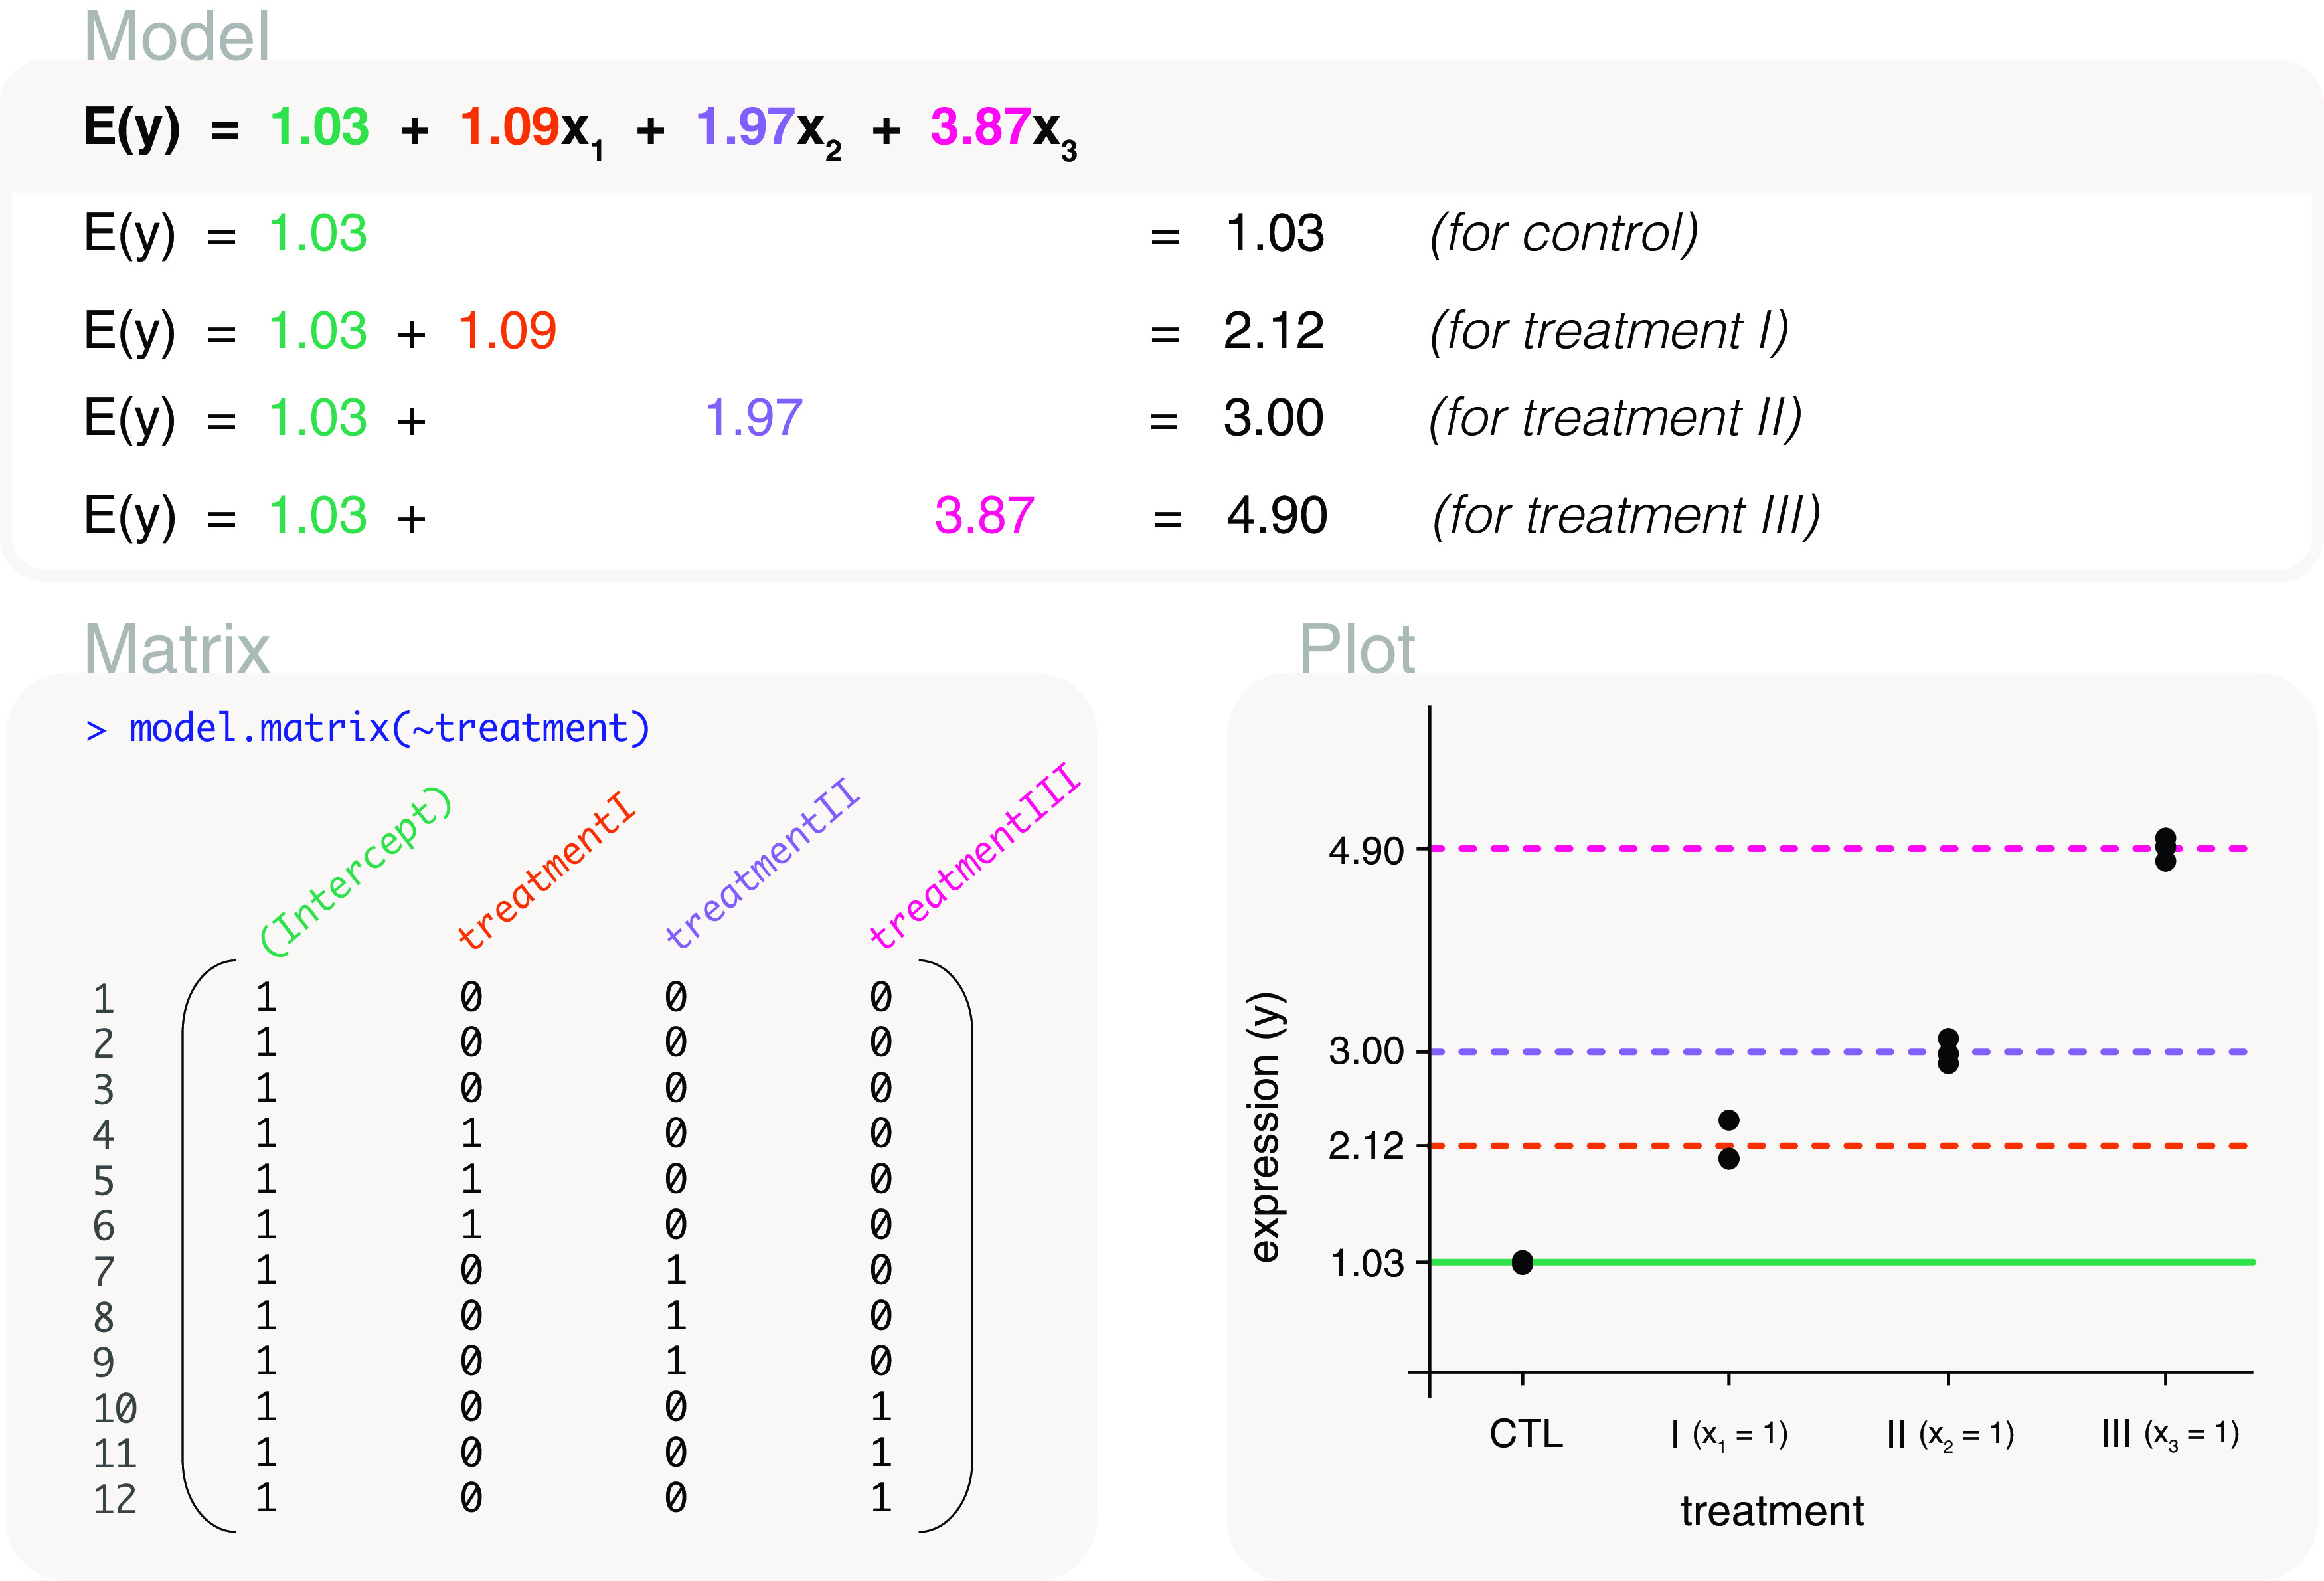
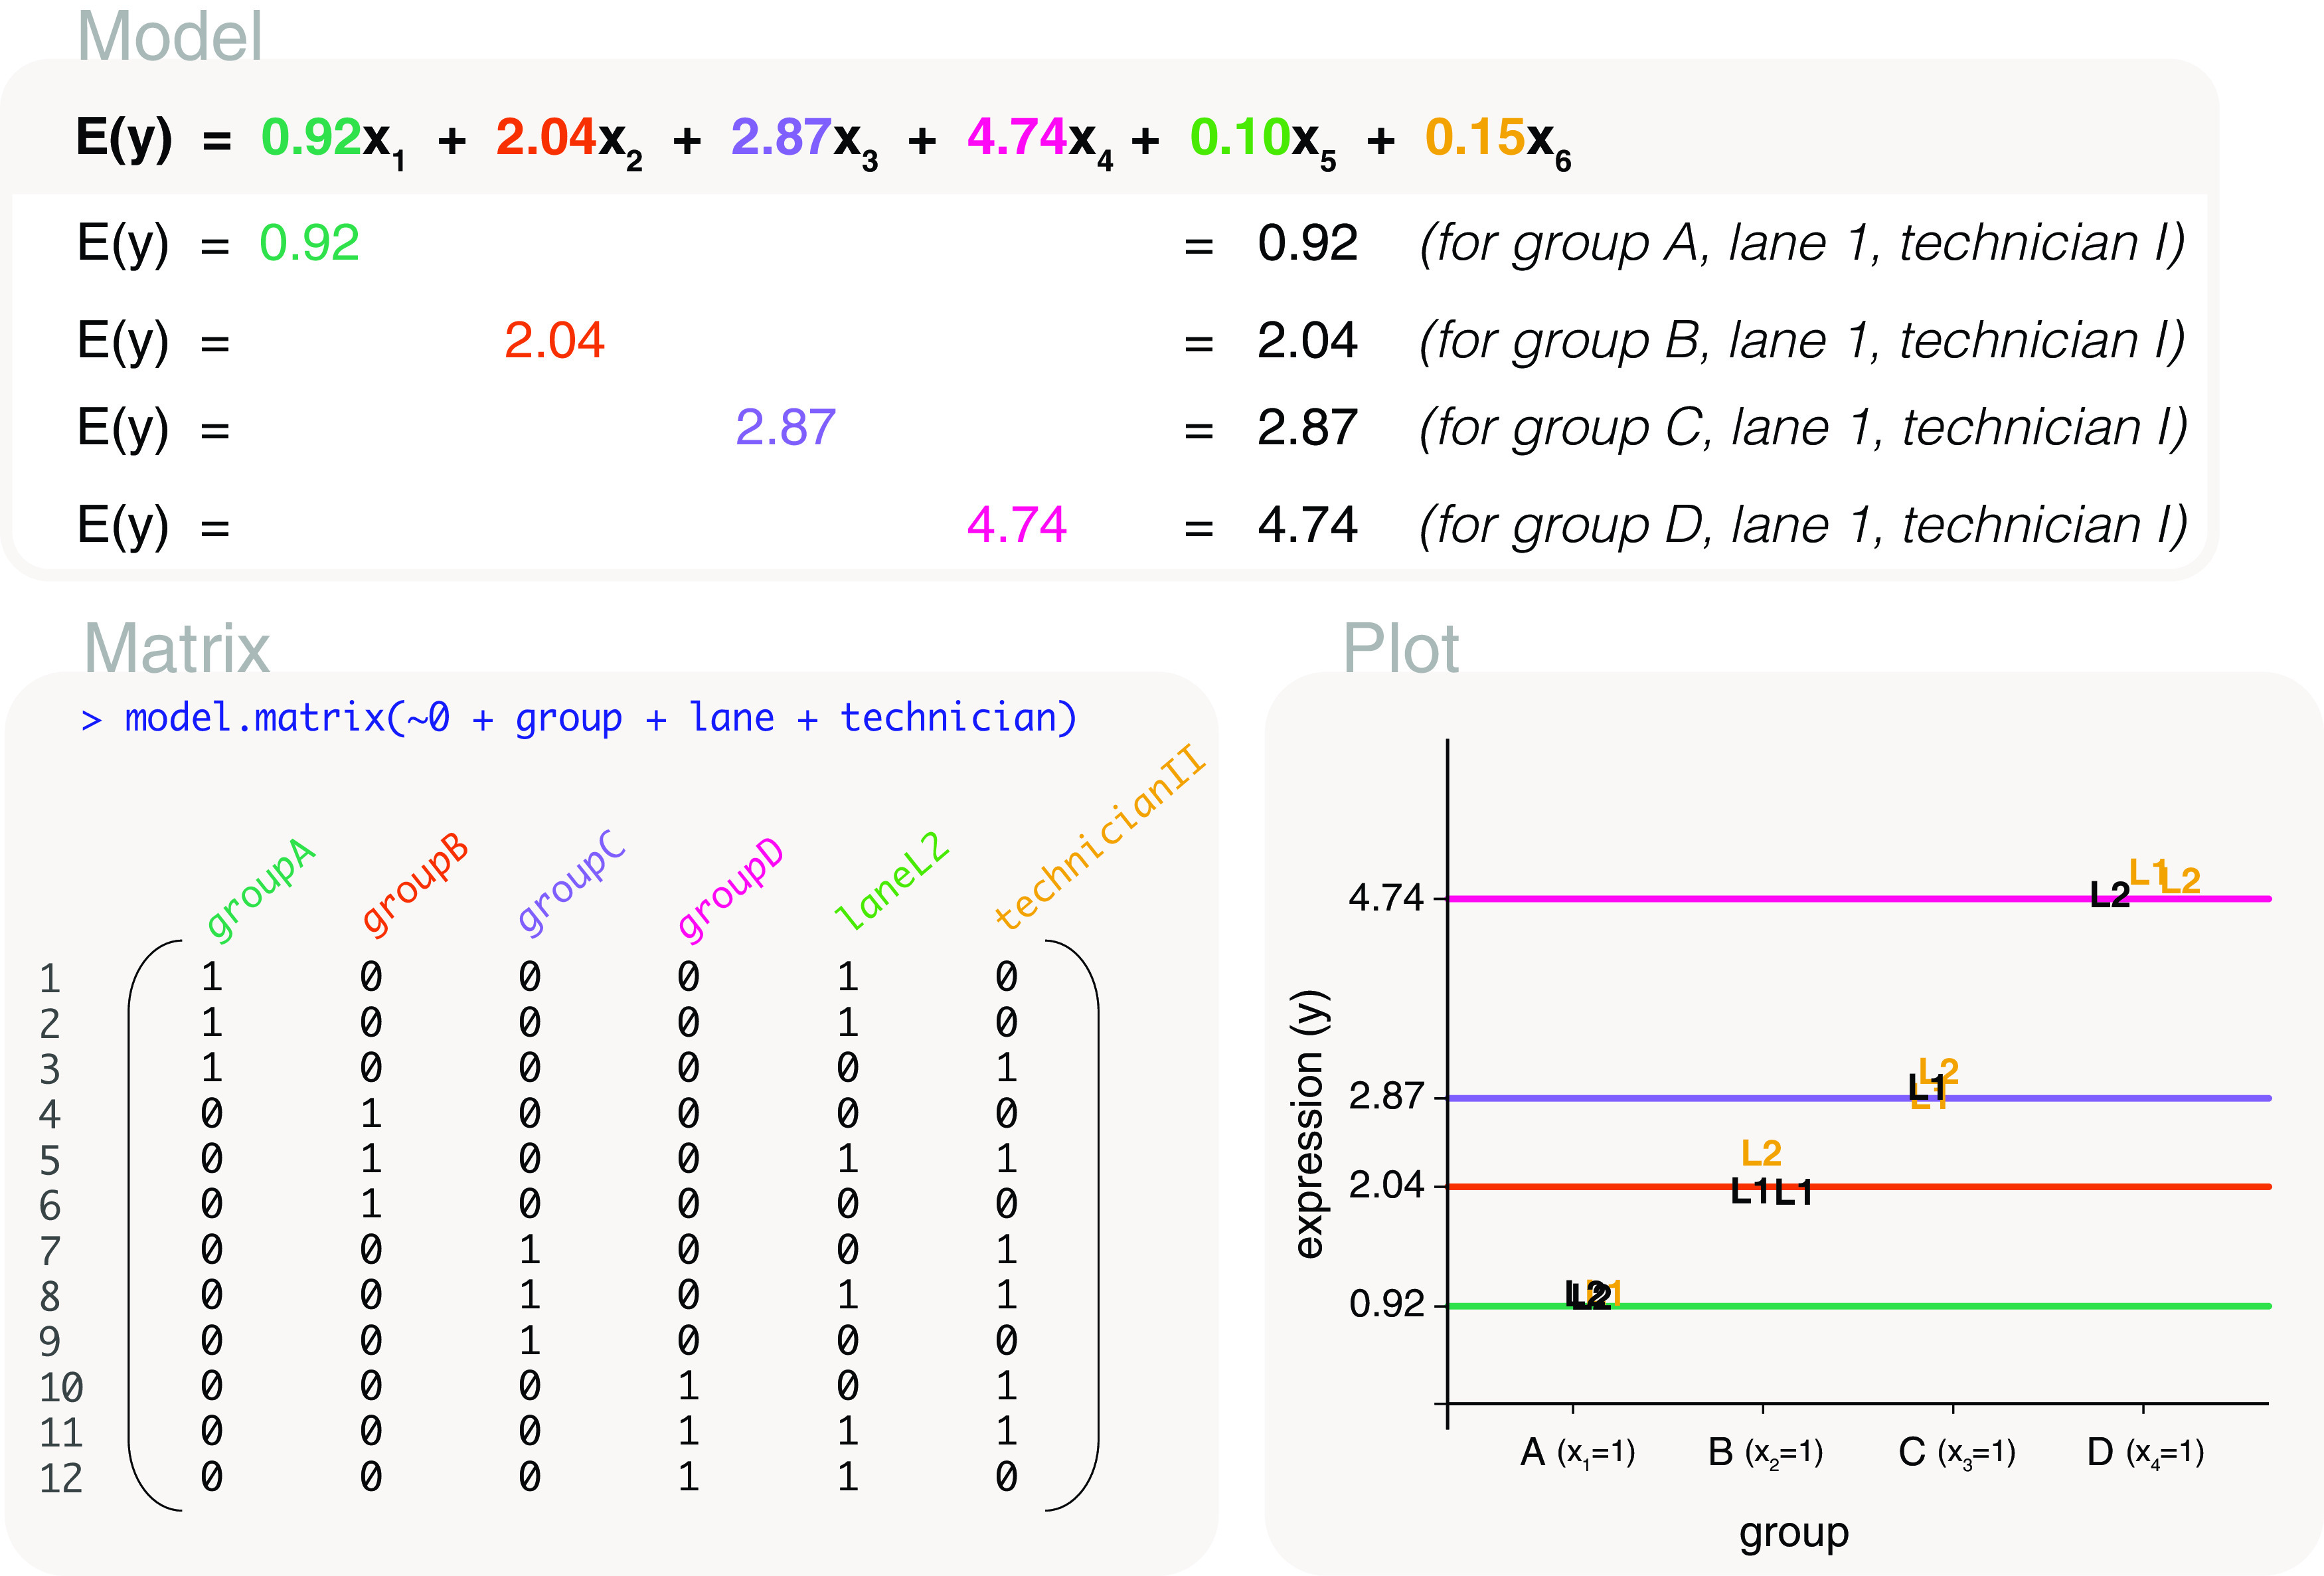
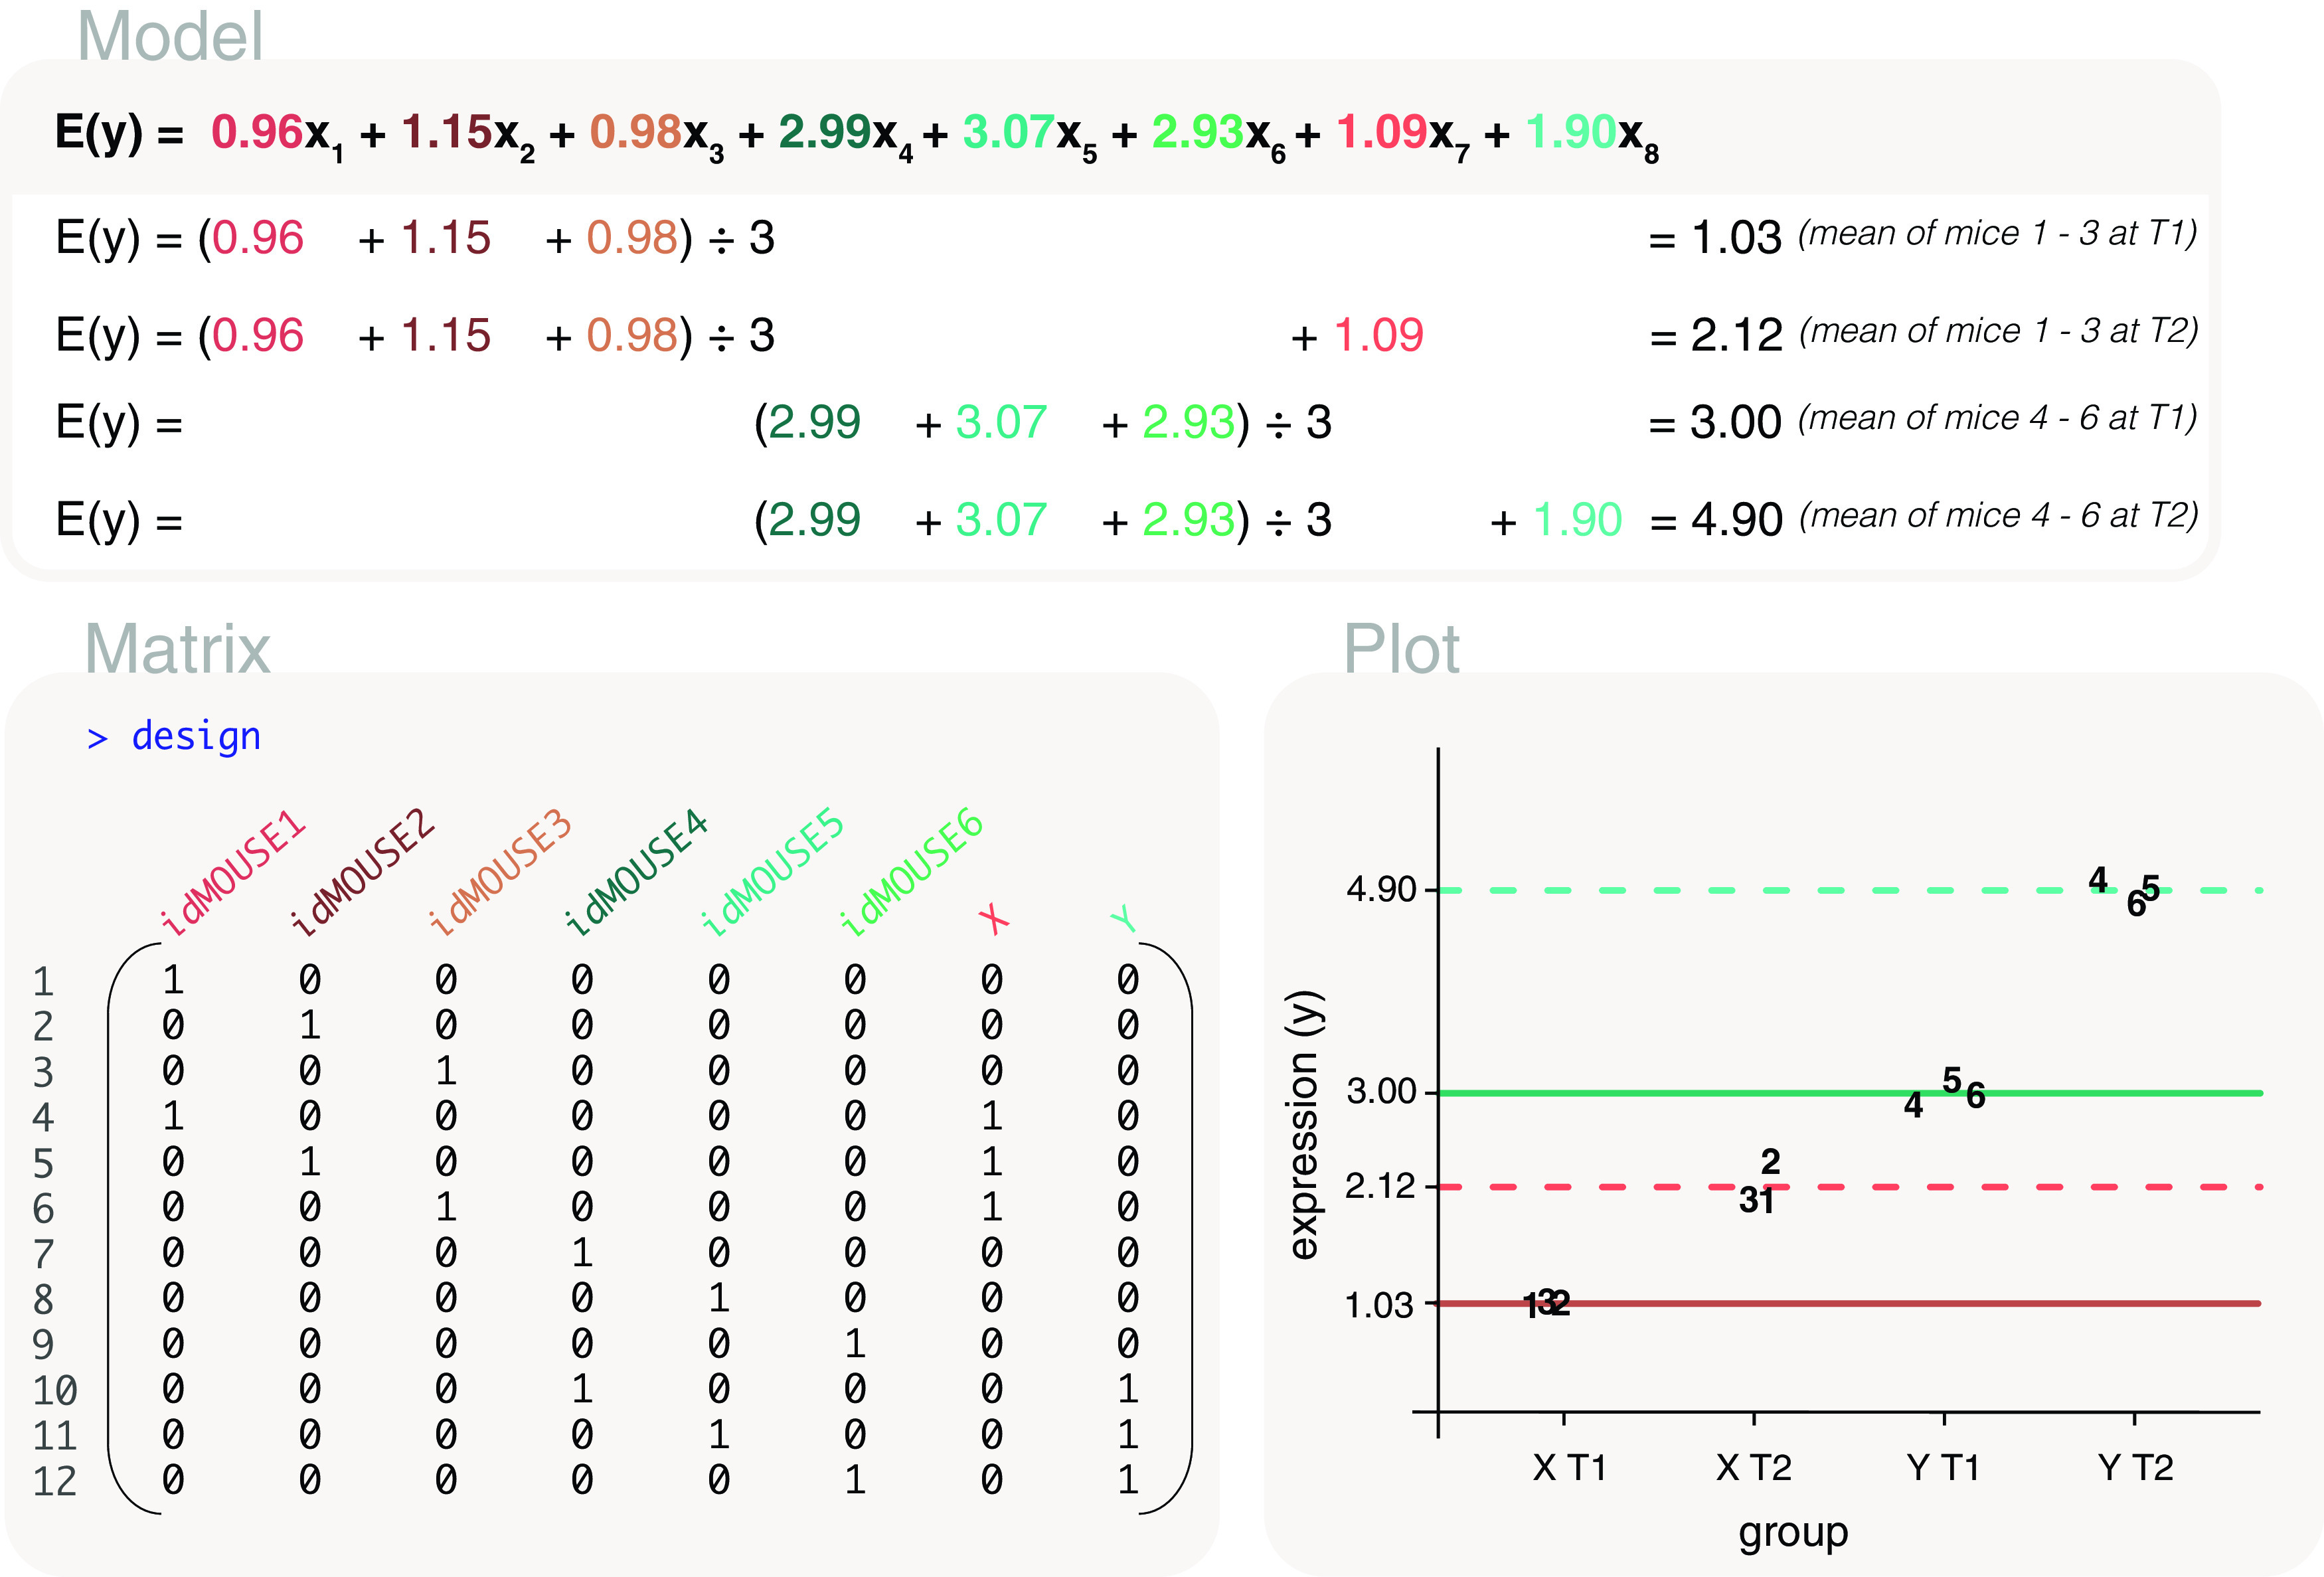
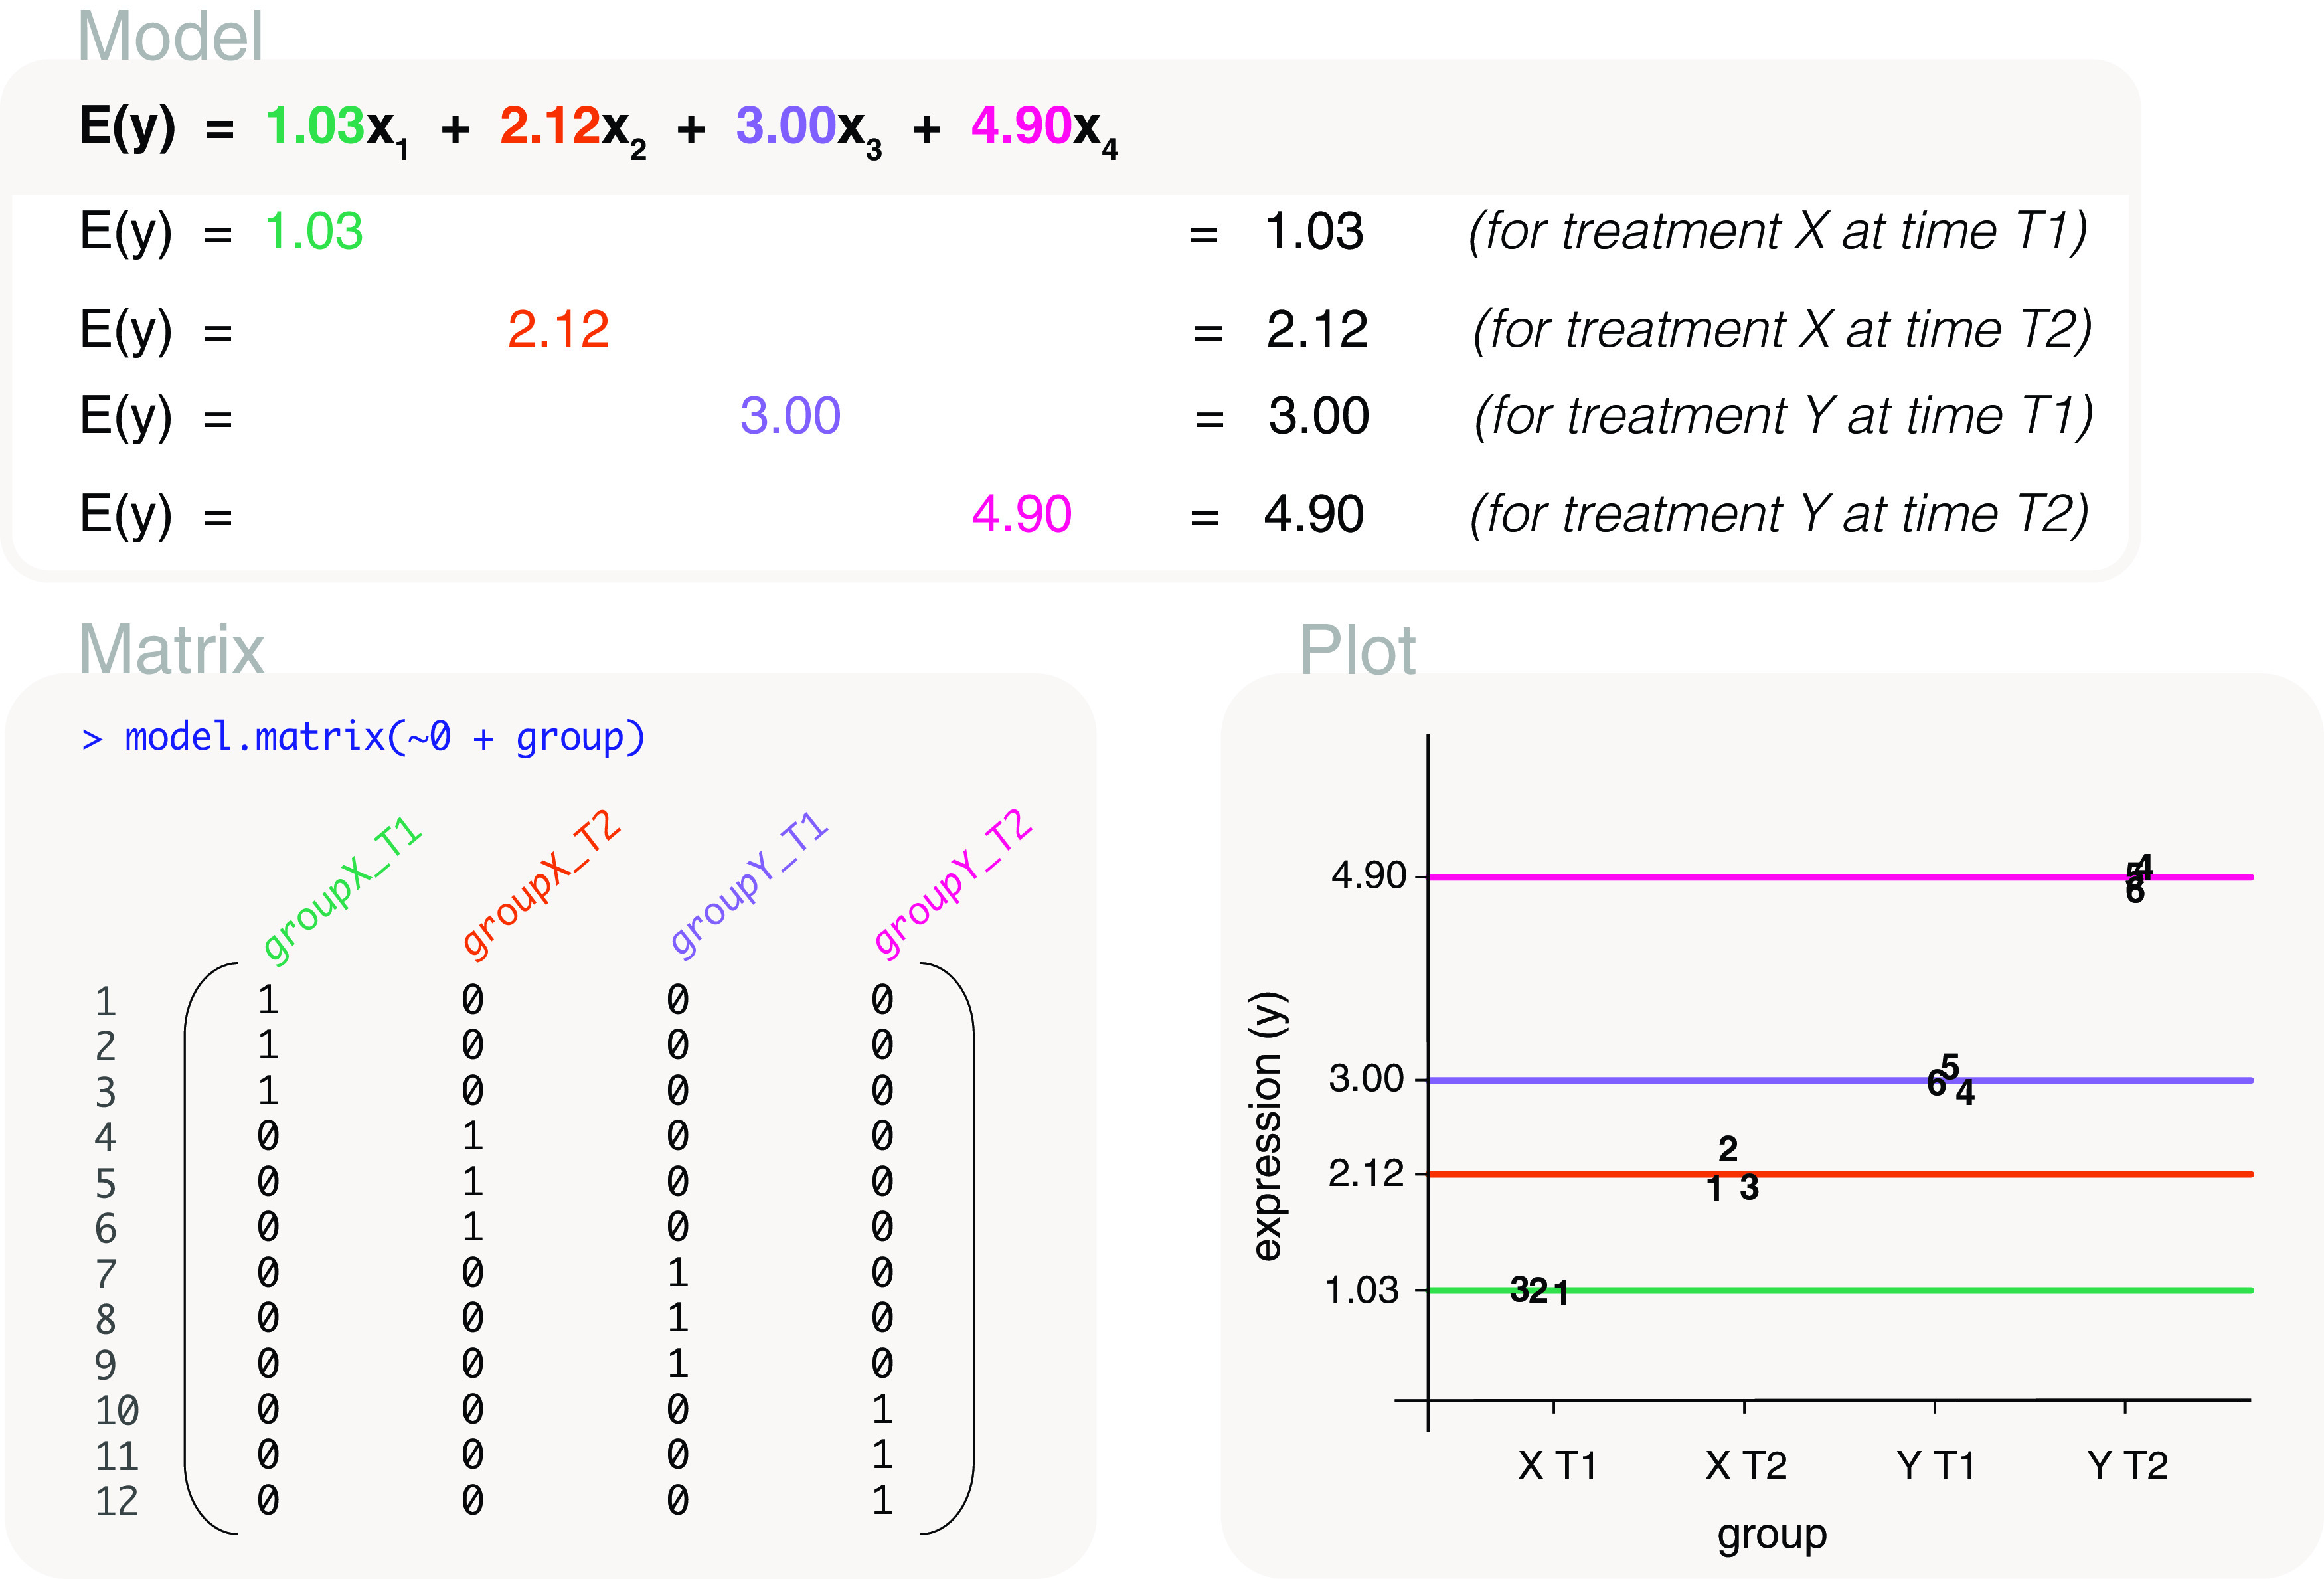
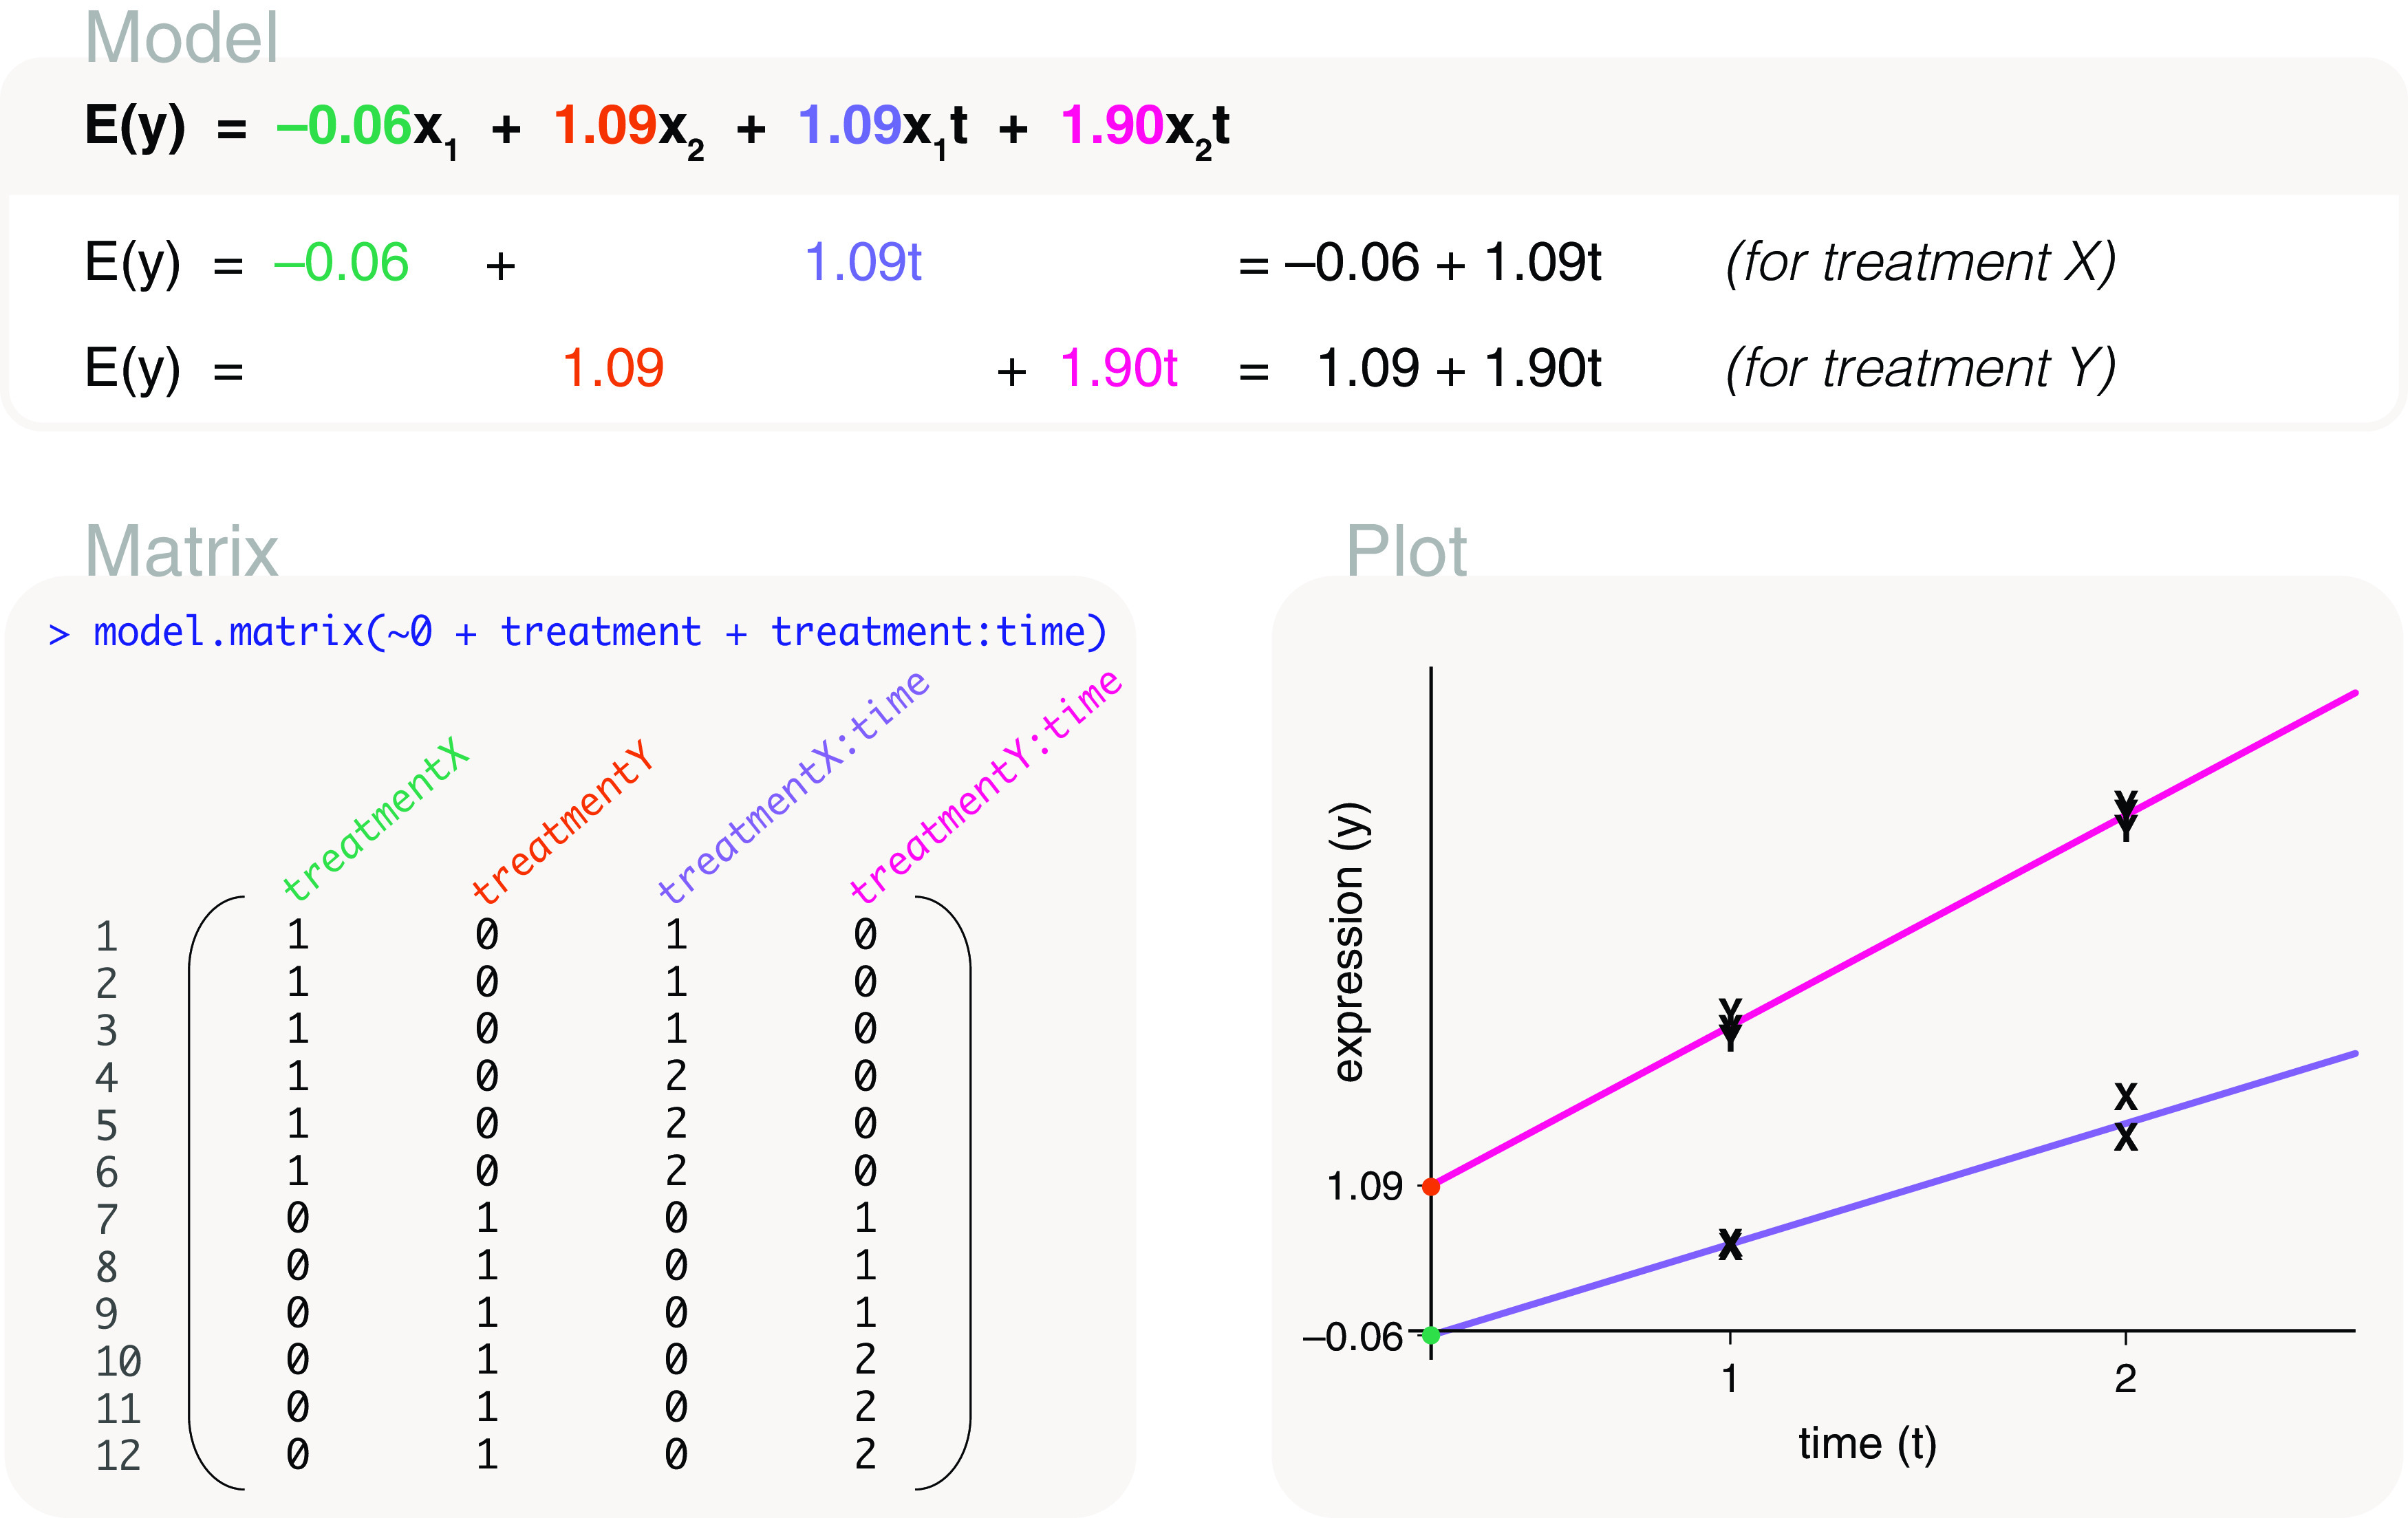
Differential expression analysis of genomic data types, such as RNA-sequencing experiments, use linear models to determine the size and direction of the changes in gene expression. For RNA-sequencing, there are several established software packages for this purpose accompanied with analysis pipelines that are well described. However, there are two crucial steps in the analysis process that can be a stumbling block for many -- the set up an appropriate model via design matrices and the set up of comparisons of interest via contrast matrices. These steps are particularly troublesome because an extensive catalogue for design and contrast matrices does not currently exist. One would usually search for example case studies across different platforms and mix and match the advice from those sources to suit the dataset they have at hand. This article guides the reader through the basics of how to set up design and contrast matrices. We take a practical approach by providing code and graphical representation of each case study, starting with simpler examples (e.g. models with a single explanatory variable) and move onto more complex ones (e.g. interaction models, mixed effects models, higher order time series and cyclical models). Although our work has been written specifically with a -style pipeline in mind, most of it is also applicable to other software packages for differential expression analysis, and the ideas covered can be adapted to data analysis of other high-throughput technologies. Where appropriate, we explain the interpretation and differences between models to aid readers in their own model choices. Unnecessary jargon and theory is omitted where possible so that our work is accessible to a wide audience of readers, from beginners to those with experience in genomics data analysis.
基因数据类型(如 RNA 测序实验)的差异表达分析使用线性模型来确定基因表达变化的大小和方向。对于 RNA 测序,有几个为此目的而建立的软件包,同时还有描述良好的分析管道。然而,分析过程中有两个关键步骤可能会让许多人感到困惑——通过设计矩阵设置适当的模型,以及通过对比矩阵设置感兴趣的比较。这些步骤特别麻烦,因为目前没有设计和对比矩阵的广泛目录。人们通常会在不同的平台上搜索示例案例研究,并混合和匹配这些来源的建议,以适应他们手头现有的数据集。本文通过提供每个案例研究的代码和图形表示,引导读者了解如何设置设计和对比矩阵。我们采用实用的方法,从更简单的示例(例如具有单个解释变量的模型)开始,逐步过渡到更复杂的示例(例如交互模型、混合效应模型、高阶时间序列和周期性模型)。尽管我们的工作是专门针对特定的 -style 管道编写的,但其中的大部分内容也适用于其他差异表达分析软件包,并且涵盖的思路可以适用于其他高通量技术的数据分析。在适当的情况下,我们解释了模型之间的解释和差异,以帮助读者在自己的模型选择中做出决策。在可能的情况下,我们省略了不必要的行话和理论,以便我们的工作能够被广泛的读者群体所理解,包括初学者和有基因组数据分析经验的人。