Zhou Yuansheng, Sharpee Tatyana O
Computational Neurobiology Laboratory, Salk Institute for Biological Studies, La Jolla, CA 92037, USA.
Division of Biological Sciences, University of California San Diego, La Jolla, CA 92093, USA.
iScience. 2021 Feb 24;24(3):102225. doi: 10.1016/j.isci.2021.102225. eCollection 2021 Mar 19.
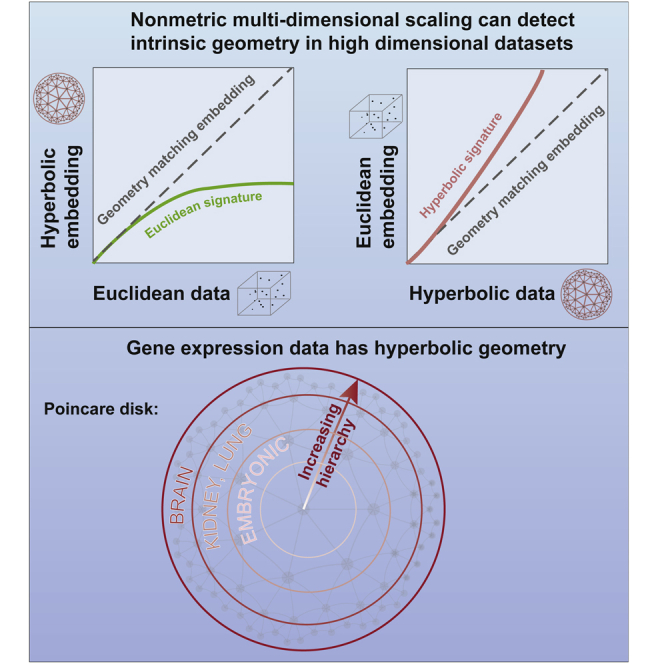
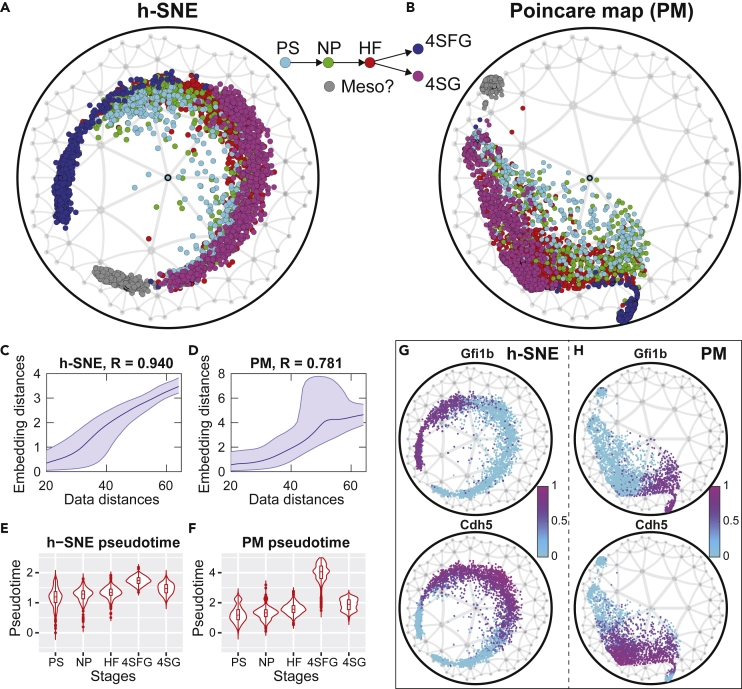
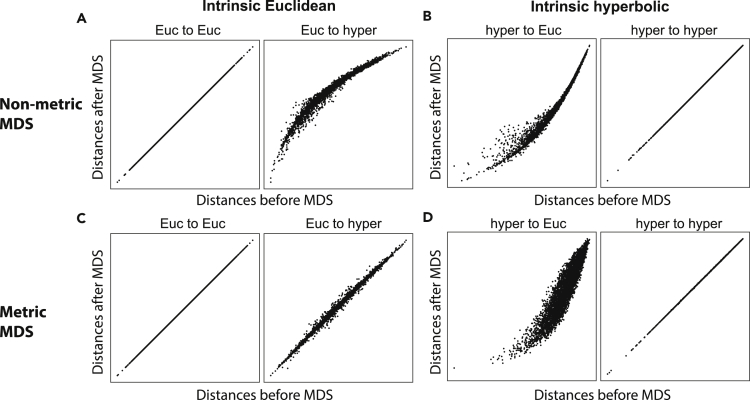
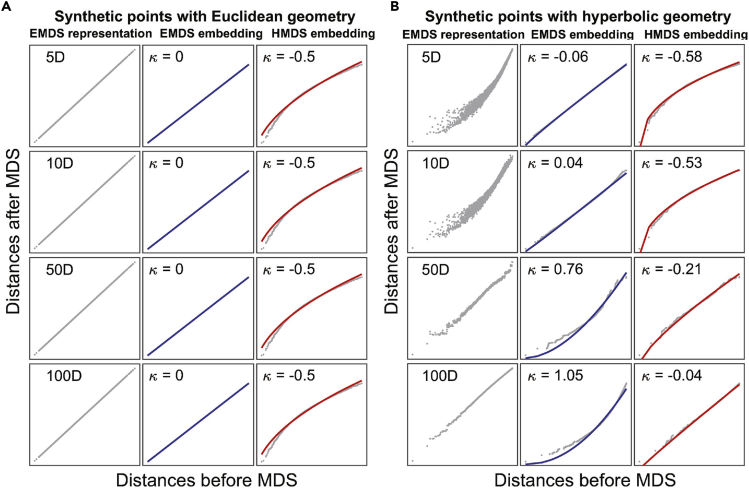
Patterns of gene expressions play a key role in determining cell state. Although correlations in gene expressions have been well documented, most of the current methods treat them as independent variables. One way to take into account gene correlations is to find a low-dimensional curved geometry that describes variation in the data. Here we develop such a method and find that gene expression across multiple cell types exhibits a low-dimensional hyperbolic structure. When more genes are taken into account, hyperbolic effects become stronger but representation remains low dimensional. The size of the hyperbolic map, which indicates the hierarchical depth of the data, was the largest for human cells, the smallest for mouse embryonic cells, and intermediate in differentiated cells from different mouse organs. We also describe how hyperbolic metric can be incorporated into the t-SNE method to improve visualizations compared with leading methods.
基因表达模式在决定细胞状态方面起着关键作用。尽管基因表达中的相关性已有充分记录,但目前大多数方法将它们视为独立变量。考虑基因相关性的一种方法是找到一种低维弯曲几何结构来描述数据中的变化。在这里,我们开发了这样一种方法,并发现跨多种细胞类型的基因表达呈现出低维双曲结构。当考虑更多基因时,双曲效应变得更强,但表示仍保持低维。双曲图的大小表明了数据的层次深度,对于人类细胞来说最大,对于小鼠胚胎细胞来说最小,而在来自不同小鼠器官的分化细胞中处于中间。我们还描述了与领先方法相比,如何将双曲度量纳入t-SNE方法以改善可视化效果。