• 文献检索
  • 文档翻译
  • 深度研究
  • 学术资讯
  • Suppr Zotero 插件Zotero 插件
  • 邀请有礼
  • 套餐&价格
  • 历史记录
应用&插件
Suppr Zotero 插件Zotero 插件浏览器插件Mac 客户端Windows 客户端微信小程序
定价
高级版会员购买积分包购买API积分包
服务
文献检索文档翻译深度研究API 文档MCP 服务
关于我们
关于 Suppr公司介绍联系我们用户协议隐私条款
关注我们

Suppr 超能文献

核心技术专利:CN118964589B侵权必究
粤ICP备2023148730 号-1Suppr @ 2026

文献检索

告别复杂PubMed语法,用中文像聊天一样搜索,搜遍4000万医学文献。AI智能推荐,让科研检索更轻松。

立即免费搜索

文件翻译

保留排版,准确专业,支持PDF/Word/PPT等文件格式,支持 12+语言互译。

免费翻译文档

深度研究

AI帮你快速写综述,25分钟生成高质量综述,智能提取关键信息,辅助科研写作。

立即免费体验

CellMixS:量化和可视化单细胞 RNA-seq 数据中的批次效应。

CellMixS: quantifying and visualizing batch effects in single-cell RNA-seq data.

机构信息

Department of Molecular Life Sciences, University of Zurich, Zurich, Switzerland.

SIB Swiss Institute of Bioinformatics, University of Zurich, Zurich, Switzerland.

出版信息

Life Sci Alliance. 2021 Mar 23;4(6). doi: 10.26508/lsa.202001004. Print 2021 Jun.

DOI:10.26508/lsa.202001004
PMID:33758076
原文链接:https://pmc.ncbi.nlm.nih.gov/articles/PMC7994321/
Abstract

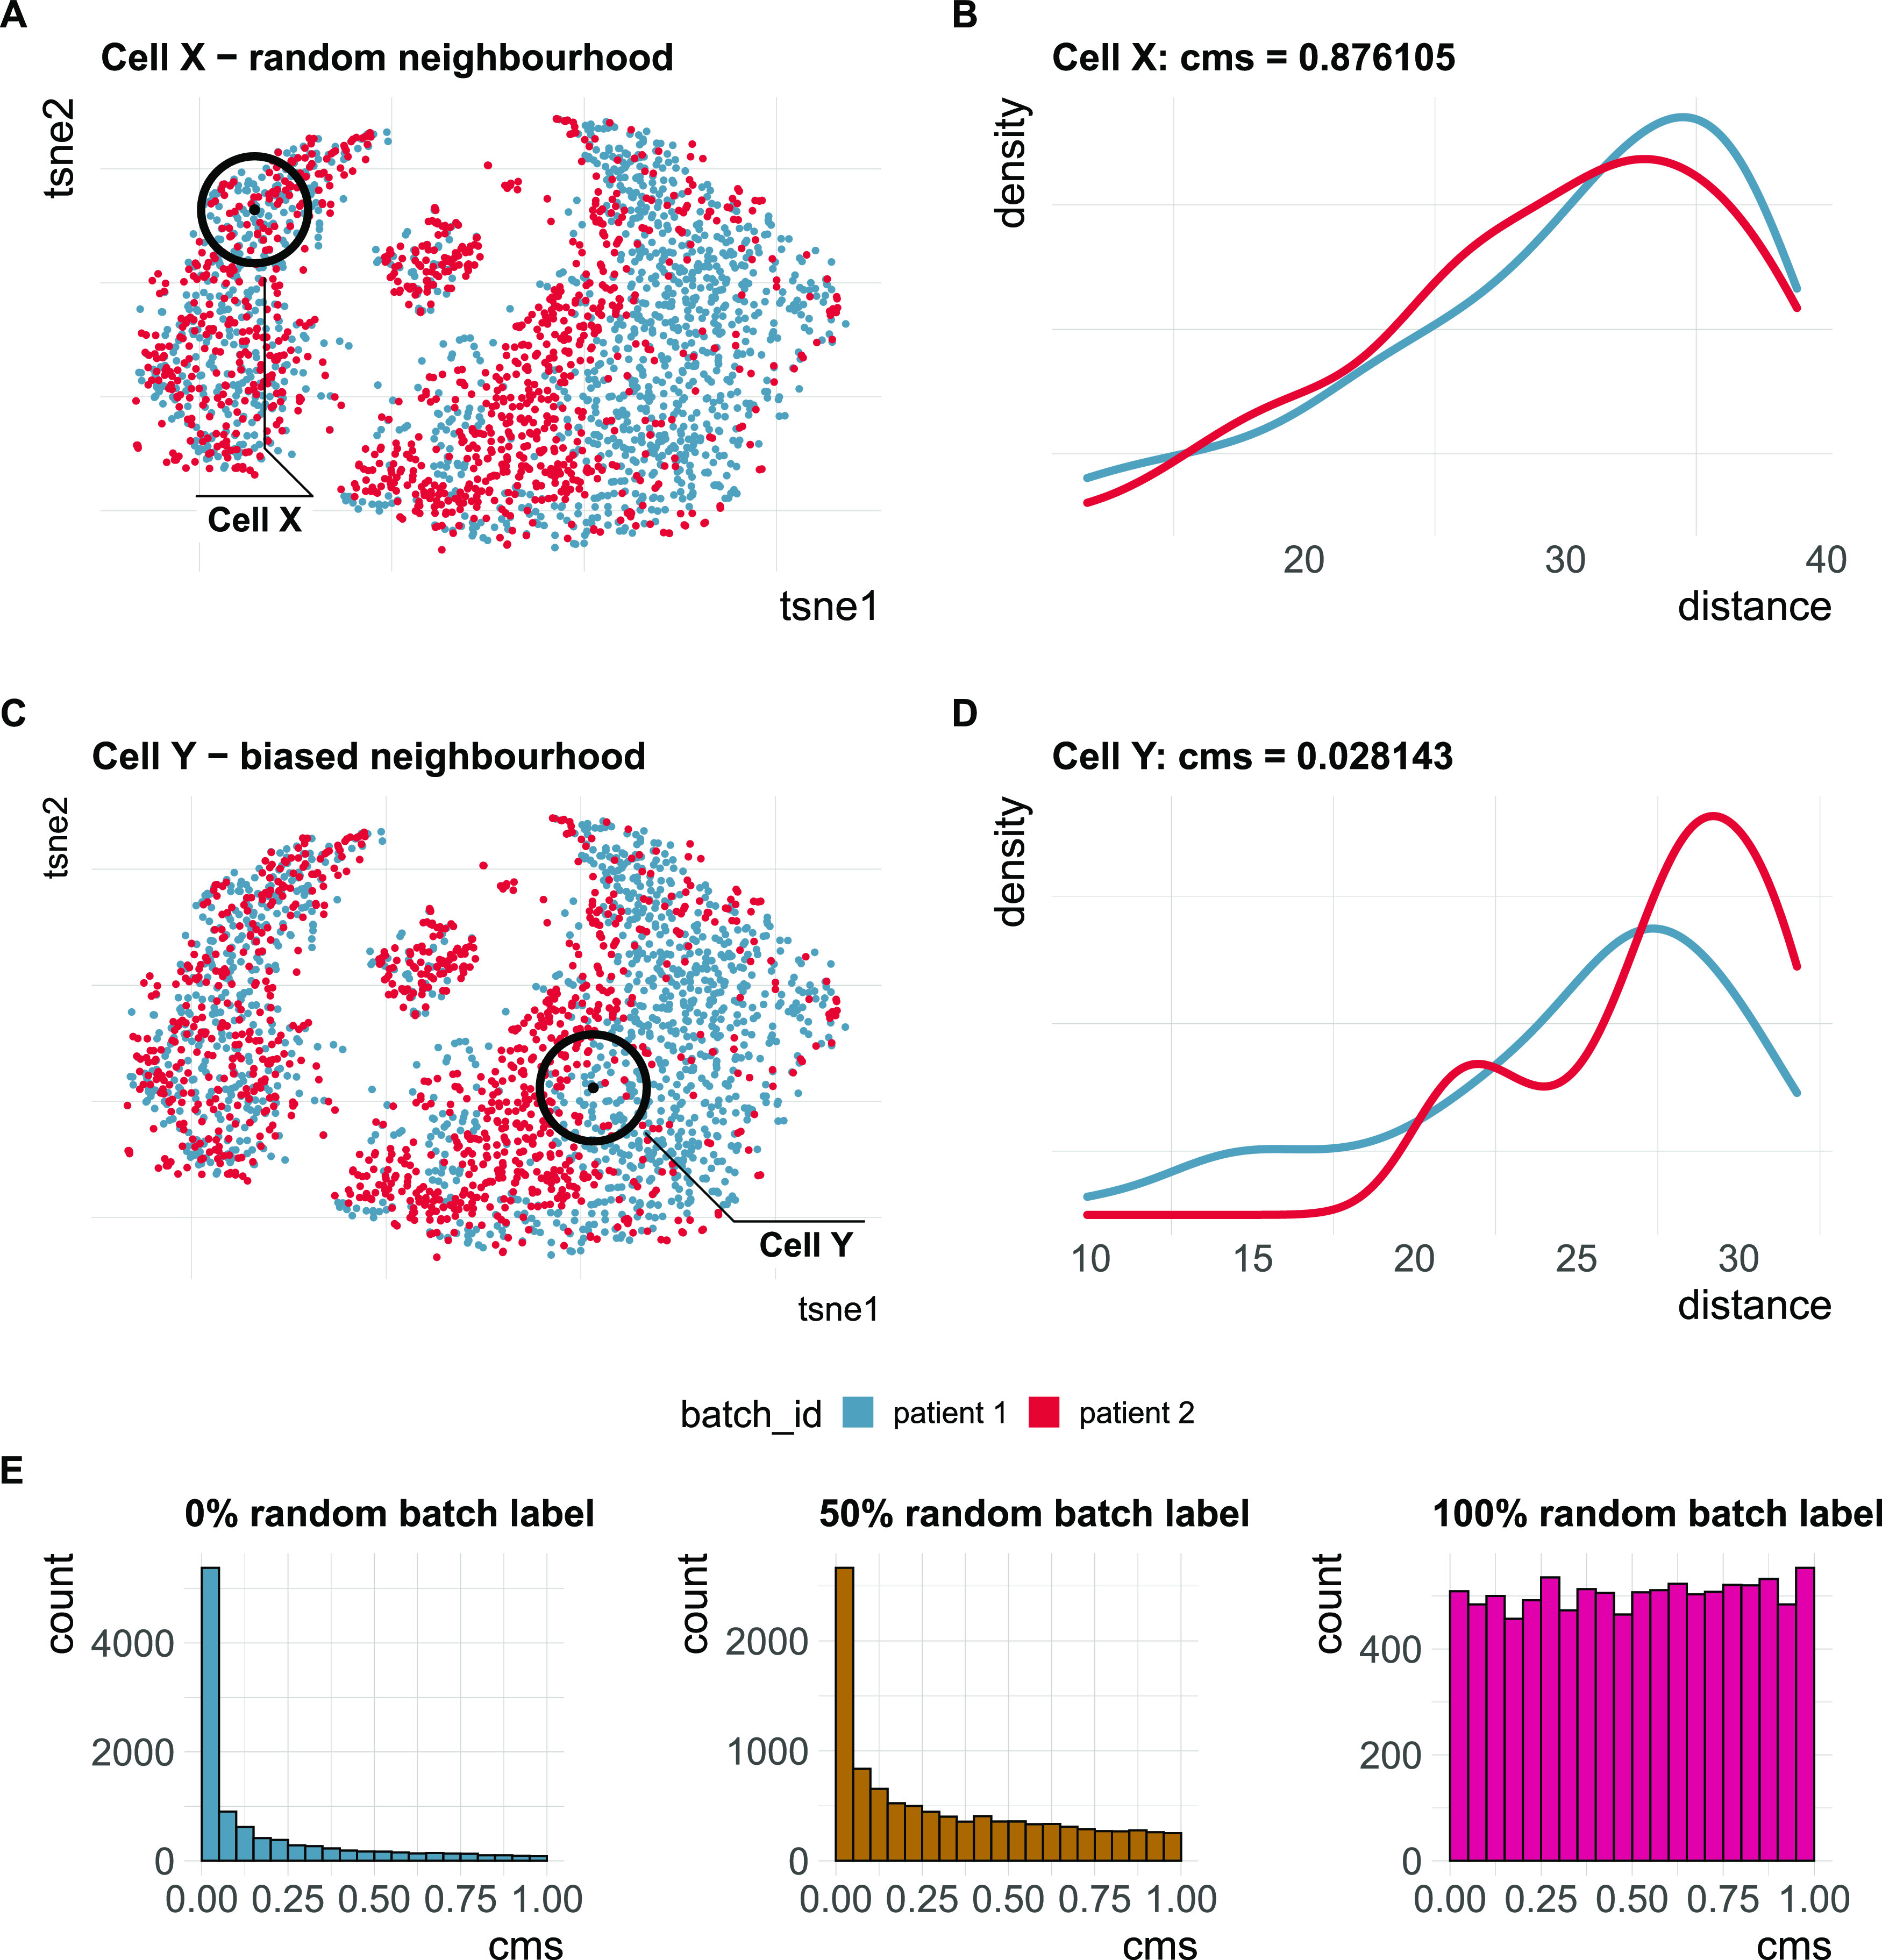
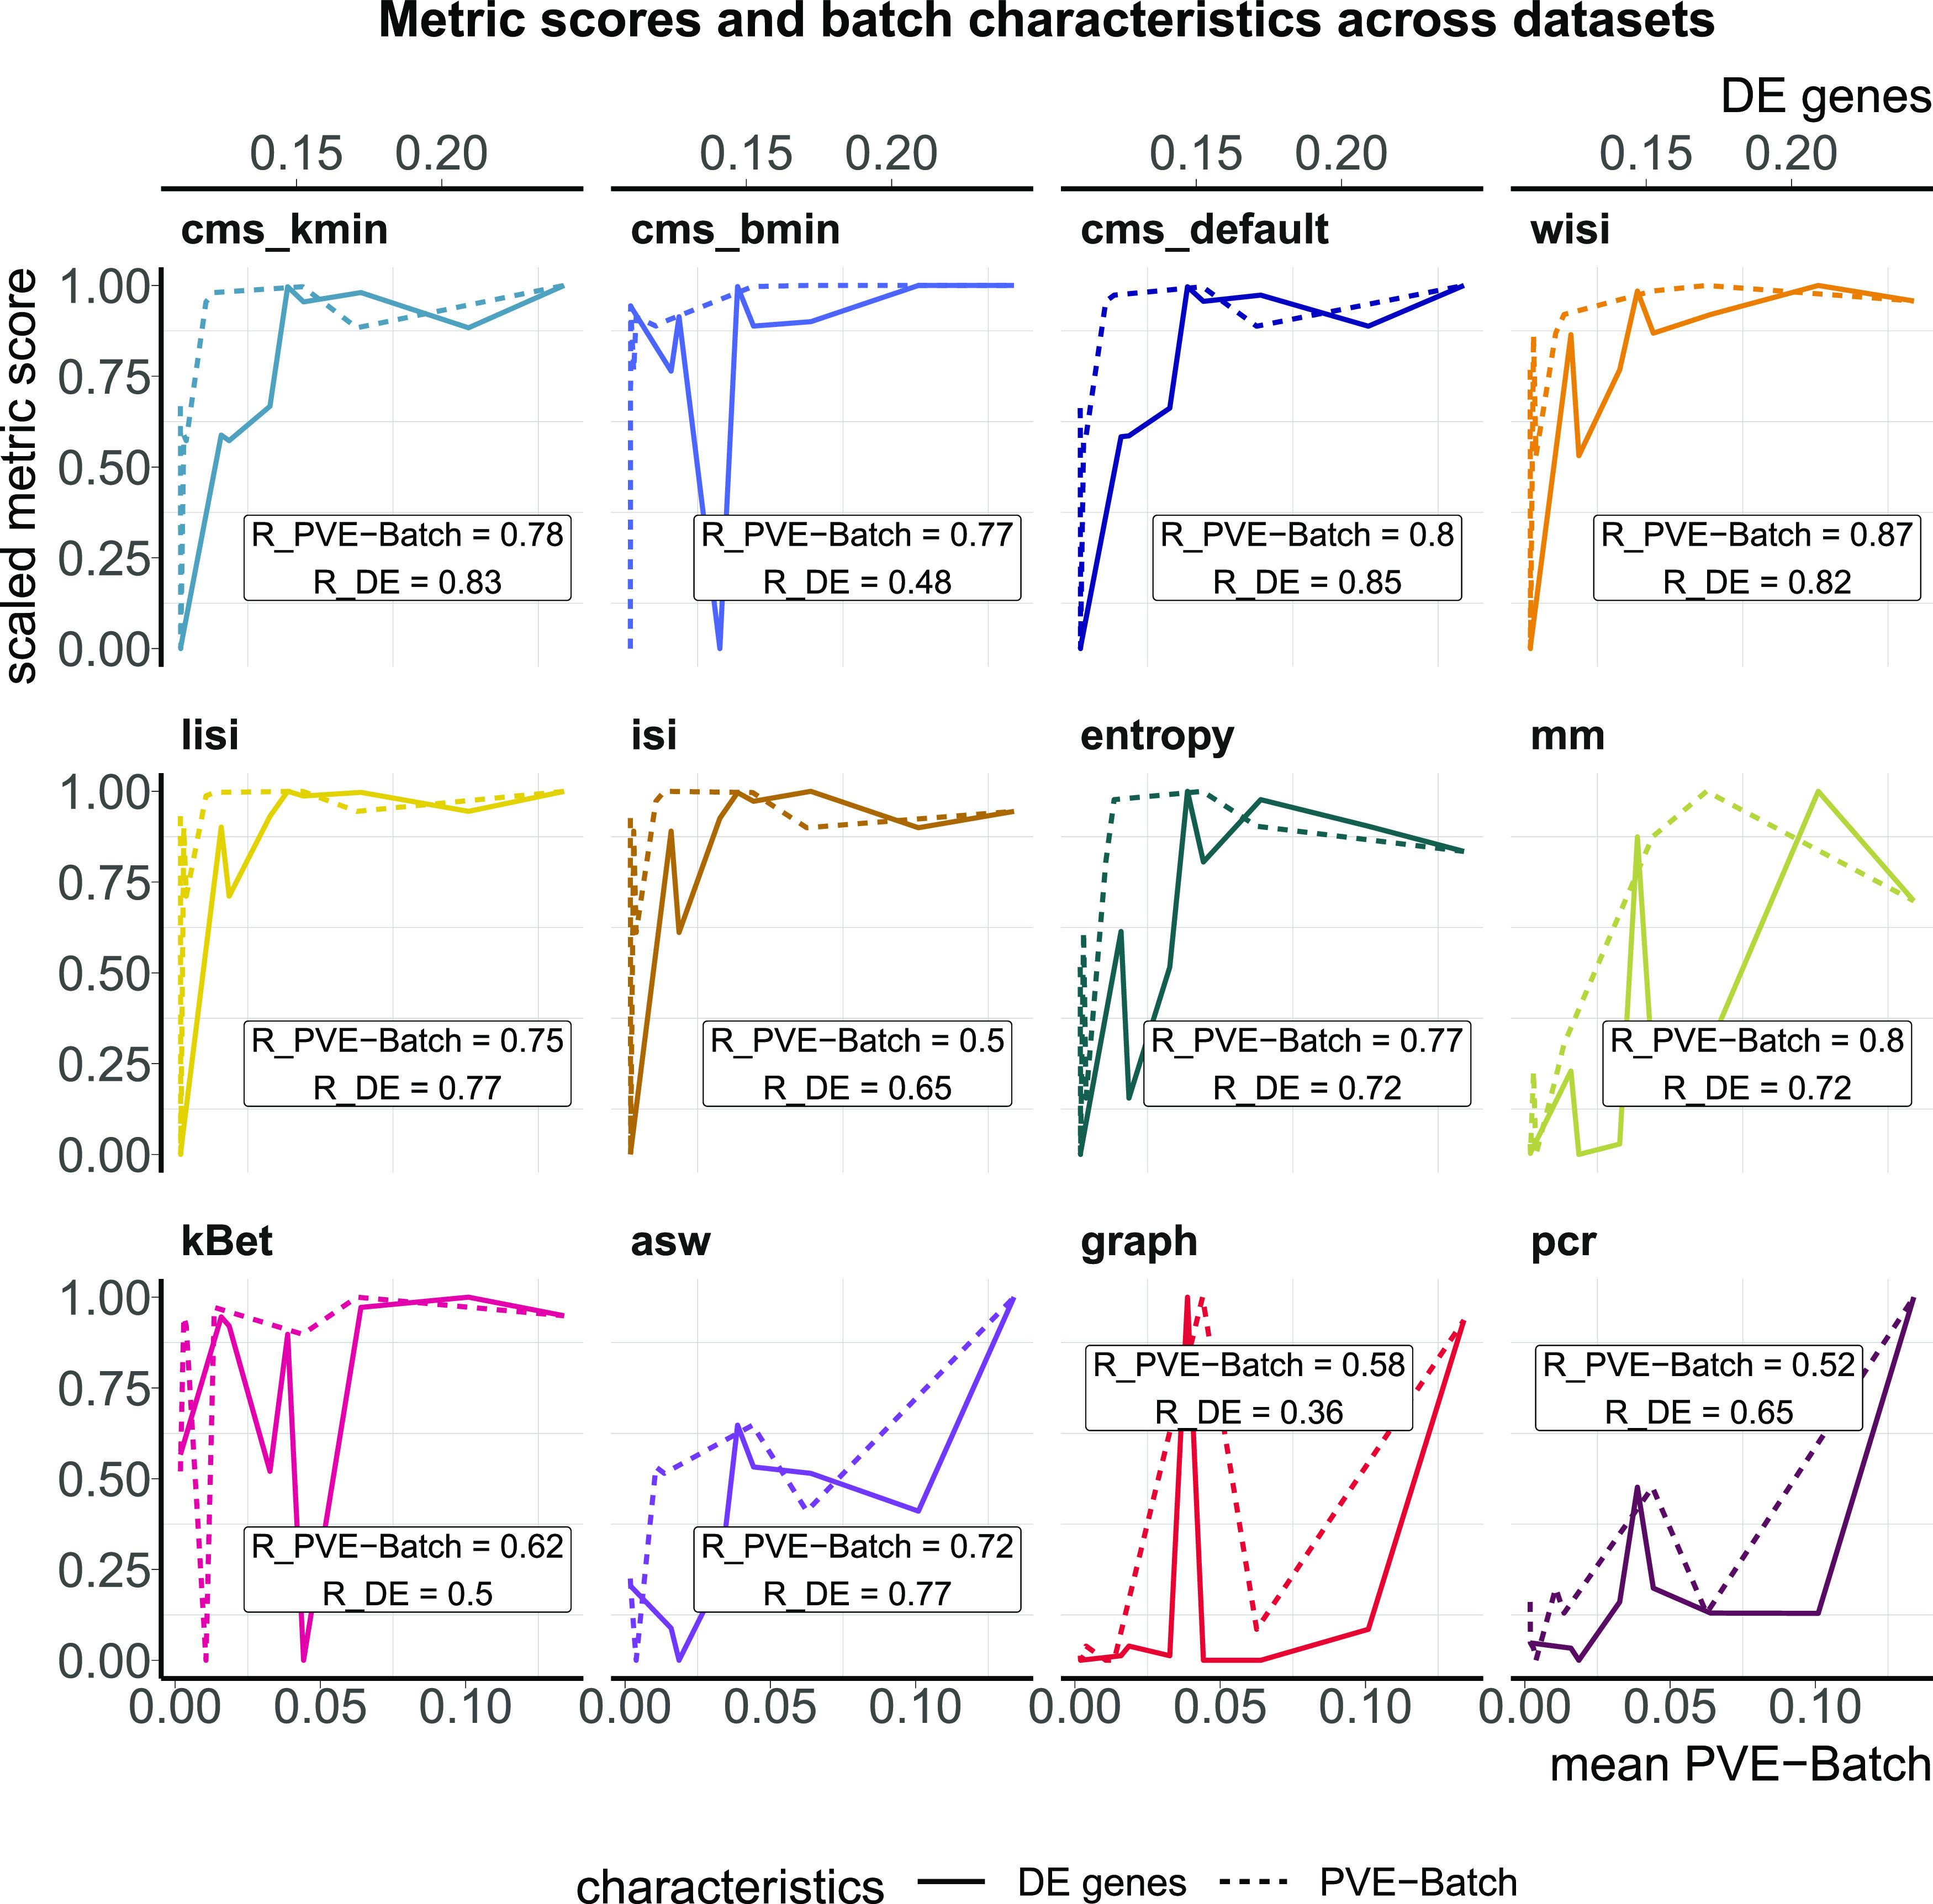
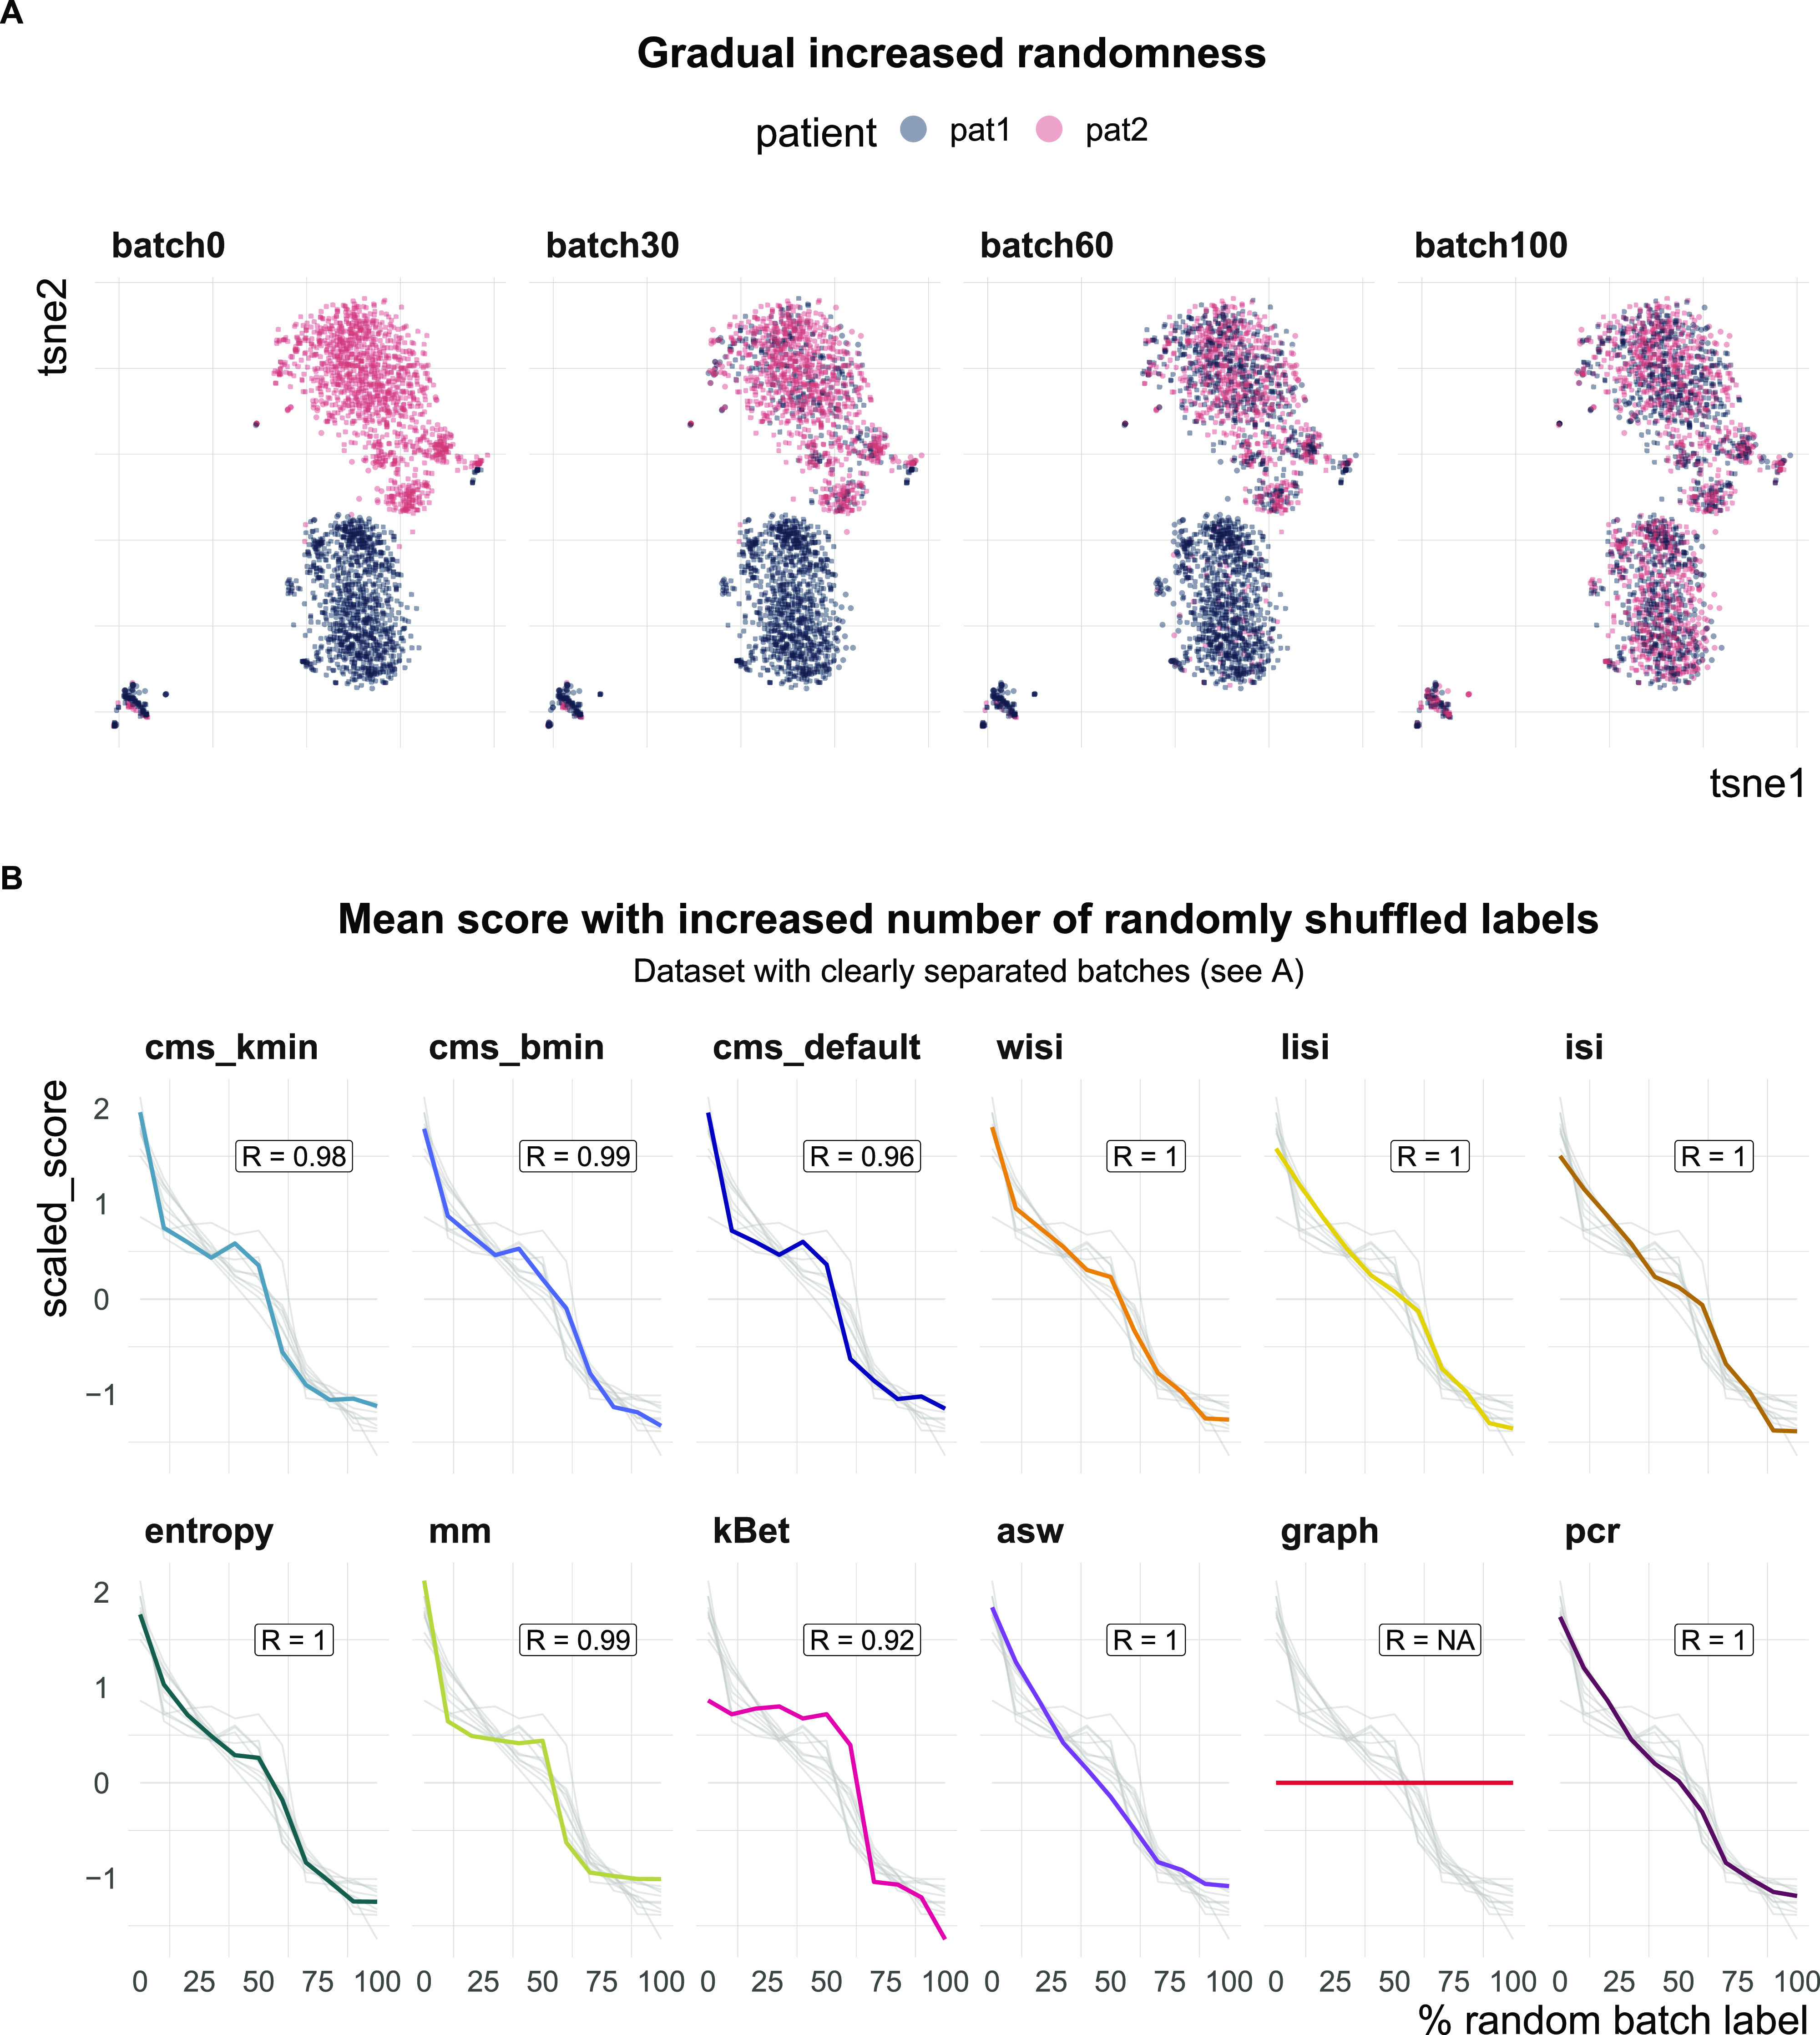
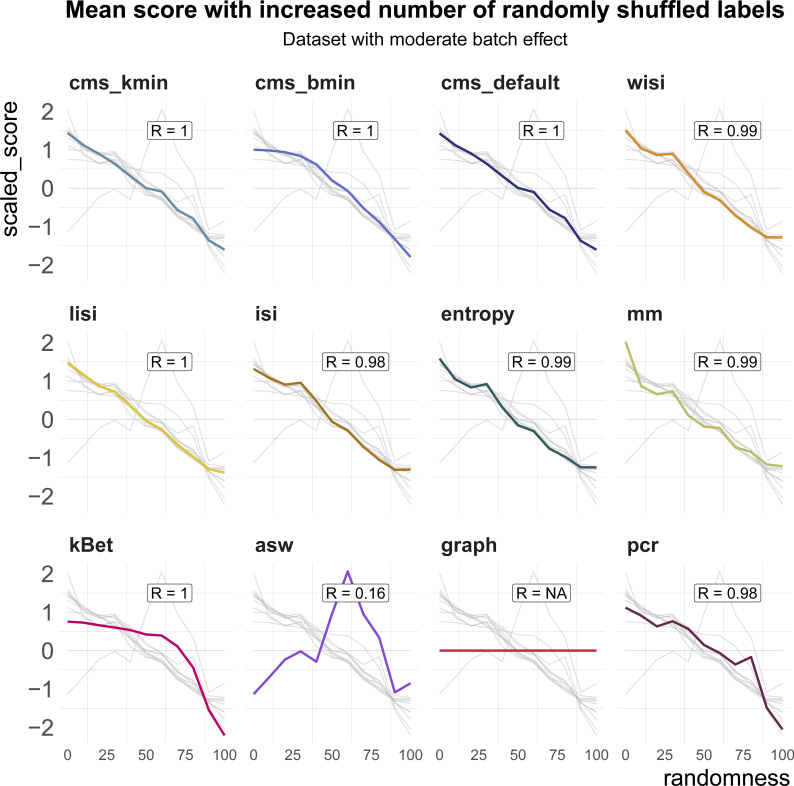
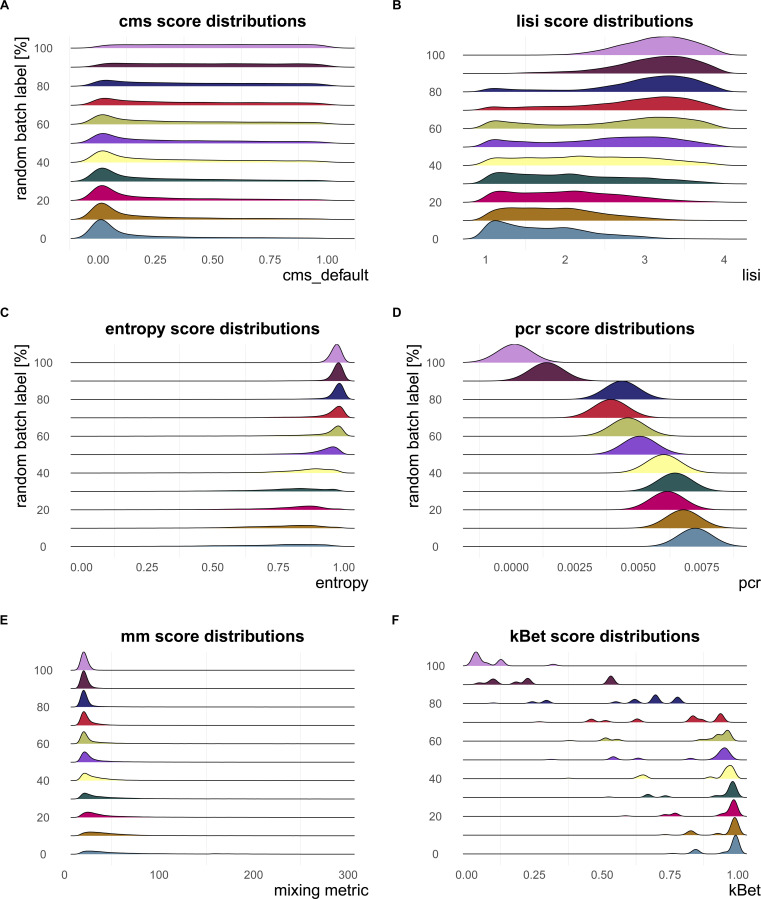
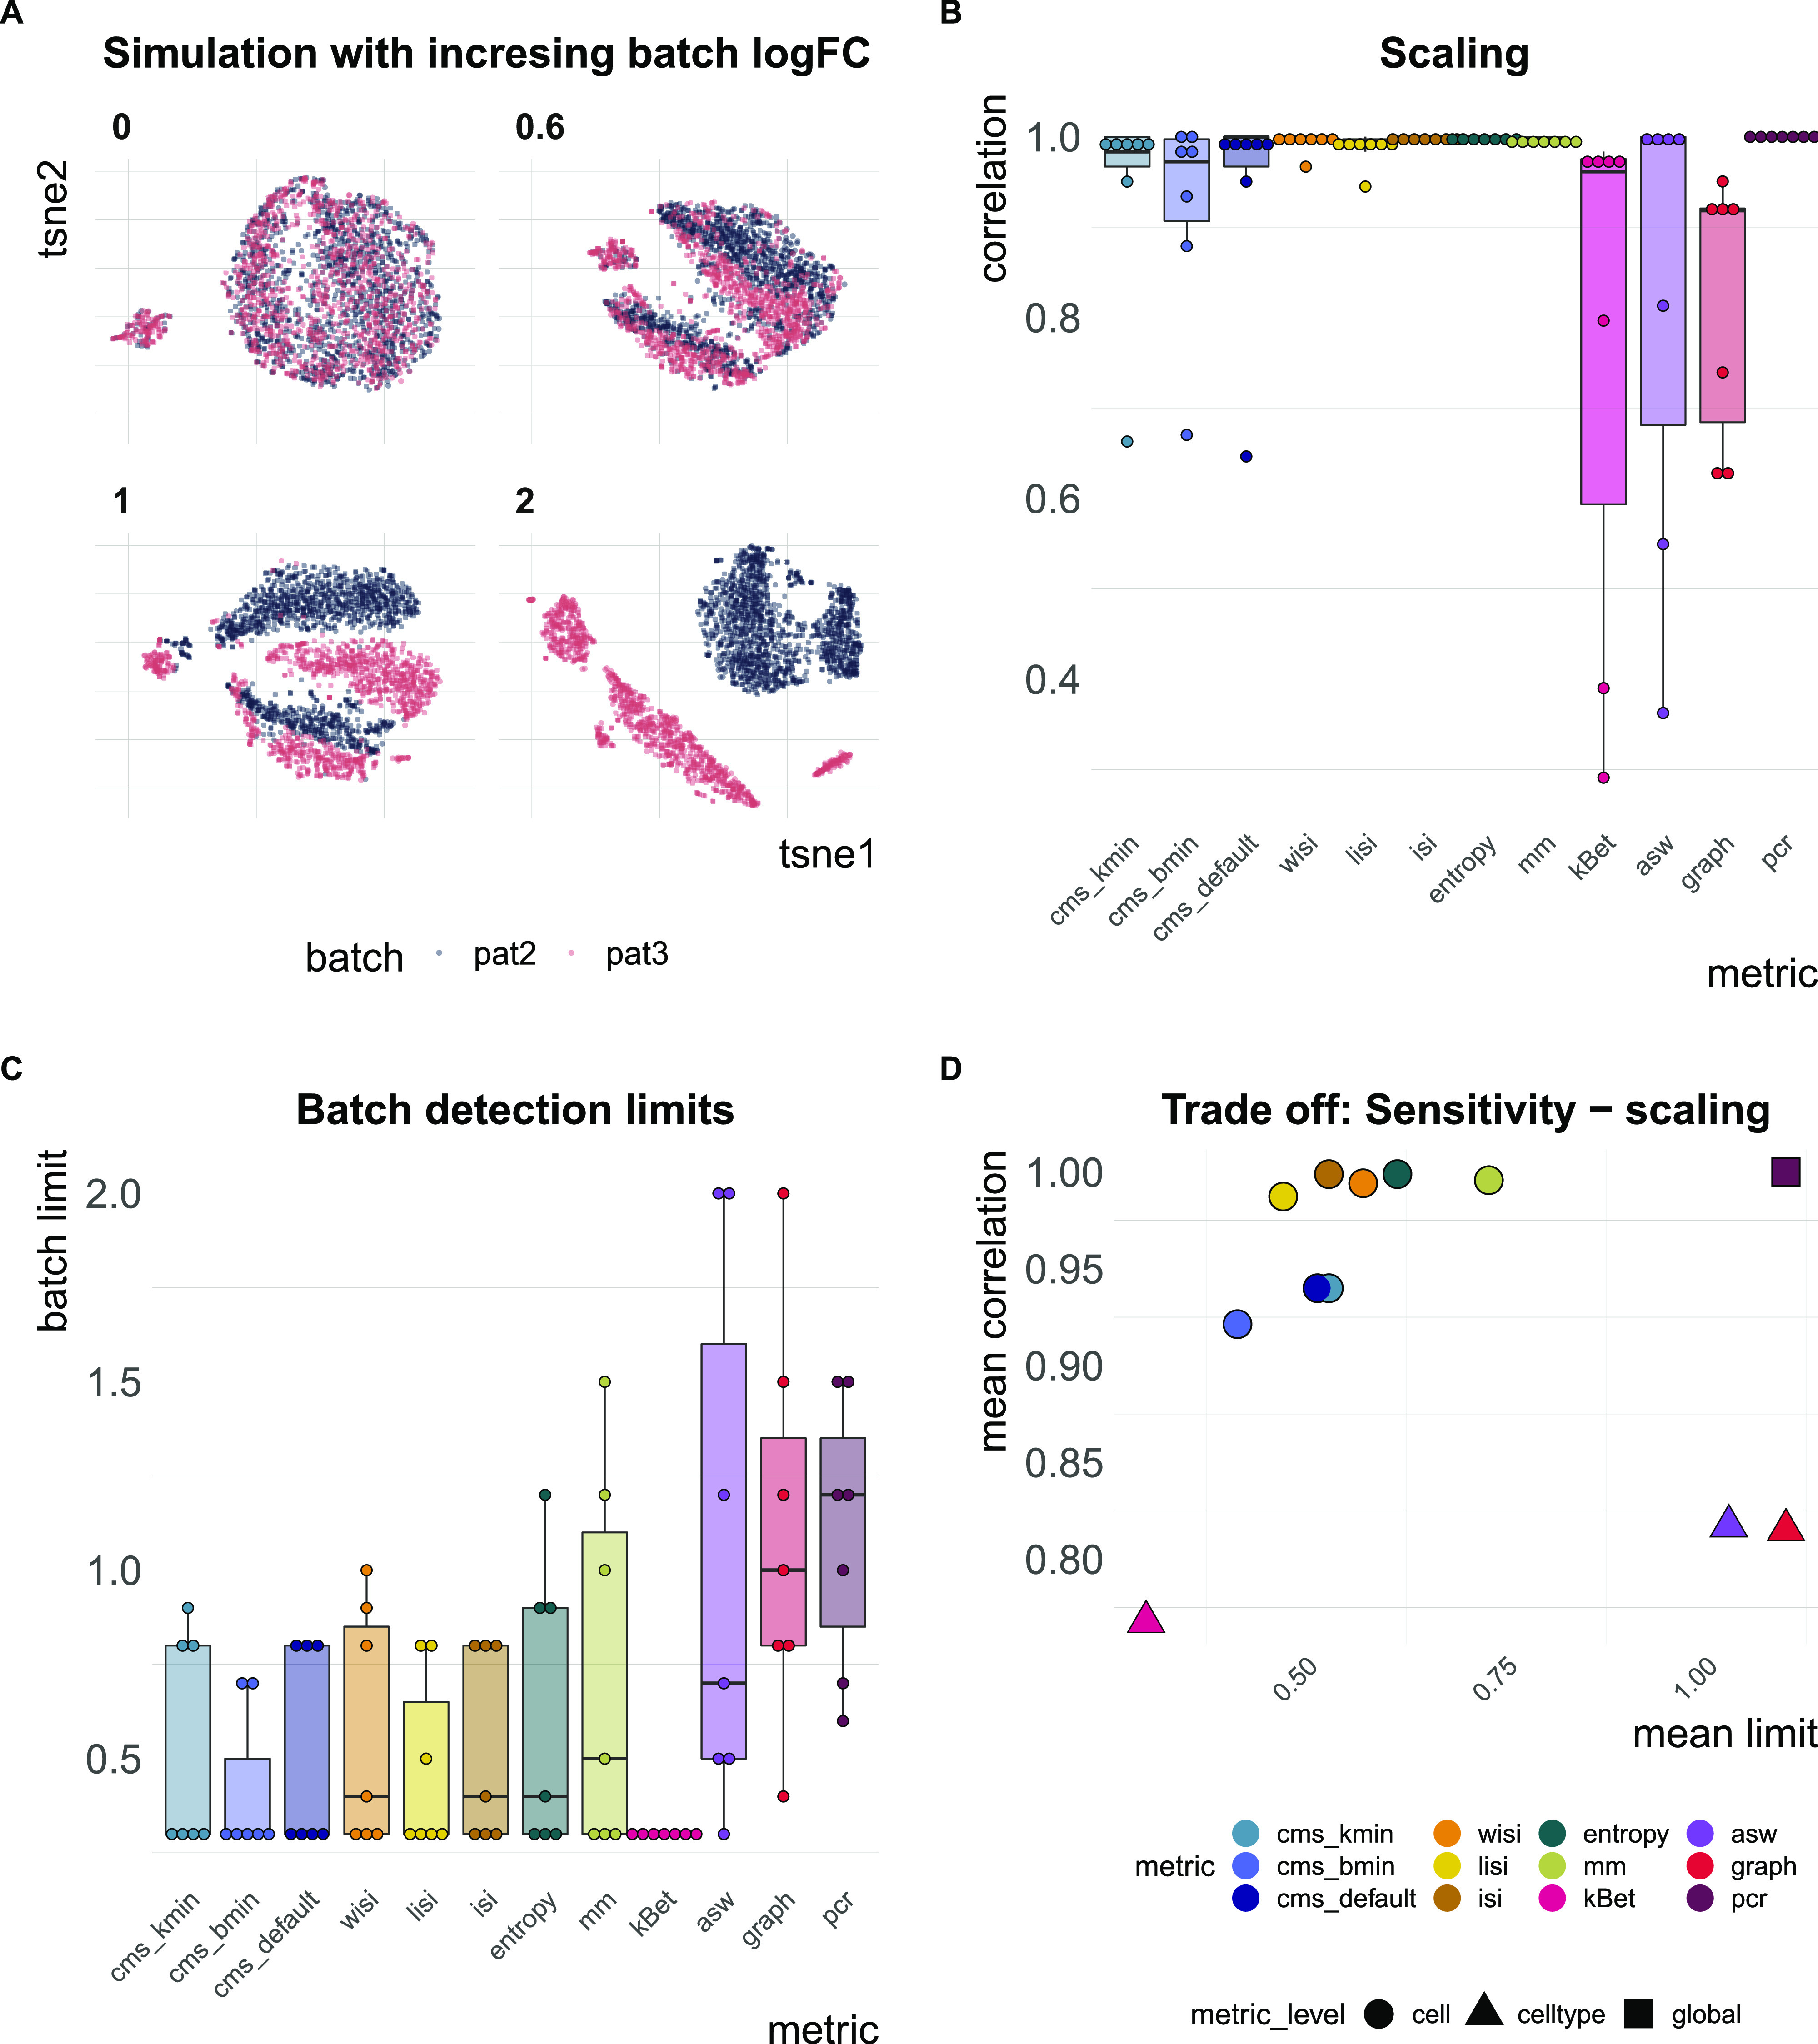
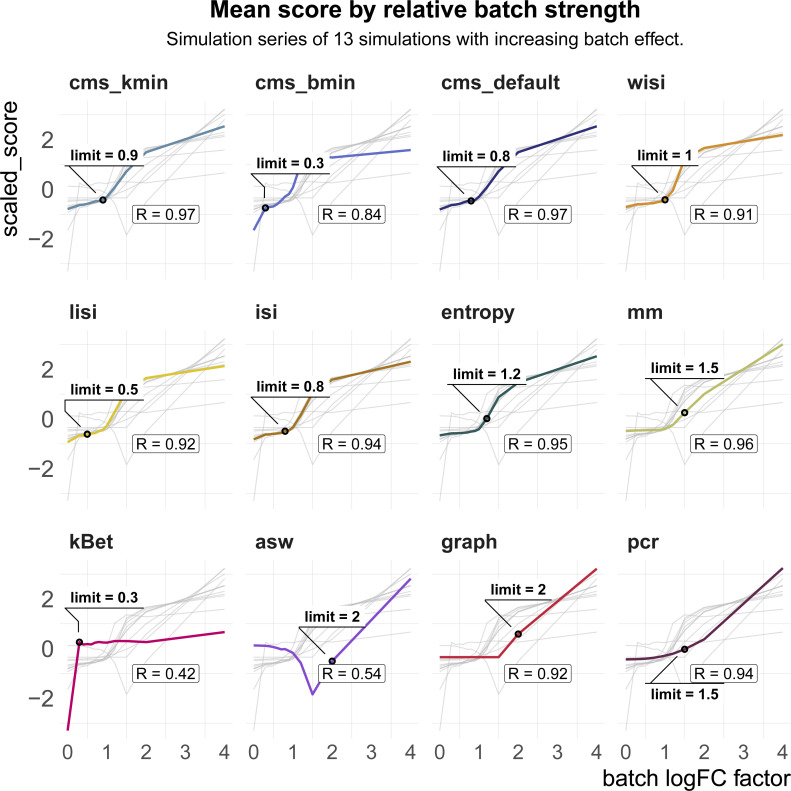
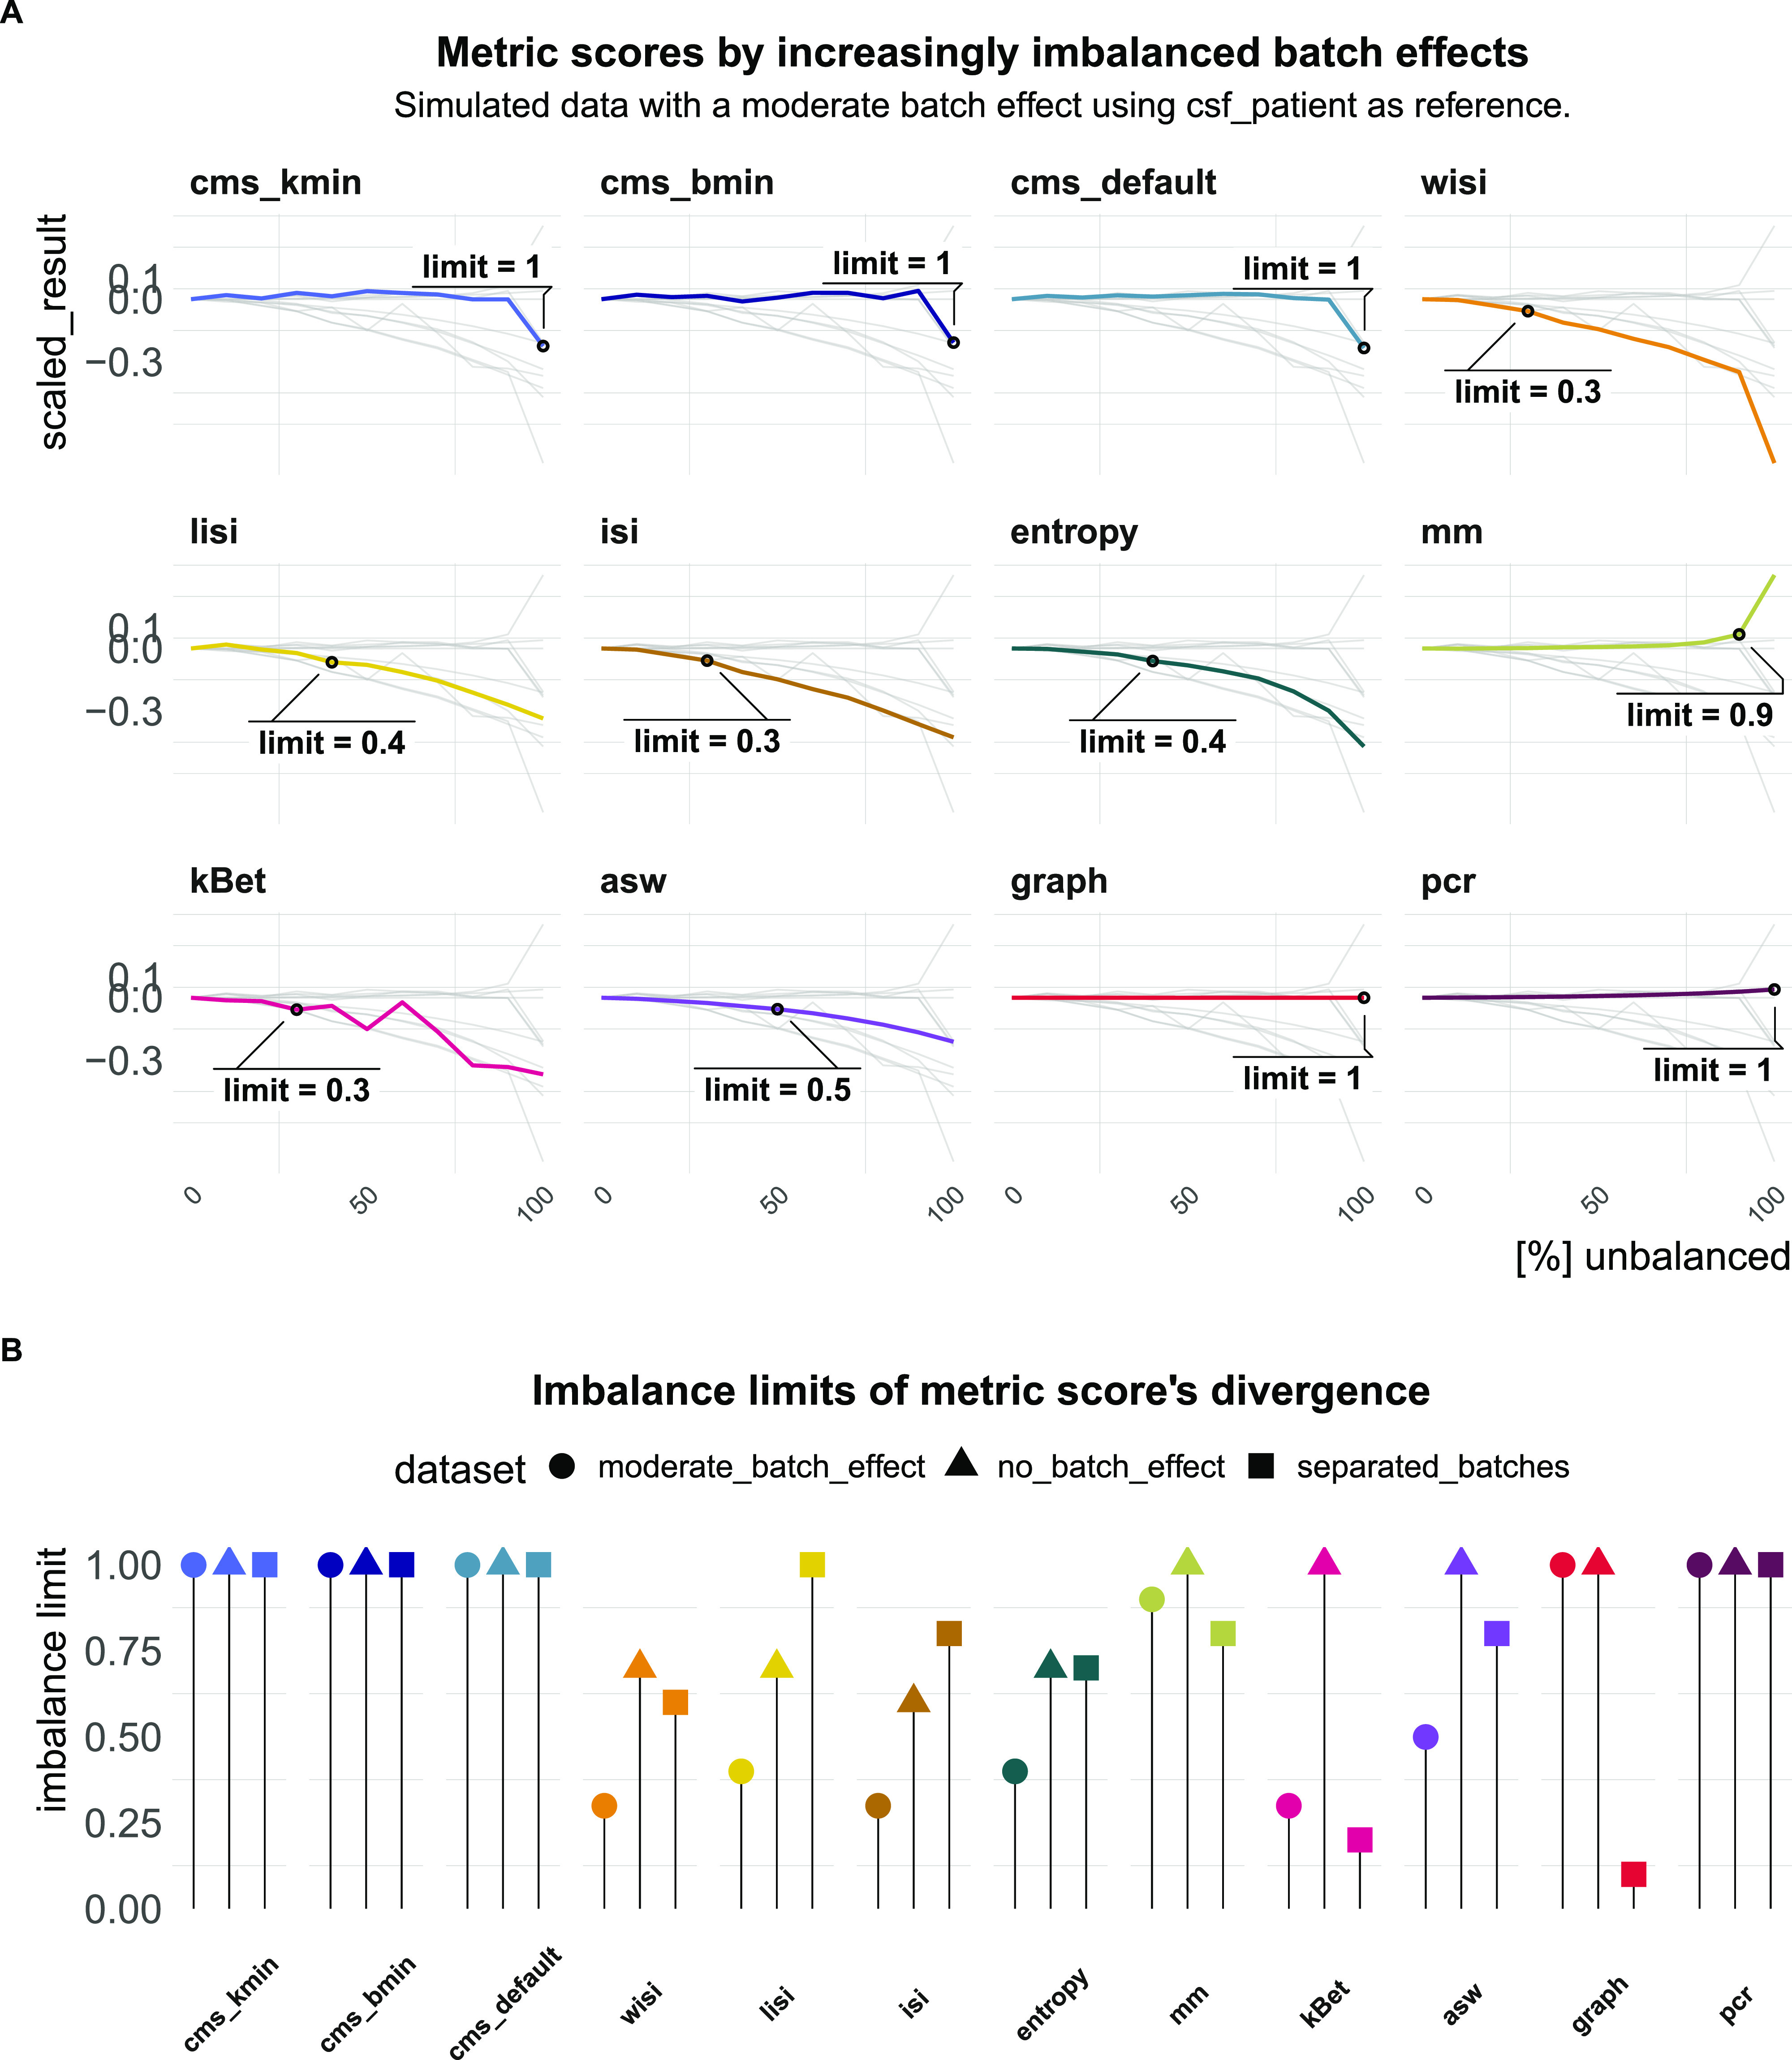
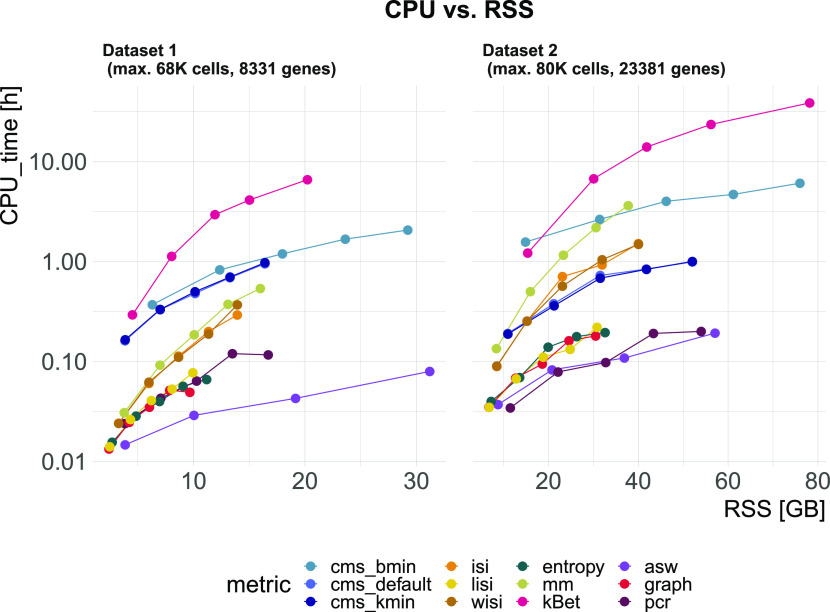
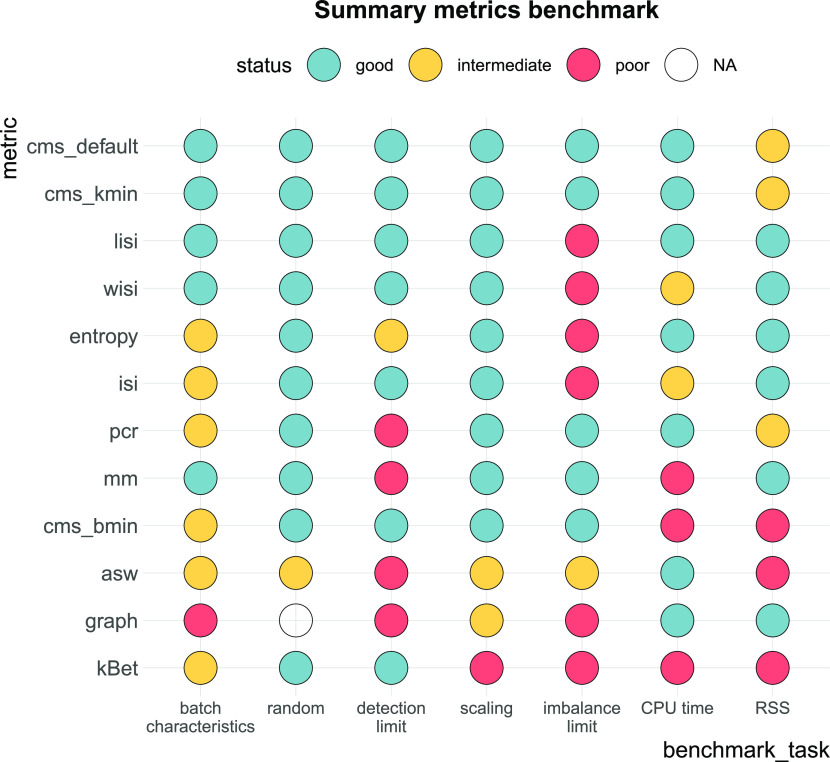
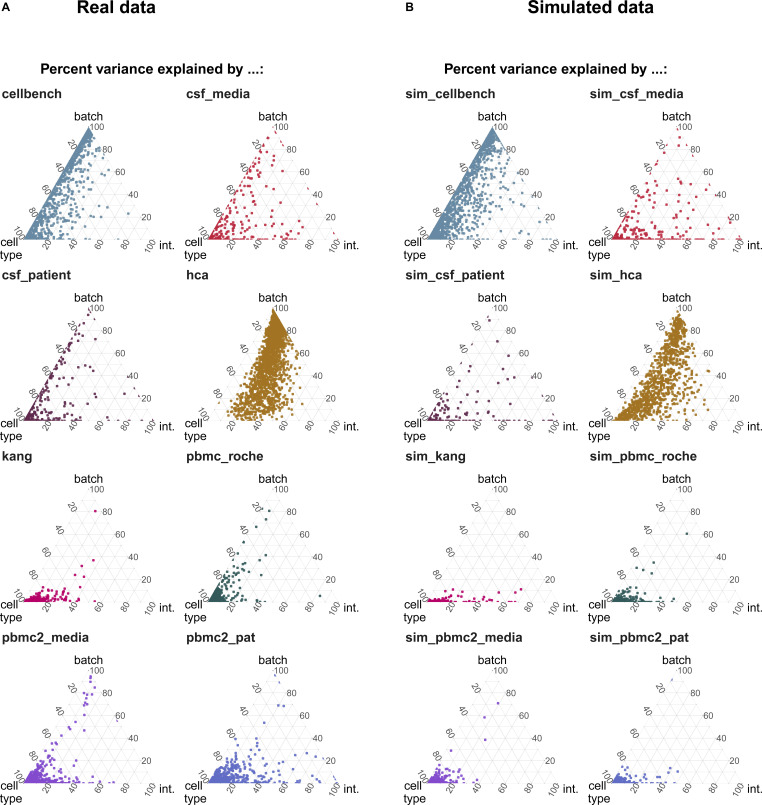
A key challenge in single-cell RNA-sequencing (scRNA-seq) data analysis is batch effects that can obscure the biological signal of interest. Although there are various tools and methods to correct for batch effects, their performance can vary. Therefore, it is important to understand how batch effects manifest to adjust for them. Here, we systematically explore batch effects across various scRNA-seq datasets according to magnitude, cell type specificity, and complexity. We developed a cell-specific mixing score (cms) that quantifies mixing of cells from multiple batches. By considering distance distributions, the score is able to detect local batch bias as well as differentiate between unbalanced batches and systematic differences between cells of the same cell type. We compare metrics in scRNA-seq data using real and synthetic datasets and whereas these metrics target the same question and are used interchangeably, we find differences in scalability, sensitivity, and ability to handle differentially abundant cell types. We find that cell-specific metrics outperform cell type-specific and global metrics and recommend them for both method benchmarks and batch exploration.

摘要

单细胞 RNA 测序 (scRNA-seq) 数据分析中的一个关键挑战是批次效应,它可能会掩盖感兴趣的生物学信号。尽管有各种工具和方法可以纠正批次效应,但它们的性能可能会有所不同。因此,了解批次效应的表现方式以进行调整非常重要。在这里,我们根据幅度、细胞类型特异性和复杂性,系统地探索了各种 scRNA-seq 数据集的批次效应。我们开发了一种细胞特异性混合分数 (cms),用于量化来自多个批次的细胞混合情况。通过考虑距离分布,该分数能够检测到局部批次偏差,以及区分不平衡批次和同一细胞类型的细胞之间的系统差异。我们使用真实和合成数据集比较了 scRNA-seq 数据中的指标,尽管这些指标针对的是同一个问题且可以互换使用,但我们发现它们在可扩展性、灵敏度和处理差异丰度细胞类型的能力方面存在差异。我们发现细胞特异性指标优于细胞类型特异性和全局指标,并建议将其用于方法基准测试和批次探索。

https://cdn.ncbi.nlm.nih.gov/pmc/blobs/e57b/7994321/8fb4e7a6b44b/LSA-2020-01004_FigS7.jpg
https://cdn.ncbi.nlm.nih.gov/pmc/blobs/e57b/7994321/44496930ea91/LSA-2020-01004_FigS1.jpg
https://cdn.ncbi.nlm.nih.gov/pmc/blobs/e57b/7994321/71933ff0f24f/LSA-2020-01004_Fig1.jpg
https://cdn.ncbi.nlm.nih.gov/pmc/blobs/e57b/7994321/cb5d3b1fa6b3/LSA-2020-01004_FigS2.jpg
https://cdn.ncbi.nlm.nih.gov/pmc/blobs/e57b/7994321/dc2a249c48e1/LSA-2020-01004_Fig2.jpg
https://cdn.ncbi.nlm.nih.gov/pmc/blobs/e57b/7994321/cfe032b909e0/LSA-2020-01004_Fig3.jpg
https://cdn.ncbi.nlm.nih.gov/pmc/blobs/e57b/7994321/c1a9337eb7eb/LSA-2020-01004_Fig4.jpg
https://cdn.ncbi.nlm.nih.gov/pmc/blobs/e57b/7994321/0be1673efe24/LSA-2020-01004_FigS3.jpg
https://cdn.ncbi.nlm.nih.gov/pmc/blobs/e57b/7994321/0729cc203439/LSA-2020-01004_FigS4.jpg
https://cdn.ncbi.nlm.nih.gov/pmc/blobs/e57b/7994321/60ba044d0d8b/LSA-2020-01004_Fig5.jpg
https://cdn.ncbi.nlm.nih.gov/pmc/blobs/e57b/7994321/88b226e994fb/LSA-2020-01004_FigS5.jpg
https://cdn.ncbi.nlm.nih.gov/pmc/blobs/e57b/7994321/a0031b7684c6/LSA-2020-01004_Fig6.jpg
https://cdn.ncbi.nlm.nih.gov/pmc/blobs/e57b/7994321/dc5c415c1222/LSA-2020-01004_Fig7.jpg
https://cdn.ncbi.nlm.nih.gov/pmc/blobs/e57b/7994321/8627a423b23e/LSA-2020-01004_Fig8.jpg
https://cdn.ncbi.nlm.nih.gov/pmc/blobs/e57b/7994321/cfd9ede30356/LSA-2020-01004_FigS6.jpg
https://cdn.ncbi.nlm.nih.gov/pmc/blobs/e57b/7994321/8fb4e7a6b44b/LSA-2020-01004_FigS7.jpg

相似文献

1
CellMixS: quantifying and visualizing batch effects in single-cell RNA-seq data.CellMixS:量化和可视化单细胞 RNA-seq 数据中的批次效应。
Life Sci Alliance. 2021 Mar 23;4(6). doi: 10.26508/lsa.202001004. Print 2021 Jun.
2
Latent cellular analysis robustly reveals subtle diversity in large-scale single-cell RNA-seq data.潜伏细胞分析能稳健地揭示大规模单细胞 RNA-seq 数据中的细微多样性。
Nucleic Acids Res. 2019 Dec 16;47(22):e143. doi: 10.1093/nar/gkz826.
3
IMGG: Integrating Multiple Single-Cell Datasets through Connected Graphs and Generative Adversarial Networks.IMGG:通过连接图和生成对抗网络整合多个单细胞数据集。
Int J Mol Sci. 2022 Feb 14;23(4):2082. doi: 10.3390/ijms23042082.
4
A Comprehensive Survey of Statistical Approaches for Differential Expression Analysis in Single-Cell RNA Sequencing Studies.单细胞 RNA 测序研究中差异表达分析的统计方法综合综述。
Genes (Basel). 2021 Dec 2;12(12):1947. doi: 10.3390/genes12121947.
5
PieParty: visualizing cells from scRNA-seq data as pie charts.PieParty:将单细胞 RNA 测序数据可视化成饼图。
Life Sci Alliance. 2021 Mar 5;4(5). doi: 10.26508/lsa.202000986. Print 2021 May.
6
iSMNN: batch effect correction for single-cell RNA-seq data via iterative supervised mutual nearest neighbor refinement.iSMNN:通过迭代监督的互近邻修正对单细胞 RNA-seq 数据进行批次效应校正。
Brief Bioinform. 2021 Sep 2;22(5). doi: 10.1093/bib/bbab122.
7
BERMUDA: a novel deep transfer learning method for single-cell RNA sequencing batch correction reveals hidden high-resolution cellular subtypes.百慕大:一种新型的单细胞 RNA 测序批次校正深度迁移学习方法揭示了隐藏的高分辨率细胞亚型。
Genome Biol. 2019 Aug 12;20(1):165. doi: 10.1186/s13059-019-1764-6.
8
NDMNN: A novel deep residual network based MNN method to remove batch effects from scRNA-seq data.NDMNN:一种基于深度残差网络的新型MNN方法,用于去除单细胞RNA测序数据中的批次效应。
J Bioinform Comput Biol. 2024 Jun;22(3):2450015. doi: 10.1142/S021972002450015X. Epub 2024 Jul 20.
9
A novel batch-effect correction method for scRNA-seq data based on Adversarial Information Factorization.基于对抗信息分解的 scRNA-seq 数据新型批量效应校正方法。
PLoS Comput Biol. 2024 Feb 22;20(2):e1011880. doi: 10.1371/journal.pcbi.1011880. eCollection 2024 Feb.
10
Decomposing Cell Identity for Transfer Learning across Cellular Measurements, Platforms, Tissues, and Species.跨细胞测量、平台、组织和物种进行迁移学习的细胞身份分解。
Cell Syst. 2019 May 22;8(5):395-411.e8. doi: 10.1016/j.cels.2019.04.004.

引用本文的文献

1
Simulating paired and longitudinal single-cell RNA sequencing data with rescueSim.使用rescueSim模拟配对和纵向单细胞RNA测序数据。
Bioinformatics. 2025 Aug 2;41(8). doi: 10.1093/bioinformatics/btaf442.
2
Sketching T cell atlases in the single-cell era: challenges and recommendations.单细胞时代绘制T细胞图谱:挑战与建议
Immunol Cell Biol. 2025 Aug;103(7):723-737. doi: 10.1111/imcb.70040. Epub 2025 Jun 29.
3
Feature selection methods affect the performance of scRNA-seq data integration and querying.特征选择方法会影响单细胞RNA测序(scRNA-seq)数据整合与查询的性能。

本文引用的文献

1
Benchmarking atlas-level data integration in single-cell genomics.单细胞基因组学中图谱级数据整合的基准测试。
Nat Methods. 2022 Jan;19(1):41-50. doi: 10.1038/s41592-021-01336-8. Epub 2021 Dec 23.
2
Flexible comparison of batch correction methods for single-cell RNA-seq using BatchBench.使用 BatchBench 灵活比较单细胞 RNA-seq 的批量校正方法。
Nucleic Acids Res. 2021 Apr 19;49(7):e42. doi: 10.1093/nar/gkab004.
3
muscat detects subpopulation-specific state transitions from multi-sample multi-condition single-cell transcriptomics data.
Nat Methods. 2025 Apr;22(4):834-844. doi: 10.1038/s41592-025-02624-3. Epub 2025 Mar 13.
4
Dissecting tumor cell programs through group biology estimation in clinical single-cell transcriptomics.通过临床单细胞转录组学中的群体生物学估计剖析肿瘤细胞程序。
Nat Commun. 2025 Mar 1;16(1):2090. doi: 10.1038/s41467-025-57377-6.
5
Considerations for building and using integrated single-cell atlases.构建和使用整合单细胞图谱的注意事项。
Nat Methods. 2025 Jan;22(1):41-57. doi: 10.1038/s41592-024-02532-y. Epub 2024 Dec 13.
6
Leveraging Multi-Tissue, Single-Cell Atlases as Tools to Elucidate Shared Mechanisms of Immune-Mediated Inflammatory Diseases.利用多组织单细胞图谱作为工具来阐明免疫介导的炎症性疾病的共同机制。
Biomedicines. 2024 Jun 12;12(6):1297. doi: 10.3390/biomedicines12061297.
7
Molecular maps of synovial cells in inflammatory arthritis using an optimized synovial tissue dissociation protocol.使用优化的滑膜组织解离方案绘制炎症性关节炎中滑膜细胞的分子图谱。
iScience. 2024 Apr 10;27(6):109707. doi: 10.1016/j.isci.2024.109707. eCollection 2024 Jun 21.
8
Systematic evaluation with practical guidelines for single-cell and spatially resolved transcriptomics data simulation under multiple scenarios.系统评估及多种场景下单细胞和空间分辨转录组数据模拟的实用指南。
Genome Biol. 2024 Jun 3;25(1):145. doi: 10.1186/s13059-024-03290-y.
9
A model of human neural networks reveals NPTX2 pathology in ALS and FTLD.人类神经网络模型揭示 ALS 和额颞叶痴呆中的 NPTX2 病理学。
Nature. 2024 Feb;626(8001):1073-1083. doi: 10.1038/s41586-024-07042-7. Epub 2024 Feb 14.
10
Semi-supervised integration of single-cell transcriptomics data.单细胞转录组学数据的半监督整合。
Nat Commun. 2024 Jan 29;15(1):872. doi: 10.1038/s41467-024-45240-z.
Muscat 可从多样本多条件单细胞转录组学数据中检测到亚群特异性状态转变。
Nat Commun. 2020 Nov 30;11(1):6077. doi: 10.1038/s41467-020-19894-4.
4
Benchmarking single-cell RNA-sequencing protocols for cell atlas projects.单细胞 RNA 测序技术在细胞图谱项目中的基准测试。
Nat Biotechnol. 2020 Jun;38(6):747-755. doi: 10.1038/s41587-020-0469-4. Epub 2020 Apr 6.
5
A benchmark of batch-effect correction methods for single-cell RNA sequencing data.单细胞 RNA 测序数据批次效应校正方法的基准测试。
Genome Biol. 2020 Jan 16;21(1):12. doi: 10.1186/s13059-019-1850-9.
6
CellBench: R/Bioconductor software for comparing single-cell RNA-seq analysis methods.CellBench:用于比较单细胞 RNA-seq 分析方法的 R/Bioconductor 软件。
Bioinformatics. 2020 Apr 1;36(7):2288-2290. doi: 10.1093/bioinformatics/btz889.
7
Fast, sensitive and accurate integration of single-cell data with Harmony.利用 Harmony 实现单细胞数据的快速、灵敏和精确整合。
Nat Methods. 2019 Dec;16(12):1289-1296. doi: 10.1038/s41592-019-0619-0. Epub 2019 Nov 18.
8
Creating and sharing reproducible research code the workflowr way.以workflowr方式创建和共享可重复的研究代码。
F1000Res. 2019 Oct 14;8:1749. doi: 10.12688/f1000research.20843.1. eCollection 2019.
9
Essential guidelines for computational method benchmarking.计算方法基准测试的基本指南。
Genome Biol. 2019 Jun 20;20(1):125. doi: 10.1186/s13059-019-1738-8.
10
Comprehensive Integration of Single-Cell Data.单细胞数据的综合整合。
Cell. 2019 Jun 13;177(7):1888-1902.e21. doi: 10.1016/j.cell.2019.05.031. Epub 2019 Jun 6.