Department of Chemistry, Royal College of Surgeons in Ireland, Dublin, Ireland.
IBM Research-Ireland, Damastown Industrial Estate, Dublin, Ireland.
PLoS One. 2021 Apr 23;16(4):e0250699. doi: 10.1371/journal.pone.0250699. eCollection 2021.
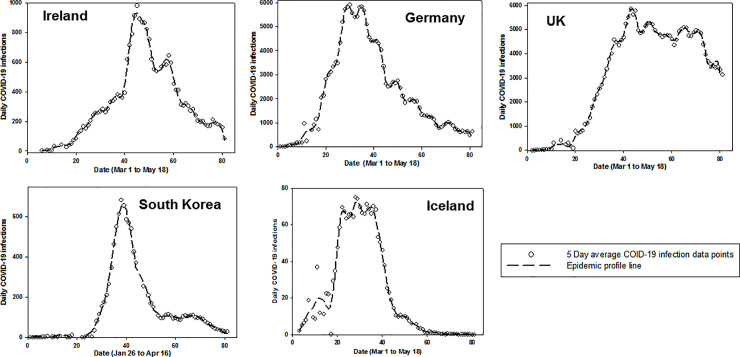
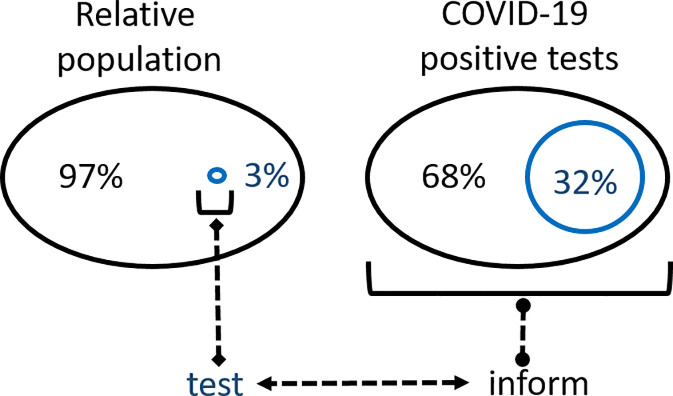
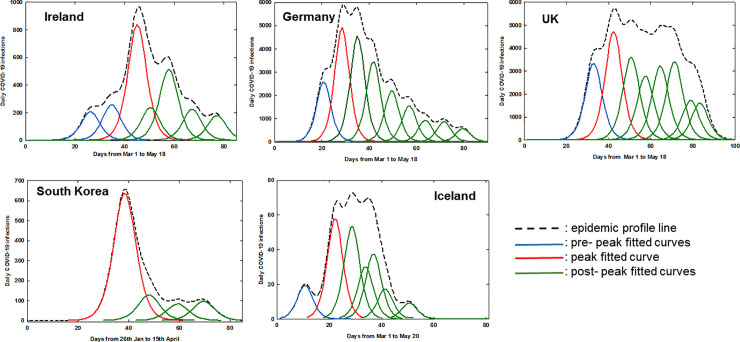
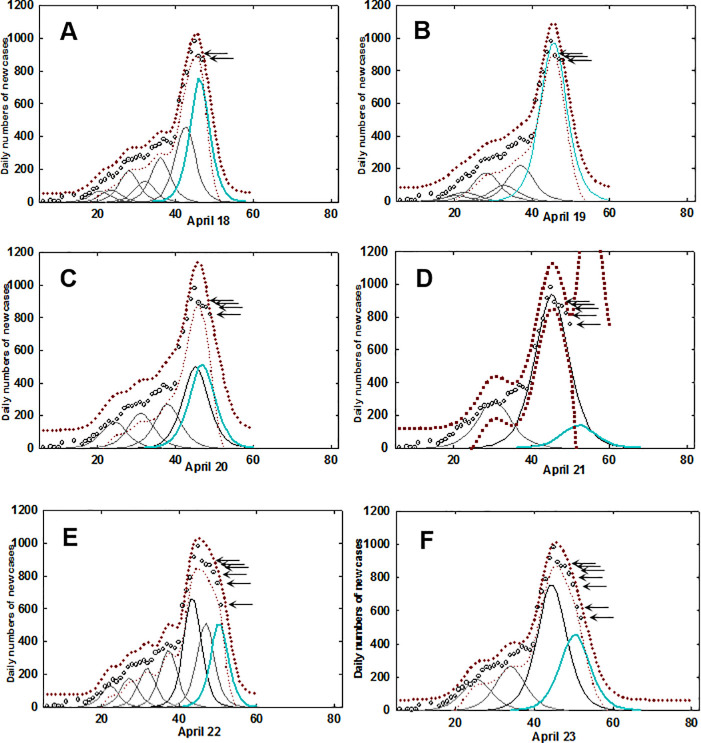
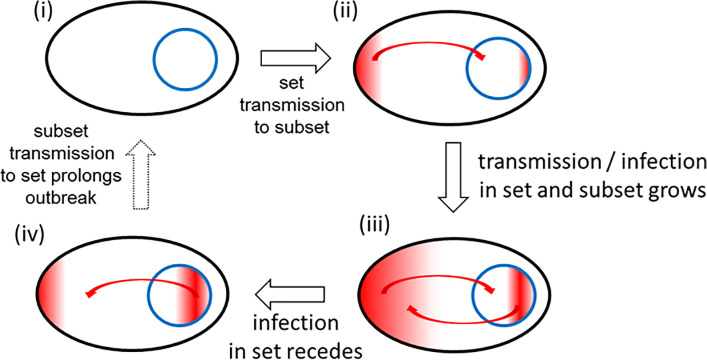
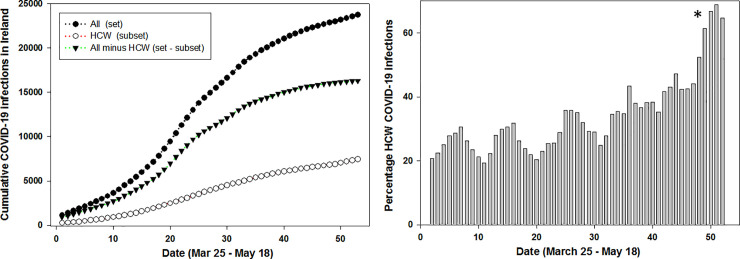
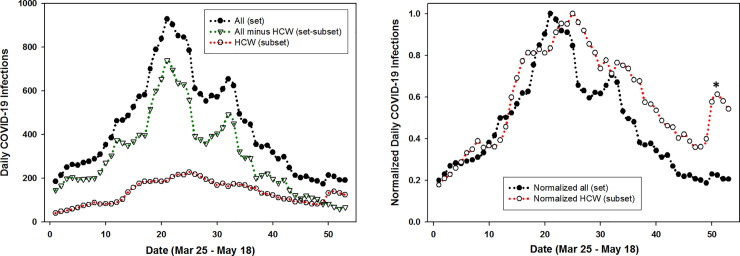
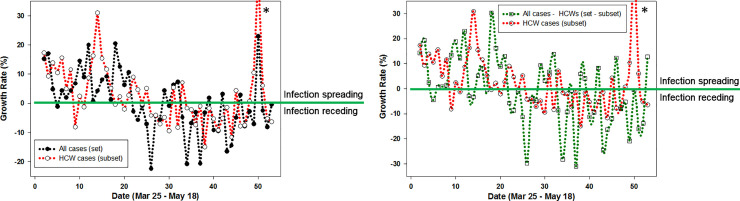
Time analysis of the course of an infectious disease epidemic is a critical way to understand the dynamics of pathogen transmission and the effect of population scale interventions. Computational methods have been applied to the progression of the COVID-19 outbreak in five different countries (Ireland, Germany, UK, South Korea and Iceland) using their reported daily infection data. A Gaussian convolution smoothing function constructed a continuous epidemic line profile that was segmented into longitudinal time series of mathematically fitted individual logistic curves. The time series of fitted curves allowed comparison of disease progression with differences in decreasing daily infection numbers following the epidemic peak being of specific interest. A positive relationship between the rate of declining infections and countries with comprehensive COVID-19 testing regimes existed. Insight into different rates of decline infection numbers following the wave peak was also possible which could be a useful tool to guide the reopening of societies. In contrast, extended epidemic timeframes were recorded for those least prepared for large-scale testing and contact tracing. As many countries continue to struggle to implement population wide testing it is prudent to explore additional measures that could be employed. Comparative analysis of healthcare worker (HCW) infection data from Ireland shows it closely related to that of the entire population with respect to trends of daily infection numbers and growth rates over a 57-day period. With 31.6% of all test-confirmed infections in healthcare workers (all employees of healthcare facilities), they represent a concentrated 3% subset of the national population which if exhaustively tested (regardless of symptom status) could provide valuable information on disease progression in the entire population (or set). Mathematically, national population and HCWs can be viewed as a set and subset with significant influences on each other, with solidarity between both an essential ingredient for ending this crisis.
分析传染病疫情的发展过程是了解病原体传播动力学和人群规模干预效果的关键方法。已经将计算方法应用于五个不同国家(爱尔兰、德国、英国、韩国和冰岛)的 COVID-19 疫情发展过程,使用了这些国家报告的每日感染数据。高斯卷积平滑函数构建了一个连续的疫情线轮廓,将其分割成数学拟合的个体逻辑曲线的纵向时间序列。拟合曲线的时间序列允许比较疾病的进展情况,并关注疫情高峰后每日感染数量减少的差异。感染率下降与全面开展 COVID-19 检测的国家之间存在正相关关系。对疫情高峰期后感染数量下降率的差异进行深入了解也是可能的,这可能是指导社会重新开放的有用工具。相比之下,那些对大规模检测和接触者追踪准备最不充分的国家,记录的疫情持续时间更长。随着许多国家继续努力实施全民检测,探索可能采用的其他措施是谨慎的。对爱尔兰医护人员(HCW)感染数据的比较分析表明,从每日感染人数和增长率的趋势来看,其与整个人口密切相关,在 57 天的时间内。在所有经检测确诊的感染病例中,医护人员(医疗保健设施的所有员工)占 31.6%,他们是全国人口的 3%的集中子集,如果对其进行全面检测(无论症状状态如何),可以提供有关整个人口(或人群)疾病进展的有价值信息。从数学角度来看,可以将全国人口和 HCW 视为一个整体和子集,它们对彼此有重大影响,两者之间的团结是结束这场危机的重要因素。