• 文献检索
  • 文档翻译
  • 深度研究
  • 学术资讯
  • Suppr Zotero 插件Zotero 插件
  • 邀请有礼
  • 套餐&价格
  • 历史记录
应用&插件
Suppr Zotero 插件Zotero 插件浏览器插件Mac 客户端Windows 客户端微信小程序
定价
高级版会员购买积分包购买API积分包
服务
文献检索文档翻译深度研究API 文档MCP 服务
关于我们
关于 Suppr公司介绍联系我们用户协议隐私条款
关注我们

Suppr 超能文献

核心技术专利:CN118964589B侵权必究
粤ICP备2023148730 号-1Suppr @ 2026

文献检索

告别复杂PubMed语法,用中文像聊天一样搜索,搜遍4000万医学文献。AI智能推荐,让科研检索更轻松。

立即免费搜索

文件翻译

保留排版,准确专业,支持PDF/Word/PPT等文件格式,支持 12+语言互译。

免费翻译文档

深度研究

AI帮你快速写综述,25分钟生成高质量综述,智能提取关键信息,辅助科研写作。

立即免费体验

使用图数据库探索染色质构象捕获实验的优势。

Advantages of using graph databases to explore chromatin conformation capture experiments.

机构信息

Institute of Electronics, Computer and Telecommunication Engineering, National Research Council of Italy, Genoa, Italy.

Computer Laboratory, University of Cambridge, Cambridge, UK.

出版信息

BMC Bioinformatics. 2021 Apr 26;22(Suppl 2):43. doi: 10.1186/s12859-020-03937-0.

DOI:10.1186/s12859-020-03937-0
PMID:33902433
原文链接:https://pmc.ncbi.nlm.nih.gov/articles/PMC8073886/
Abstract

BACKGROUND

High-throughput sequencing Chromosome Conformation Capture (Hi-C) allows the study of DNA interactions and 3D chromosome folding at the genome-wide scale. Usually, these data are represented as matrices describing the binary contacts among the different chromosome regions. On the other hand, a graph-based representation can be advantageous to describe the complex topology achieved by the DNA in the nucleus of eukaryotic cells.

METHODS

Here we discuss the use of a graph database for storing and analysing data achieved by performing Hi-C experiments. The main issue is the size of the produced data and, working with a graph-based representation, the consequent necessity of adequately managing a large number of edges (contacts) connecting nodes (genes), which represents the sources of information. For this, currently available graph visualisation tools and libraries fall short with Hi-C data. The use of graph databases, instead, supports both the analysis and the visualisation of the spatial pattern present in Hi-C data, in particular for comparing different experiments or for re-mapping omics data in a space-aware context efficiently. In particular, the possibility of describing graphs through statistical indicators and, even more, the capability of correlating them through statistical distributions allows highlighting similarities and differences among different Hi-C experiments, in different cell conditions or different cell types.

RESULTS

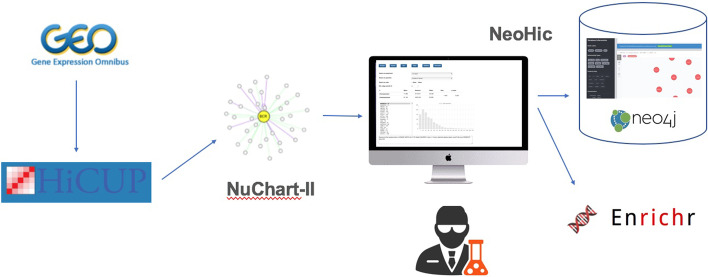
These concepts have been implemented in NeoHiC, an open-source and user-friendly web application for the progressive visualisation and analysis of Hi-C networks based on the use of the Neo4j graph database (version 3.5).

CONCLUSION

With the accumulation of more experiments, the tool will provide invaluable support to compare neighbours of genes across experiments and conditions, helping in highlighting changes in functional domains and identifying new co-organised genomic compartments.

摘要

背景

高通量测序染色体构象捕获(Hi-C)允许在全基因组范围内研究 DNA 相互作用和 3D 染色体折叠。通常,这些数据表示为描述不同染色体区域之间二进制接触的矩阵。另一方面,基于图的表示形式有利于描述真核细胞核中 DNA 所实现的复杂拓扑结构。

方法

在这里,我们讨论了使用图形数据库存储和分析通过执行 Hi-C 实验获得的数据。主要问题是产生的数据的大小,并且,使用基于图的表示形式,需要适当地管理连接节点(基因)的大量边(接触),这是信息的来源。为此,目前可用的图形可视化工具和库在处理 Hi-C 数据方面存在不足。相反,图形数据库的使用支持对 Hi-C 数据中存在的空间模式进行分析和可视化,特别是用于有效地比较不同的实验或在空间感知上下文中重新映射组学数据。特别是,通过统计指标来描述图的可能性,甚至更重要的是,通过统计分布来关联它们的能力,可以突出不同 Hi-C 实验、不同细胞条件或不同细胞类型之间的相似性和差异。

结果

这些概念已在 NeoHiC 中实现,这是一种开源且用户友好的网络应用程序,用于基于 Neo4j 图形数据库(版本 3.5)渐进式可视化和分析 Hi-C 网络。

结论

随着更多实验的积累,该工具将为比较跨实验和条件的基因邻居提供宝贵的支持,帮助突出功能域的变化并识别新的组织基因组区室。

https://cdn.ncbi.nlm.nih.gov/pmc/blobs/15e3/8073886/5dabb70ebe71/12859_2020_3937_Fig9_HTML.jpg
https://cdn.ncbi.nlm.nih.gov/pmc/blobs/15e3/8073886/c1dcc57a87d1/12859_2020_3937_Fig1_HTML.jpg
https://cdn.ncbi.nlm.nih.gov/pmc/blobs/15e3/8073886/fbec4c31f2cd/12859_2020_3937_Fig2_HTML.jpg
https://cdn.ncbi.nlm.nih.gov/pmc/blobs/15e3/8073886/43231bf97d26/12859_2020_3937_Fig3_HTML.jpg
https://cdn.ncbi.nlm.nih.gov/pmc/blobs/15e3/8073886/48df7fec0b09/12859_2020_3937_Fig4_HTML.jpg
https://cdn.ncbi.nlm.nih.gov/pmc/blobs/15e3/8073886/6bc417ac2161/12859_2020_3937_Fig5_HTML.jpg
https://cdn.ncbi.nlm.nih.gov/pmc/blobs/15e3/8073886/f1e7a72e2a27/12859_2020_3937_Fig6_HTML.jpg
https://cdn.ncbi.nlm.nih.gov/pmc/blobs/15e3/8073886/83b50ee5f9a4/12859_2020_3937_Fig7_HTML.jpg
https://cdn.ncbi.nlm.nih.gov/pmc/blobs/15e3/8073886/d5e6c5887d6b/12859_2020_3937_Fig8_HTML.jpg
https://cdn.ncbi.nlm.nih.gov/pmc/blobs/15e3/8073886/5dabb70ebe71/12859_2020_3937_Fig9_HTML.jpg

相似文献

1
Advantages of using graph databases to explore chromatin conformation capture experiments.使用图数据库探索染色质构象捕获实验的优势。
BMC Bioinformatics. 2021 Apr 26;22(Suppl 2):43. doi: 10.1186/s12859-020-03937-0.
2
NuChart: an R package to study gene spatial neighbourhoods with multi-omics annotations.NuChart:一个用于研究具有多组学注释的基因空间邻域的 R 包。
PLoS One. 2013 Sep 19;8(9):e75146. doi: 10.1371/journal.pone.0075146. eCollection 2013.
3
FAN-C: a feature-rich framework for the analysis and visualisation of chromosome conformation capture data.FAN-C:一个功能丰富的框架,用于分析和可视化染色体构象捕获数据。
Genome Biol. 2020 Dec 17;21(1):303. doi: 10.1186/s13059-020-02215-9.
4
Chromosome Conformation Capture Followed by Genome-Wide Sequencing (Hi-C) in Drosophila Embryos.果蝇胚胎中的染色体构象捕获结合全基因组测序(Hi-C)
Methods Mol Biol. 2023;2655:41-55. doi: 10.1007/978-1-0716-3143-0_4.
5
scENCORE: leveraging single-cell epigenetic data to predict chromatin conformation using graph embedding.scENCORE:利用单细胞表观遗传学数据通过图嵌入预测染色质构象。
Brief Bioinform. 2024 Jan 22;25(2). doi: 10.1093/bib/bbae096.
6
Pentad: a tool for distance-dependent analysis of Hi-C interactions within and between chromatin compartments.Pentad:一种用于分析 Hi-C 相互作用在染色质隔室内部和之间的距离依赖性的工具。
BMC Bioinformatics. 2022 Apr 2;23(1):116. doi: 10.1186/s12859-022-04654-6.
7
Prediction of gene co-expression from chromatin contacts with graph attention network.基于图注意力网络的染色质接触预测基因共表达。
Bioinformatics. 2022 Sep 30;38(19):4457-4465. doi: 10.1093/bioinformatics/btac535.
8
Practical Analysis of Genome Contact Interaction Experiments.基因组接触相互作用实验的实践分析
Methods Mol Biol. 2016;1418:177-89. doi: 10.1007/978-1-4939-3578-9_9.
9
Exploring chromatin conformation and gene co-expression through graph embedding.通过图嵌入技术探索染色质构象和基因共表达。
Bioinformatics. 2020 Dec 30;36(Suppl_2):i700-i708. doi: 10.1093/bioinformatics/btaa803.
10
Methods for the Analysis of Topologically Associating Domains (TADs).分析拓扑关联结构域(TADs)的方法。
Methods Mol Biol. 2022;2301:39-59. doi: 10.1007/978-1-0716-1390-0_3.

引用本文的文献

1
HiCrayon reveals distinct layers of multi-state 3D chromatin organization.HiCrayon揭示了多状态三维染色质组织的不同层次。
NAR Genom Bioinform. 2024 Dec 18;6(4):lqae182. doi: 10.1093/nargab/lqae182. eCollection 2024 Dec.
2
InCliniGene enables high-throughput and comprehensive in vivo clonal tracking toward clinical genomics data integration.InCliniGene 能够实现高通量和全面的体内克隆追踪,以实现临床基因组学数据的整合。
Database (Oxford). 2023 Nov 2;2023. doi: 10.1093/database/baad069.

本文引用的文献

1
HiCeekR: A Novel Shiny App for Hi-C Data Analysis.HiCeekR:一款用于Hi-C数据分析的新型闪亮应用程序。
Front Genet. 2019 Nov 4;10:1079. doi: 10.3389/fgene.2019.01079. eCollection 2019.
2
Immune modulatory functions of EZH2 in the tumor microenvironment: implications in cancer immunotherapy.EZH2在肿瘤微环境中的免疫调节功能:对癌症免疫治疗的启示
Am J Clin Exp Urol. 2019 Apr 25;7(2):85-91. eCollection 2019.
3
Temporal dynamic reorganization of 3D chromatin architecture in hormone-induced breast cancer and endocrine resistance.
激素诱导的乳腺癌及内分泌抵抗中三维染色质构象的时空调控重排
Nat Commun. 2019 Apr 3;10(1):1522. doi: 10.1038/s41467-019-09320-9.
4
Genome-wide methylotyping resolves breast cancer epigenetic heterogeneity and suggests novel therapeutic perspectives.全基因组甲基化分型解析乳腺癌表观遗传异质性,并为新的治疗方法提供思路。
Epigenomics. 2019 May;11(6):605-617. doi: 10.2217/epi-2018-0213. Epub 2019 Feb 7.
5
Advances in distributed computing with modern drug discovery.现代药物发现中的分布式计算进展。
Expert Opin Drug Discov. 2019 Jan;14(1):9-22. doi: 10.1080/17460441.2019.1552936. Epub 2018 Dec 13.
6
BioGraph: a web application and a graph database for querying and analyzing bioinformatics resources.BioGraph:一个用于查询和分析生物信息学资源的网络应用程序和图形数据库。
BMC Syst Biol. 2018 Nov 20;12(Suppl 5):98. doi: 10.1186/s12918-018-0616-4.
7
Reactome graph database: Efficient access to complex pathway data.Reactome 图形数据库:高效访问复杂的通路数据。
PLoS Comput Biol. 2018 Jan 29;14(1):e1005968. doi: 10.1371/journal.pcbi.1005968. eCollection 2018 Jan.
8
Automatic analysis and 3D-modelling of Hi-C data using TADbit reveals structural features of the fly chromatin colors.使用TADbit对Hi-C数据进行自动分析和三维建模,揭示了果蝇染色质颜色的结构特征。
PLoS Comput Biol. 2017 Jul 19;13(7):e1005665. doi: 10.1371/journal.pcbi.1005665. eCollection 2017 Jul.
9
biochem4j: Integrated and extensible biochemical knowledge through graph databases.Biochem4j:通过图形数据库实现的集成且可扩展的生化知识
PLoS One. 2017 Jul 14;12(7):e0179130. doi: 10.1371/journal.pone.0179130. eCollection 2017.
10
The Genome Conformation As an Integrator of Multi-Omic Data: The Example of Damage Spreading in Cancer.作为多组学数据整合者的基因组构象:癌症中损伤传播的实例
Front Genet. 2016 Nov 15;7:194. doi: 10.3389/fgene.2016.00194. eCollection 2016.