• 文献检索
  • 文档翻译
  • 深度研究
  • 学术资讯
  • Suppr Zotero 插件Zotero 插件
  • 邀请有礼
  • 套餐&价格
  • 历史记录
应用&插件
Suppr Zotero 插件Zotero 插件浏览器插件Mac 客户端Windows 客户端微信小程序
定价
高级版会员购买积分包购买API积分包
服务
文献检索文档翻译深度研究API 文档MCP 服务
关于我们
关于 Suppr公司介绍联系我们用户协议隐私条款
关注我们

Suppr 超能文献

核心技术专利:CN118964589B侵权必究
粤ICP备2023148730 号-1Suppr @ 2026

文献检索

告别复杂PubMed语法,用中文像聊天一样搜索,搜遍4000万医学文献。AI智能推荐,让科研检索更轻松。

立即免费搜索

文件翻译

保留排版,准确专业,支持PDF/Word/PPT等文件格式,支持 12+语言互译。

免费翻译文档

深度研究

AI帮你快速写综述,25分钟生成高质量综述,智能提取关键信息,辅助科研写作。

立即免费体验

二十五个美国城市的降温中心准备情况的比较评估。

A Comparative Assessment of Cooling Center Preparedness across Twenty-Five U.S. Cities.

机构信息

Department of Geography, Florida State University, Tallahassee, FL 32306, USA.

Department of Environmental and Occupational Health Sciences, University of Washington, Seattle, WA 98195, USA.

出版信息

Int J Environ Res Public Health. 2021 Apr 30;18(9):4801. doi: 10.3390/ijerph18094801.

DOI:10.3390/ijerph18094801
PMID:33946281
原文链接:https://pmc.ncbi.nlm.nih.gov/articles/PMC8125005/
Abstract

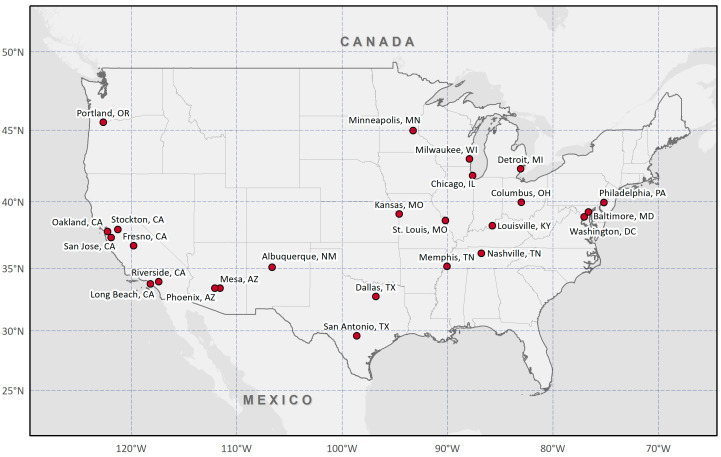
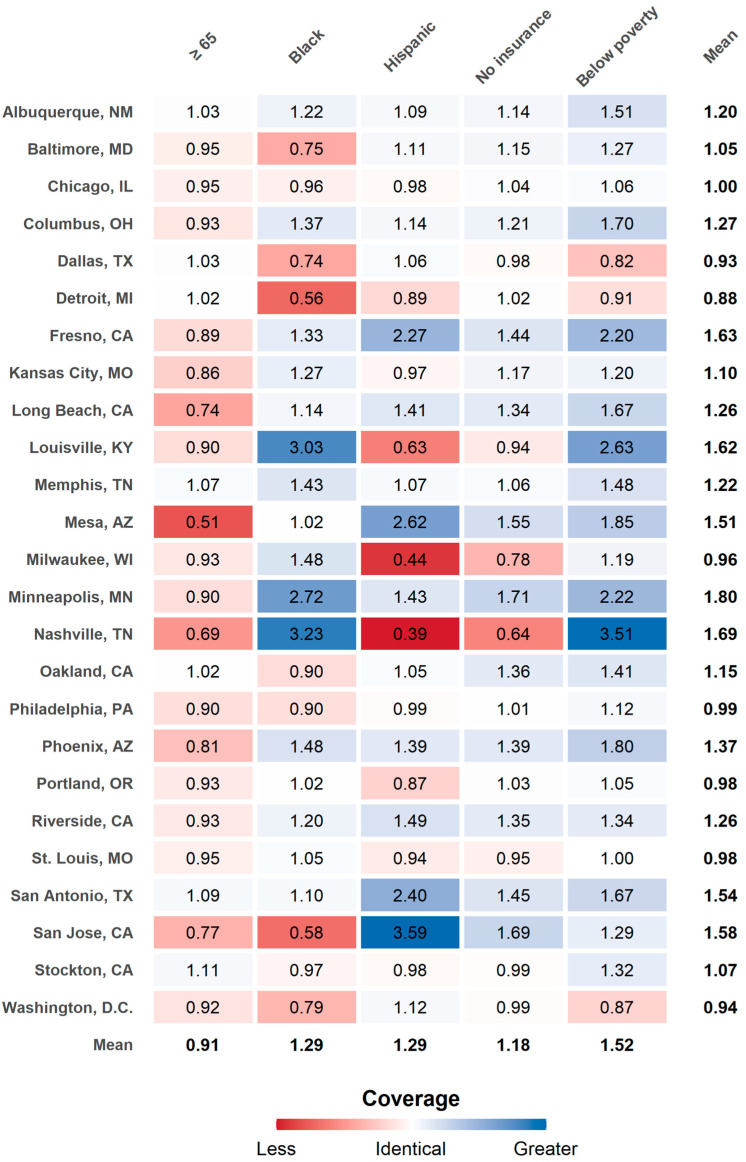
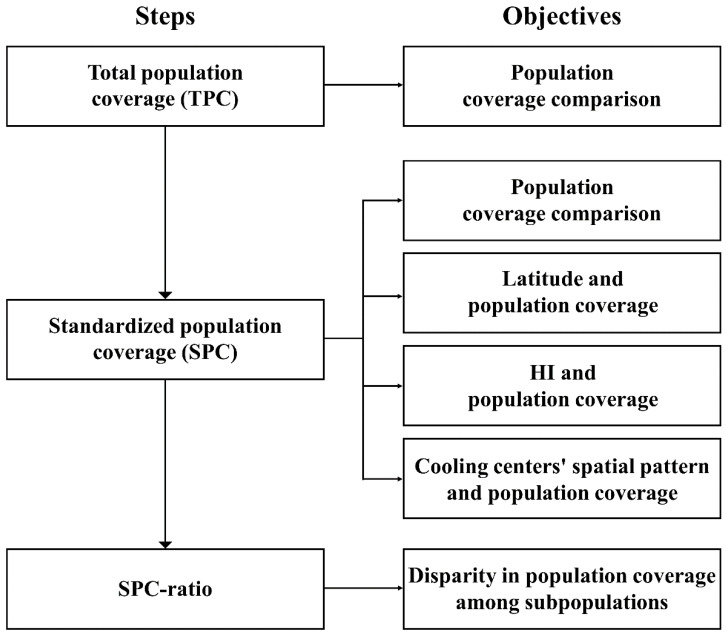
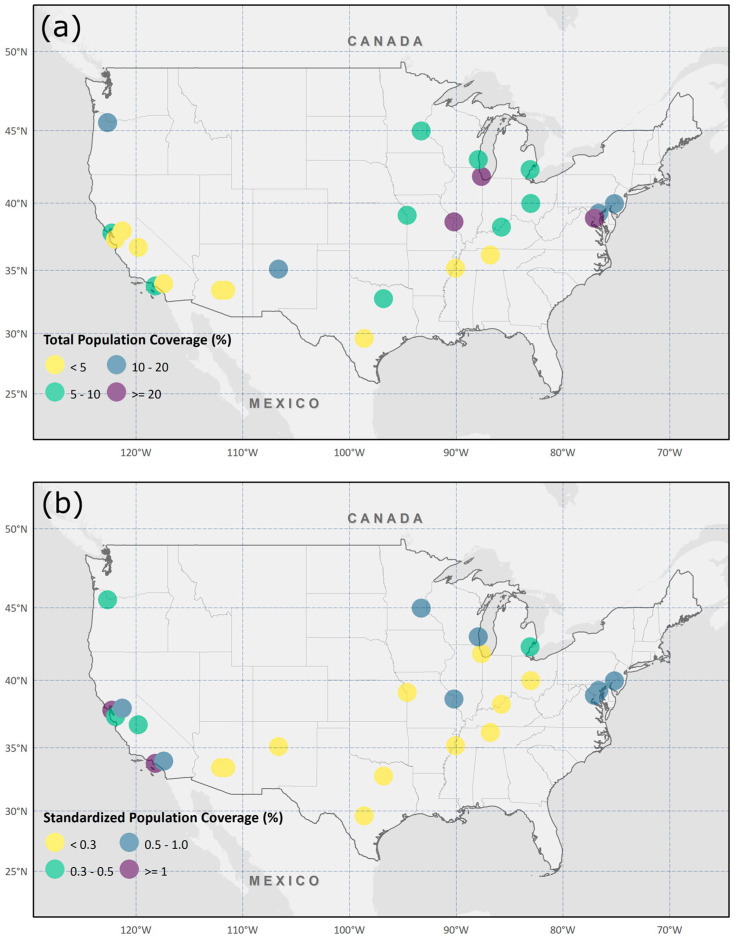
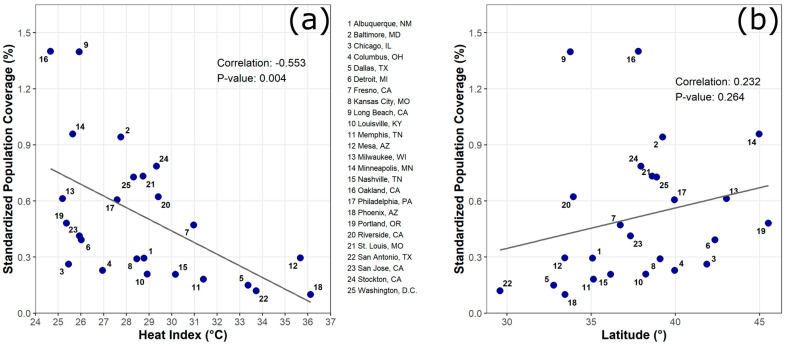
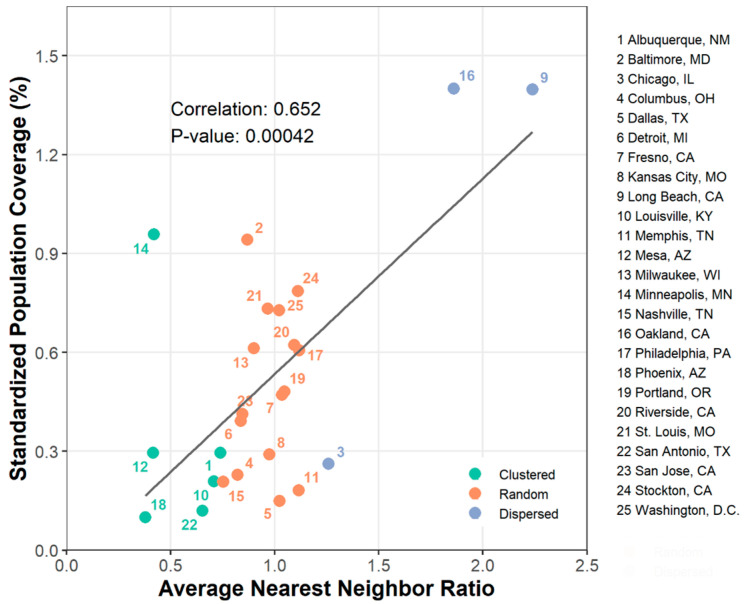
Cooling centers have played a significant role in reducing the risks of adverse health impacts of extreme heat exposure. However, there have been no comparative studies investigating cooling center preparedness in terms of population coverage, location efficiency, and population coverage disparities among different subpopulation groups. Using a catchment area method with a 0.8 km walking distance, we compared three aspects of cooling center preparedness across twenty-five cities in the U.S. We first calculated the percentage of the population covered by a single cooling center for each city. Then, the extracted values were separately compared to the city's heat indexes, latitudes, and spatial patterns of cooling centers. Finally, we investigated population coverage disparities among multiple demographics (age, race/ethnicity) and socioeconomic (insurance, poverty) subpopulation groups by comparing the percentage of population coverage between selected subpopulation groups and reference subpopulation groups. Our results showed that cooler cities, higher latitude cities, and cities with dispersed cooling centers tend to be more prepared than warmer cities, lower latitude cities, and cities with clustered cooling centers across the U.S. Moreover, older people (≥65) had 9% lower population coverage than younger people (≤64). Our results suggest that the placement of future cooling centers should consider both the location of other nearby cooling centers and the spatial distribution of subpopulations to maximize population coverage and reduce access disparities among several subpopulations.

摘要

降温中心在降低高温暴露对健康的不利影响方面发挥了重要作用。然而,目前还没有比较研究调查降温中心在人口覆盖范围、位置效率以及不同亚人群之间的人口覆盖差距方面的准备情况。我们使用具有 0.8 公里步行距离的集水区方法,比较了美国 25 个城市的三个方面的降温中心准备情况。我们首先计算了每个城市单个降温中心所覆盖的人口比例。然后,将提取的值分别与城市的热指数、纬度和降温中心的空间模式进行比较。最后,我们通过比较选定亚人群与参考亚人群之间的人口覆盖比例,调查了多个人口统计学(年龄、种族/民族)和社会经济(保险、贫困)亚人群之间的人口覆盖差距。结果表明,美国较凉爽的城市、纬度较高的城市和降温中心分布较分散的城市比较温暖的城市、纬度较低的城市和降温中心集中的城市准备得更充分。此外,老年人(≥65 岁)的人口覆盖比例比年轻人(≤64 岁)低 9%。我们的研究结果表明,未来降温中心的选址应同时考虑其他附近降温中心的位置和亚人群的空间分布,以最大限度地提高人口覆盖范围,并减少多个亚人群之间的可达性差距。

https://cdn.ncbi.nlm.nih.gov/pmc/blobs/4deb/8125005/3d246b1b6a33/ijerph-18-04801-g006.jpg
https://cdn.ncbi.nlm.nih.gov/pmc/blobs/4deb/8125005/c78d9aefea78/ijerph-18-04801-g001.jpg
https://cdn.ncbi.nlm.nih.gov/pmc/blobs/4deb/8125005/ffdc0fc4edfe/ijerph-18-04801-g002.jpg
https://cdn.ncbi.nlm.nih.gov/pmc/blobs/4deb/8125005/235cd2a1ee07/ijerph-18-04801-g003.jpg
https://cdn.ncbi.nlm.nih.gov/pmc/blobs/4deb/8125005/7be5ca2ff905/ijerph-18-04801-g004.jpg
https://cdn.ncbi.nlm.nih.gov/pmc/blobs/4deb/8125005/36679490426a/ijerph-18-04801-g005.jpg
https://cdn.ncbi.nlm.nih.gov/pmc/blobs/4deb/8125005/3d246b1b6a33/ijerph-18-04801-g006.jpg

相似文献

1
A Comparative Assessment of Cooling Center Preparedness across Twenty-Five U.S. Cities.二十五个美国城市的降温中心准备情况的比较评估。
Int J Environ Res Public Health. 2021 Apr 30;18(9):4801. doi: 10.3390/ijerph18094801.
2
Examining the Optimal Placement of Cooling Centers to Serve Populations at High Risk of Extreme Heat Exposure in 81 US Cities.评估 81 个美国城市中高温暴露高危人群的最佳降温中心选址。
Public Health Rep. 2023 Nov-Dec;138(6):955-962. doi: 10.1177/00333549221148174. Epub 2023 Feb 1.
3
Assessing Virginia cooling centers as a heat mitigation strategy.评估弗吉尼亚州冷却中心作为缓解高温策略的效果。
J Emerg Manag. 2022 May-Jun;20(3):205-224. doi: 10.5055/jem.0671.
4
Cooling Effect of Green Spaces on Urban Heat Island in a Chinese Megacity: Increasing Coverage versus Optimizing Spatial Distribution.城市绿地缓解城市热岛效应的作用:增加覆盖面积与优化空间分布的比较。
Environ Sci Technol. 2024 Apr 2;58(13):5811-5820. doi: 10.1021/acs.est.3c11048. Epub 2024 Mar 19.
5
Building Vulnerability in a Changing Climate: Indoor Temperature Exposures and Health Outcomes in Older Adults Living in Public Housing during an Extreme Heat Event in Cambridge, MA.在气候变化中建立脆弱性:在马萨诸塞州剑桥市的一次极端高温事件中,居住在公共住房中的老年人的室内温度暴露和健康结果。
Int J Environ Res Public Health. 2019 Jul 4;16(13):2373. doi: 10.3390/ijerph16132373.
6
A Heat Vulnerability Index: Spatial Patterns of Exposure, Sensitivity and Adaptive Capacity for Urbanites of Four Cities of India.热脆弱性指数:印度四个城市城市居民的暴露、敏感性和适应能力的空间模式。
Int J Environ Res Public Health. 2021 Dec 28;19(1):283. doi: 10.3390/ijerph19010283.
7
Non-linear effects of meteorological variables on cooling efficiency of African urban trees.气象变量对非洲城市树木降温效率的非线性影响。
Environ Int. 2022 Nov;169:107489. doi: 10.1016/j.envint.2022.107489. Epub 2022 Aug 24.
8
Targeted implementation of cool roofs for equitable urban adaptation to extreme heat.针对极端高温的城市适应问题,实施有针对性的冷屋顶措施。
Sci Total Environ. 2022 Mar 10;811:151326. doi: 10.1016/j.scitotenv.2021.151326. Epub 2021 Oct 29.
9
The 2023 Latin America report of the Countdown on health and climate change: the imperative for health-centred climate-resilient development.《2023年健康与气候变化倒计时拉丁美洲报告:以健康为中心的气候适应型发展的必要性》
Lancet Reg Health Am. 2024 Apr 23;33:100746. doi: 10.1016/j.lana.2024.100746. eCollection 2024 May.
10
Variation in estimates of heat-related mortality reduction due to tree cover in U.S. cities.美国城市中因树木覆盖而减少与热相关的死亡人数的估计值存在差异。
J Environ Manage. 2022 Jan 1;301:113751. doi: 10.1016/j.jenvman.2021.113751. Epub 2021 Oct 7.

引用本文的文献

1
Optimal decision-making in relieving global high temperature-related disease burden by data-driven simulation.通过数据驱动模拟减轻全球高温相关疾病负担的最优决策
Infect Dis Model. 2024 Mar 19;9(2):618-633. doi: 10.1016/j.idm.2024.03.001. eCollection 2024 Jun.
2
Examining the Optimal Placement of Cooling Centers to Serve Populations at High Risk of Extreme Heat Exposure in 81 US Cities.评估 81 个美国城市中高温暴露高危人群的最佳降温中心选址。
Public Health Rep. 2023 Nov-Dec;138(6):955-962. doi: 10.1177/00333549221148174. Epub 2023 Feb 1.

本文引用的文献

1
Accessibility of cooling centers to heat-vulnerable populations in New York State.纽约州冷却中心对易受热人群的可达性。
J Transp Health. 2019 Sep;14. doi: 10.1016/j.jth.2019.05.002.
2
Cardiorespiratory effects of heatwaves: A systematic review and meta-analysis of global epidemiological evidence.热浪对心肺的影响:全球流行病学证据的系统评价和荟萃分析。
Environ Res. 2019 Oct;177:108610. doi: 10.1016/j.envres.2019.108610. Epub 2019 Jul 26.
3
Assessing Vulnerability to Urban Heat: A Study of Disproportionate Heat Exposure and Access to Refuge by Socio-Demographic Status in Portland, Oregon.
评估城市热脆弱性:俄勒冈州波特兰市基于社会人口地位的不成比例热暴露和避难所可达性研究。
Int J Environ Res Public Health. 2018 Mar 30;15(4):640. doi: 10.3390/ijerph15040640.
4
Staying cool in a changing climate: Reaching vulnerable populations during heat events.在气候变化中保持凉爽:在高温事件期间接触弱势群体。
Glob Environ Change. 2013 Apr;23(2):475-484. doi: 10.1016/j.gloenvcha.2012.12.011.
5
Predictive neuromechanical simulations indicate why walking performance declines with ageing.预测神经力学模拟表明为什么随着年龄的增长,步行表现会下降。
J Physiol. 2018 Apr 1;596(7):1199-1210. doi: 10.1113/JP275166. Epub 2018 Mar 2.
6
Ambient temperature and added heat wave effects on hospitalizations in California from 1999 to 2009.1999 年至 2009 年加利福尼亚州住院人数与环境温度和额外热浪效应的关系。
Environ Res. 2018 Jan;160:83-90. doi: 10.1016/j.envres.2017.08.052. Epub 2017 Sep 30.
7
A Heat Vulnerability Index and Adaptation Solutions for Pittsburgh, Pennsylvania.宾夕法尼亚州匹兹堡市的热脆弱性指数和适应解决方案。
Environ Sci Technol. 2015 Oct 6;49(19):11303-11. doi: 10.1021/acs.est.5b03127. Epub 2015 Sep 16.
8
Limitations to Thermoregulation and Acclimatization Challenge Human Adaptation to Global Warming.体温调节和适应能力的局限对人类适应全球变暖构成挑战。
Int J Environ Res Public Health. 2015 Jul 15;12(7):8034-74. doi: 10.3390/ijerph120708034.
9
Heat waves and morbidity: current knowledge and further direction-a comprehensive literature review.热浪与发病率:当前认知与未来方向——一项综合文献综述
Int J Environ Res Public Health. 2015 May 18;12(5):5256-83. doi: 10.3390/ijerph120505256.
10
A Case-Only Study of Vulnerability to Heat Wave-Related Mortality in New York City (2000-2011).纽约市热浪相关死亡率易感性的病例对照研究(2000 - 2011年)
Environ Health Perspect. 2015 Jul;123(7):672-8. doi: 10.1289/ehp.1408178. Epub 2015 Mar 17.