Milano Marianna, Zucco Chiara, Cannataro Mario
Department of Medical and Surgical Sciences, University of Catanzaro, Catanzaro, 88100 Italy.
Data Analytics Research Center, University of Catanzaro, Catanzaro, Catanzaro, 88100 Italy.
Netw Model Anal Health Inform Bioinform. 2021;10(1):46. doi: 10.1007/s13721-021-00323-5. Epub 2021 Jul 2.
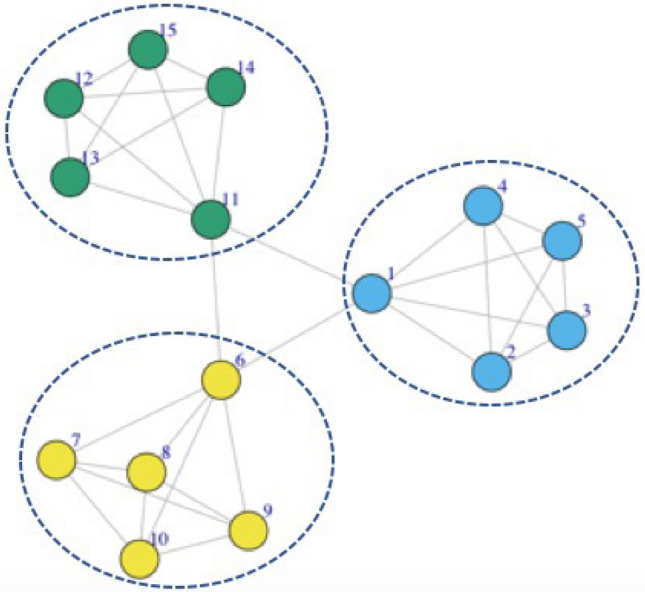
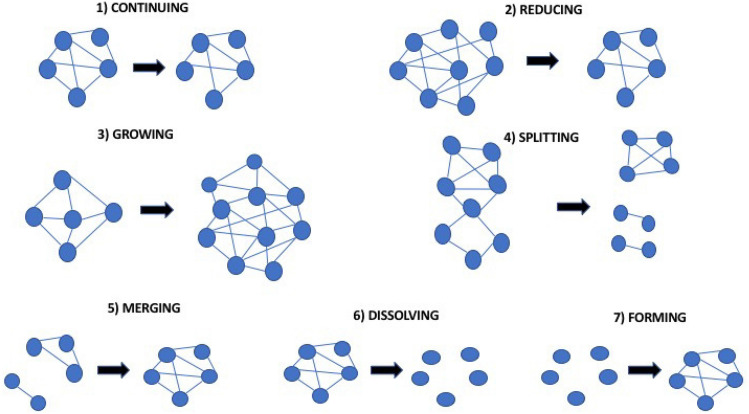
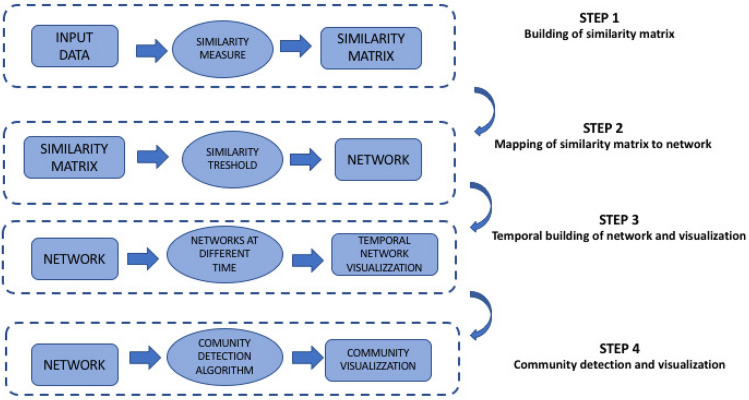
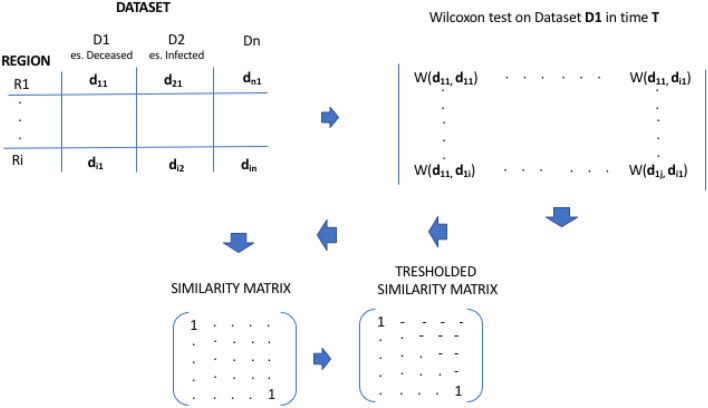
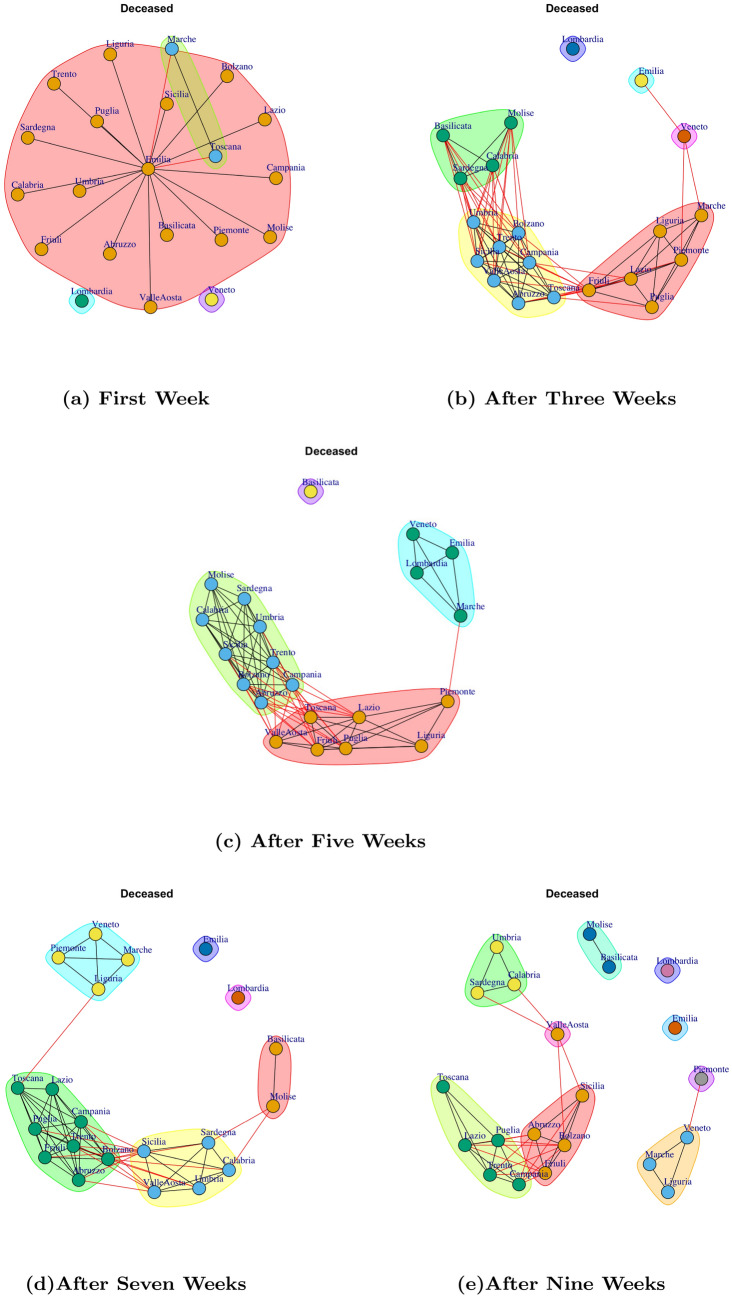
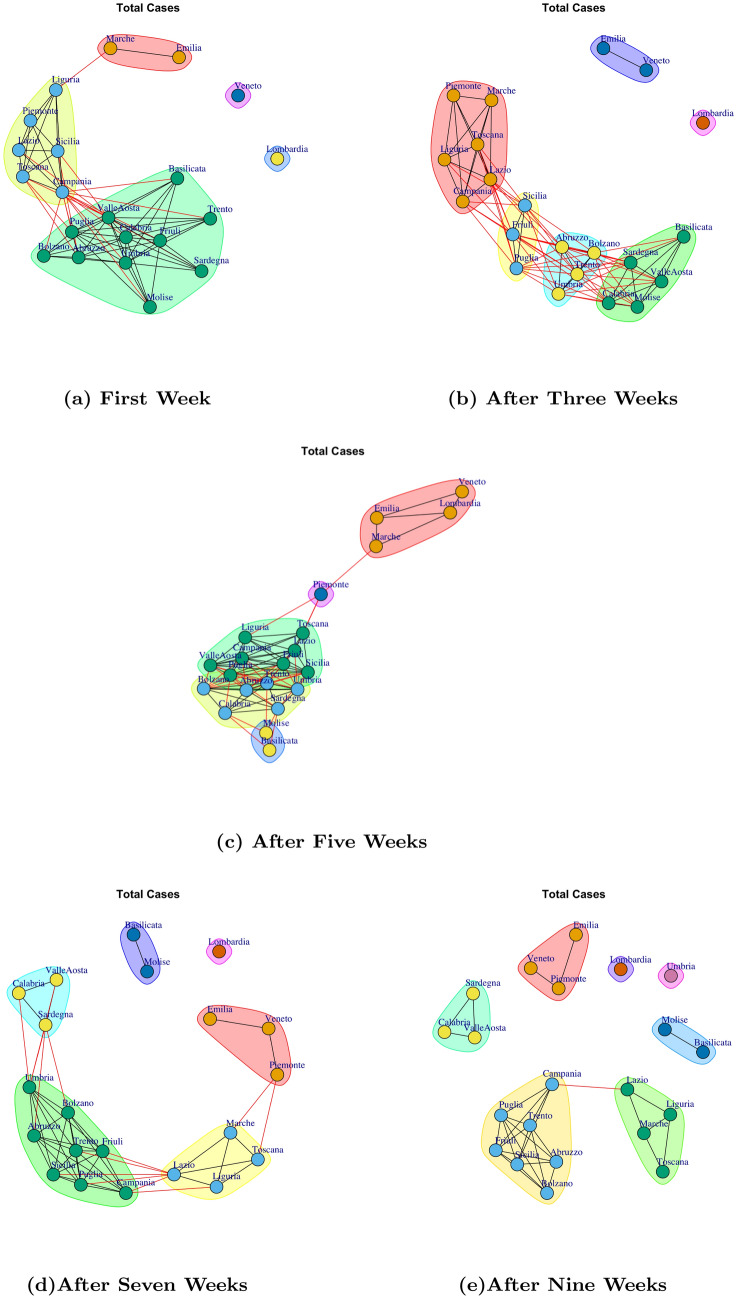
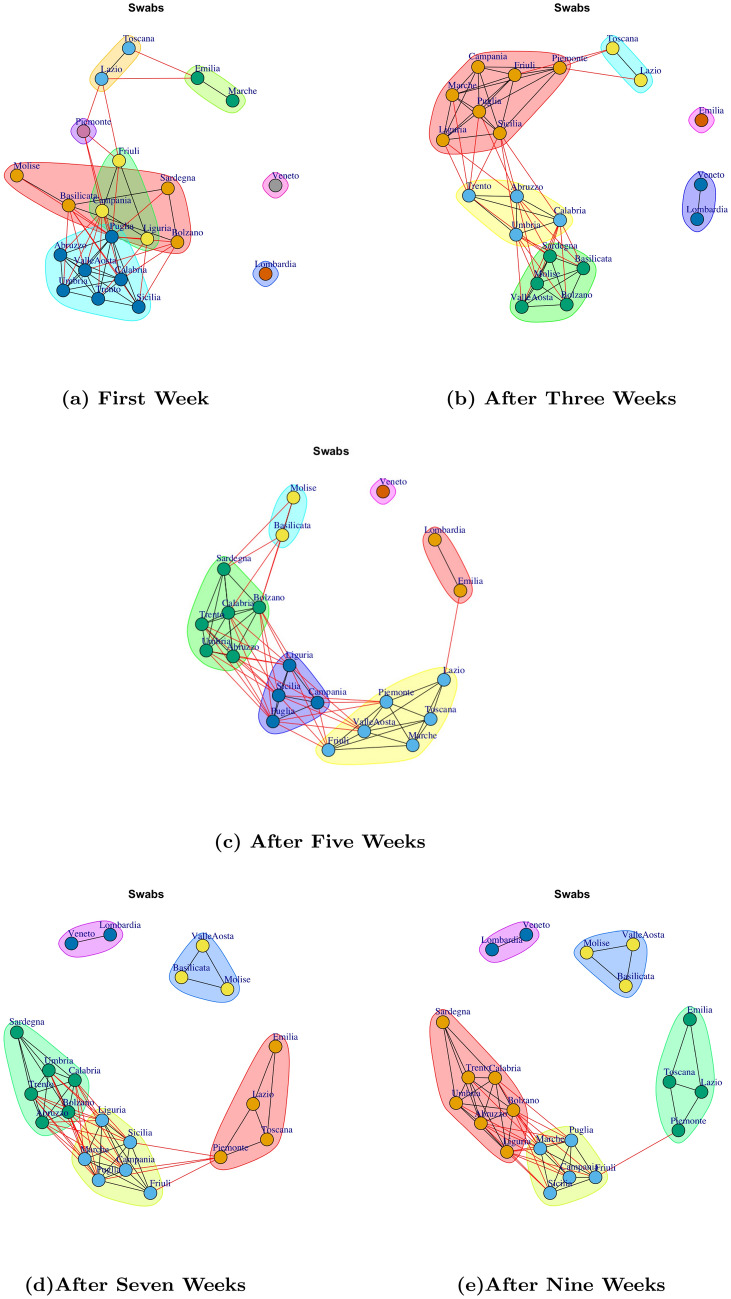
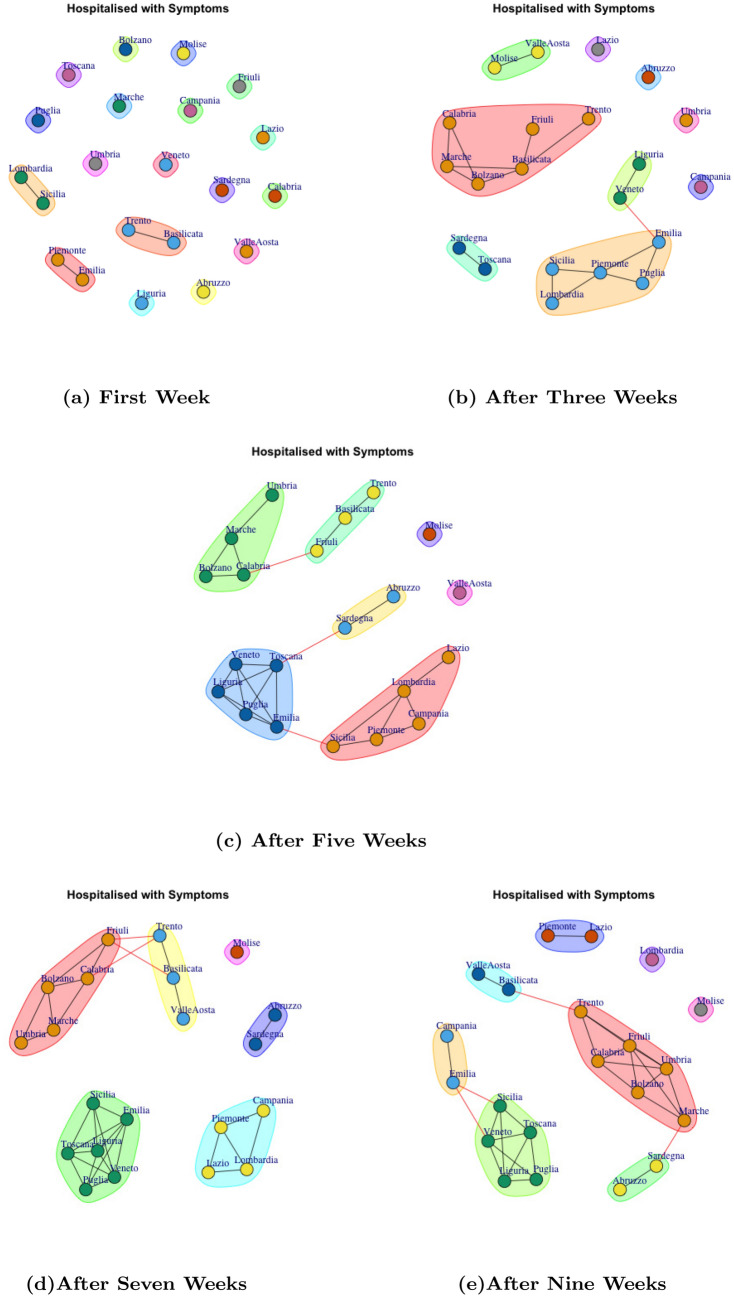
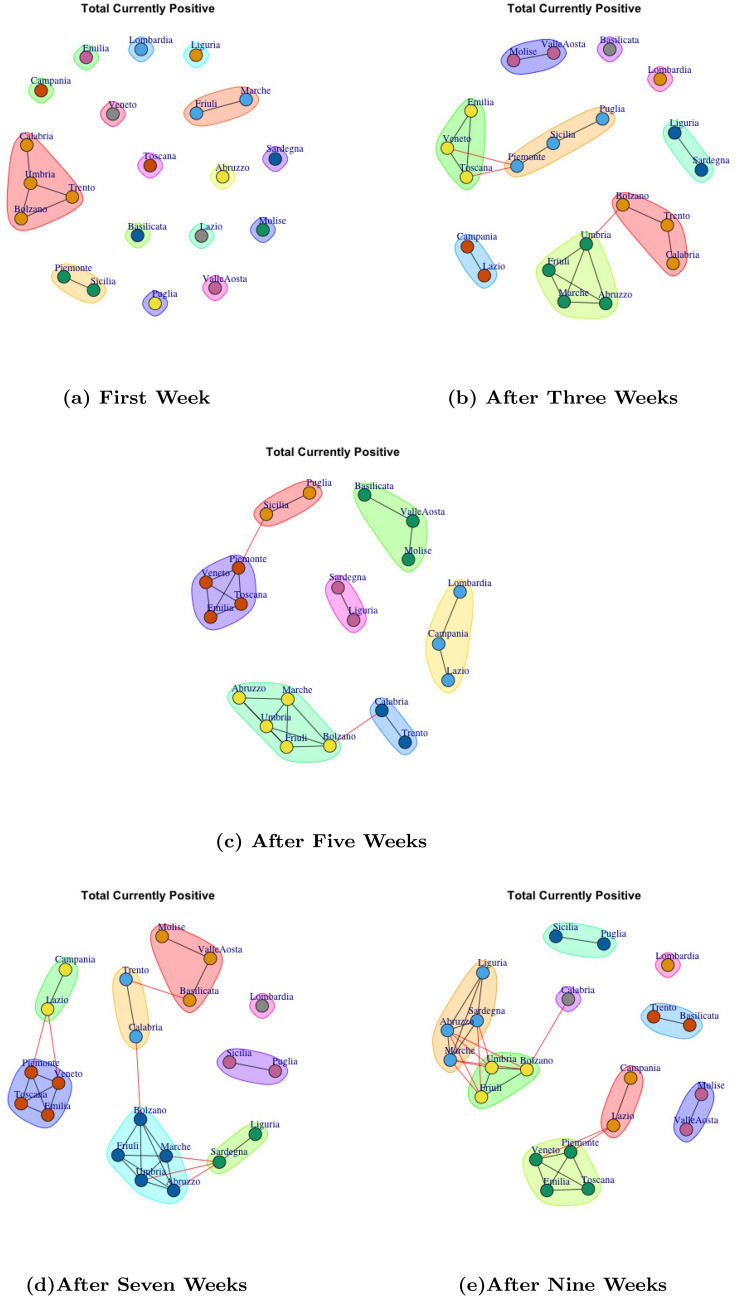
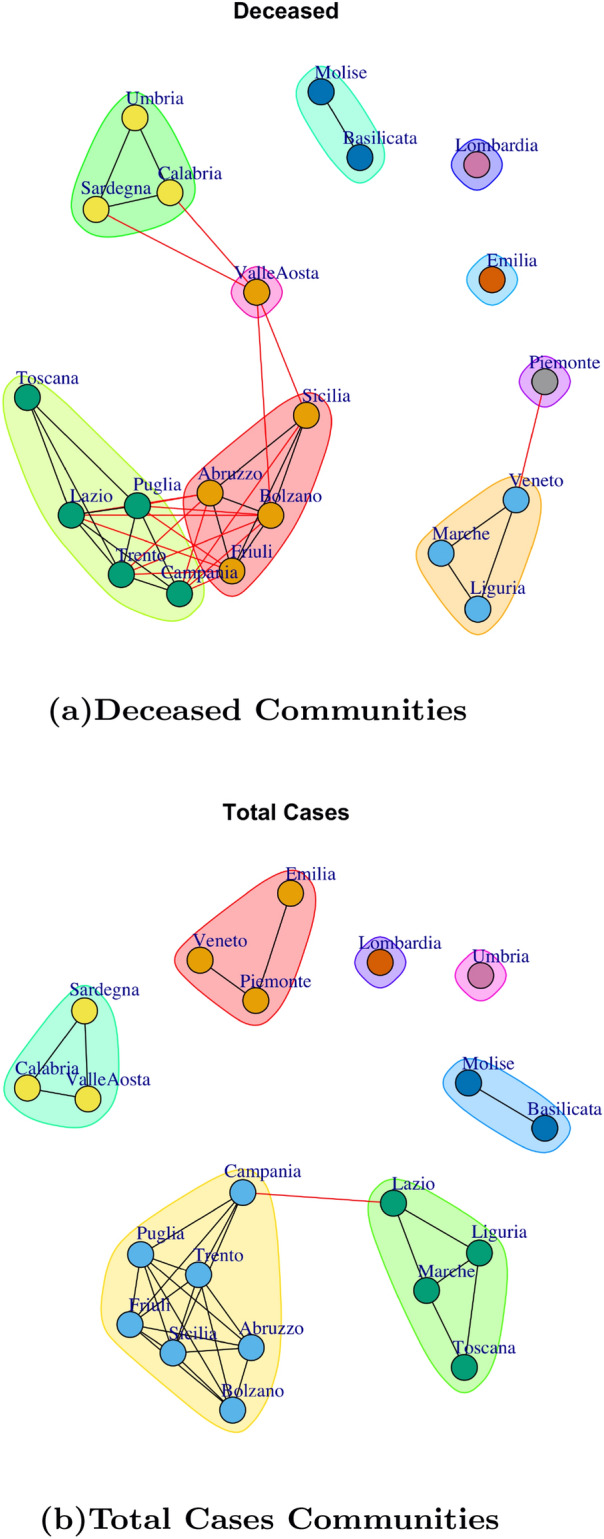
Understanding the evolution of the spread of the COVID-19 pandemic requires the analysis of several data at the spatial and temporal levels. Here, we present a new network-based methodology to analyze COVID-19 data measures containing spatial and temporal features and its application on a real dataset. The goal of the methodology is to analyze sets of homogeneous datasets (i.e. COVID-19 data taken in different periods and in several regions) using a statistical test to find similar/dissimilar datasets, mapping such similarity information on a graph and then using a community detection algorithm to visualize and analyze the spatio-temporal evolution of data. We evaluated diverse Italian COVID-19 data made publicly available by the Italian Protezione Civile Department at https://github.com/pcm-dpc/COVID-19/. Furthermore, we considered the climate data related to two periods and we integrated them with COVID-19 data measures to detect new communities related to climate changes. In conclusion, the application of the proposed methodology provides a network-based representation of the COVID-19 measures by highlighting the different behaviour of regions with respect to pandemics data released by Protezione Civile and climate data. The methodology and its implementation as R function are publicly available at https://github.com/mmilano87/analyzeC19D.
要了解新冠疫情传播的演变,需要在空间和时间层面分析多个数据。在此,我们提出一种基于网络的新方法,用于分析包含空间和时间特征的新冠疫情数据指标及其在真实数据集上的应用。该方法的目标是使用统计检验来分析同类数据集(即不同时期、多个地区的新冠疫情数据),以找出相似/不同的数据集,将此类相似性信息映射到图上,然后使用社区检测算法来可视化和分析数据的时空演变。我们评估了意大利民防部门在https://github.com/pcm-dpc/COVID-19/上公开提供的各类意大利新冠疫情数据。此外,我们考虑了两个时期的气候数据,并将其与新冠疫情数据指标相结合,以检测与气候变化相关的新社区。总之,所提方法的应用通过突出各地区在民防部门发布的疫情数据和气候数据方面的不同表现,提供了一种基于网络的新冠疫情指标表示。该方法及其作为R函数的实现可在https://github.com/mmilano87/analyzeC19D上公开获取。