Laboratory of Medical Microbiology, Vaccine & Infectious Disease Institute (VAXINFECTIO), University of Antwerp, Antwerp, Belgium.
Interuniversity Institute for Biostatistics and statistical Bioinformatics (I-BIOSTAT), Data Science Institute, Hasselt University, Hasselt, Belgium.
J Antimicrob Chemother. 2021 Jul 26;76(12 Suppl 2):ii14-ii21. doi: 10.1093/jac/dkab173.
Data on consumption of penicillins in the community were collected from 30 EU/European Economic Area (EEA) countries over two decades. This article reviews temporal trends, seasonal variation, presence of change-points and changes in the composition of the main subgroups of penicillins.
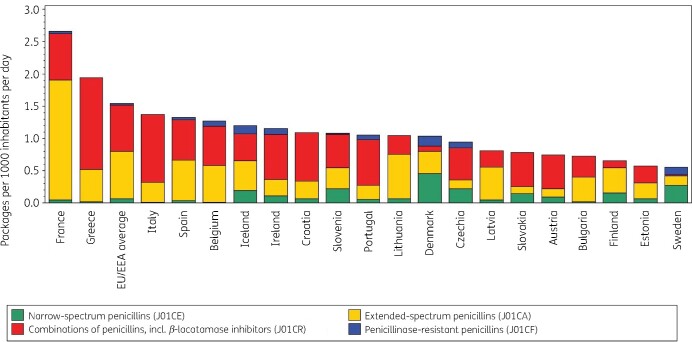
For the period 1997-2017, data on consumption of penicillins, i.e. β-lactam antibacterials, penicillins (ATC group J01C), in the community aggregated at the level of the active substance, were collected using the WHO ATC/DDD methodology (ATC/DDD index 2019). Consumption was expressed in DDD per 1000 inhabitants per day and in packages per 1000 inhabitants per day. Consumption of penicillins was analysed based on ATC-4 subgroups, and presented as trends, seasonal variation, presence of change-points and compositional changes.
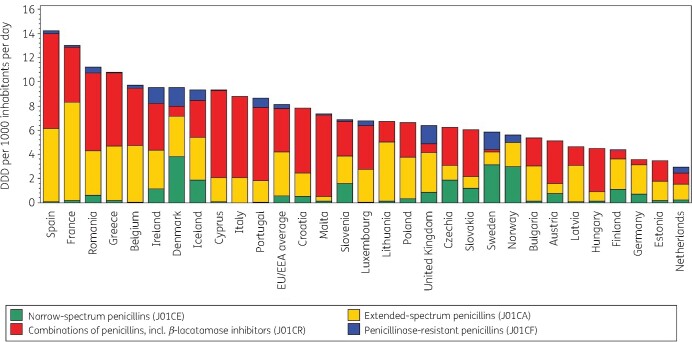
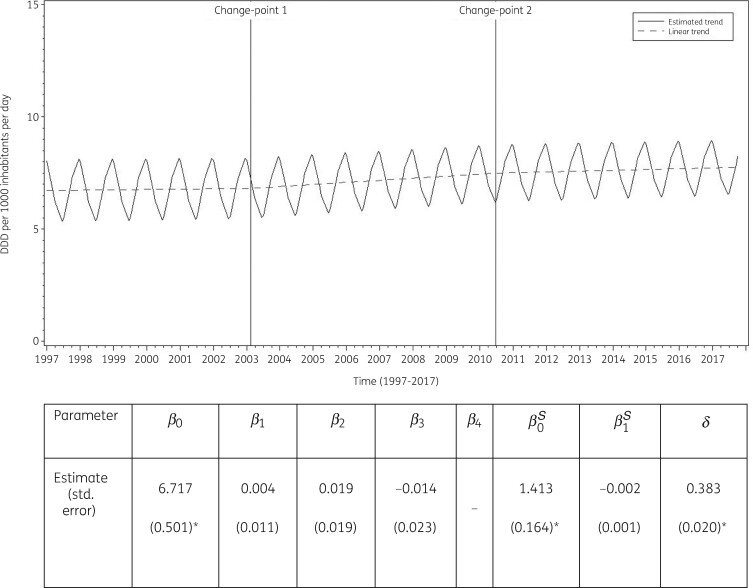
In 2017, consumption of penicillins in the community expressed in DDD per 1000 inhabitants per day varied by a factor of 4.9 between countries with the highest (Spain) and the lowest (the Netherlands) consumption. An increase in consumption of penicillins, which was not statistically significant, was observed between 1997 and 2003 and up to 2010. A decrease, which was not statistically significant, was observed from 2010 onwards. Proportional consumption of combinations of penicillins, including β-lactamase inhibitors (J01CR) increased during 1997-2017, which coincided with a decrease in the proportional consumption of extended-spectrum penicillins (J01CA) and narrow-spectrum penicillins (J01CE).
Considerable variation in the patterns of consumption of penicillins was observed between EU/EEA countries. The consumption of penicillins in the EU/EEA community did not change significantly over time, while the proportional consumption of combinations of penicillins increased.
从 30 个欧盟/欧洲经济区(EEA)国家收集了 20 多年来社区中青霉素使用的数据。本文回顾了时间趋势、季节性变化、变化点的存在以及青霉素主要亚组组成的变化。
在 1997 年至 2017 年期间,使用世界卫生组织 ATC/DDD 方法(2019 年 ATC/DDD 索引),以活性物质水平汇总的社区中青霉素(β-内酰胺抗菌药,ATC 组 J01C)使用数据进行收集。使用 DDD/1000 居民/天和包装/1000 居民/天表示消耗量。根据 ATC-4 亚组分析青霉素的使用情况,并展示趋势、季节性变化、变化点的存在和组成变化。
2017 年,社区中以 DDD/1000 居民/天表示的青霉素使用量在消费最高(西班牙)和最低(荷兰)的国家之间相差 4.9 倍。1997 年至 2003 年以及直至 2010 年期间,青霉素的使用量呈上升趋势,但无统计学意义。自 2010 年以来,使用量呈下降趋势,但无统计学意义。1997 年至 2017 年期间,包括β-内酰胺酶抑制剂(J01CR)在内的青霉素组合的比例消耗增加,这与广谱青霉素(J01CA)和窄谱青霉素(J01CE)的比例消耗减少相吻合。
欧盟/EEA 国家之间观察到青霉素使用模式存在相当大的差异。欧盟/EEA 社区中青霉素的使用量随时间没有明显变化,而青霉素组合的比例消耗增加。