• 文献检索
  • 文档翻译
  • 深度研究
  • 学术资讯
  • Suppr Zotero 插件Zotero 插件
  • 邀请有礼
  • 套餐&价格
  • 历史记录
应用&插件
Suppr Zotero 插件Zotero 插件浏览器插件Mac 客户端Windows 客户端微信小程序
定价
高级版会员购买积分包购买API积分包
服务
文献检索文档翻译深度研究API 文档MCP 服务
关于我们
关于 Suppr公司介绍联系我们用户协议隐私条款
关注我们

Suppr 超能文献

核心技术专利:CN118964589B侵权必究
粤ICP备2023148730 号-1Suppr @ 2026

文献检索

告别复杂PubMed语法,用中文像聊天一样搜索,搜遍4000万医学文献。AI智能推荐,让科研检索更轻松。

立即免费搜索

文件翻译

保留排版,准确专业,支持PDF/Word/PPT等文件格式,支持 12+语言互译。

免费翻译文档

深度研究

AI帮你快速写综述,25分钟生成高质量综述,智能提取关键信息,辅助科研写作。

立即免费体验

林冠反射率模型说明了高纬度生态系统中 NDVI 对变化的不同响应。

Canopy reflectance models illustrate varying NDVI responses to change in high latitude ecosystems.

机构信息

Joint Center for Earth Systems Research, University of Maryland Baltimore County, NASA/GSFC Code 618, Greenbelt, Maryland, 20771, USA.

Department of Biological Sciences and the Environmental Science and Engineering Program, University of Texas at El Paso, El Paso, Texas, 79968, USA.

出版信息

Ecol Appl. 2021 Dec;31(8):e02435. doi: 10.1002/eap.2435. Epub 2021 Aug 26.

DOI:10.1002/eap.2435
PMID:34374152
原文链接:https://pmc.ncbi.nlm.nih.gov/articles/PMC9285598/
Abstract

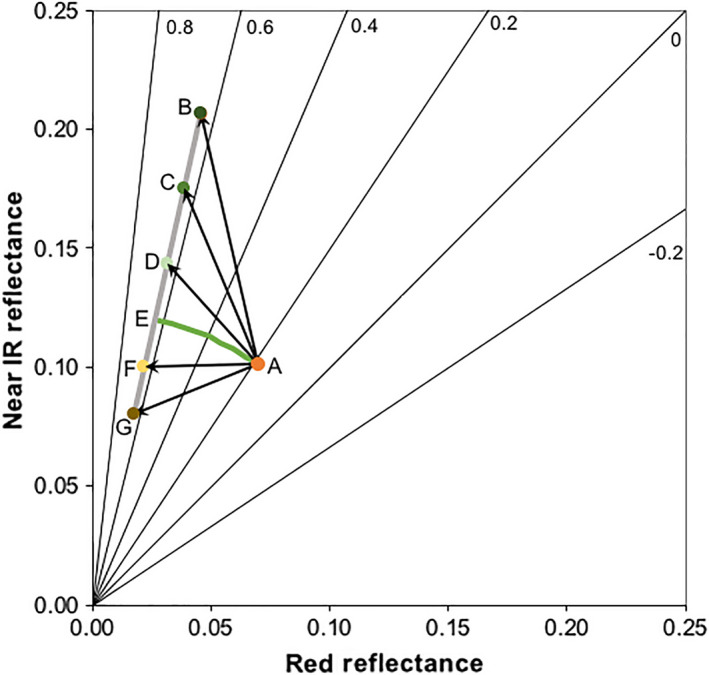
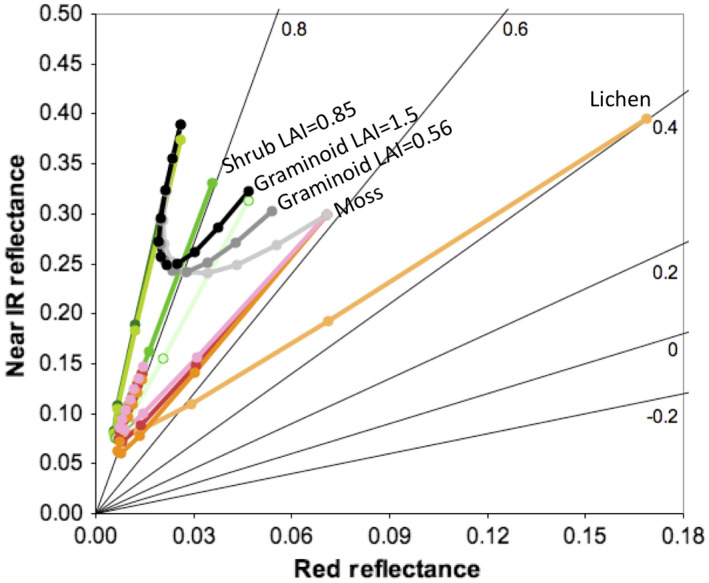
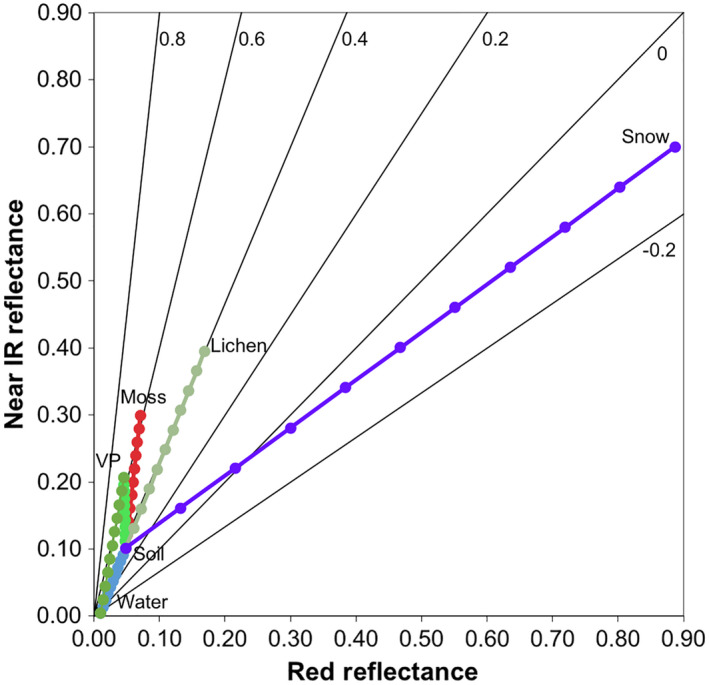
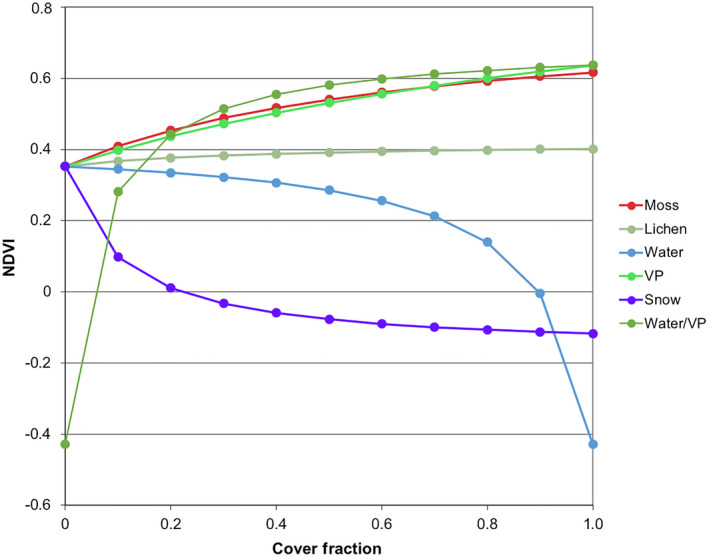
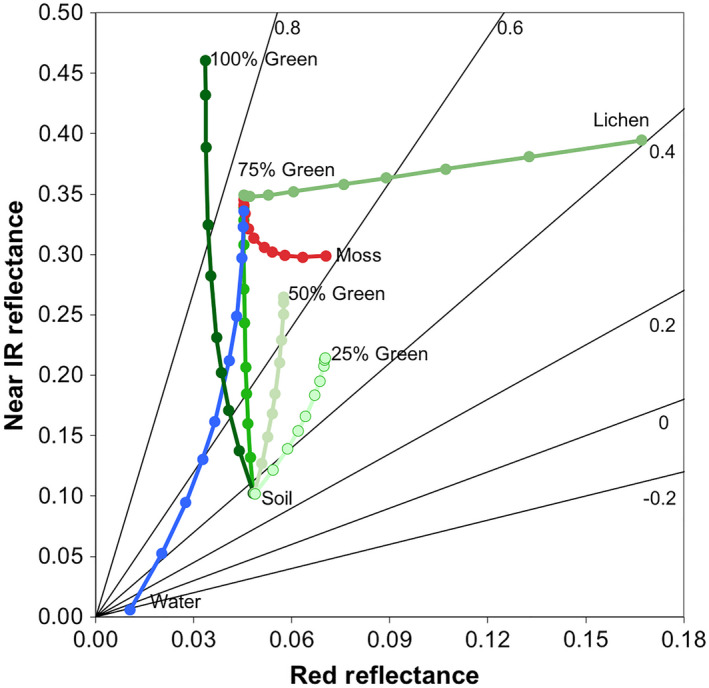
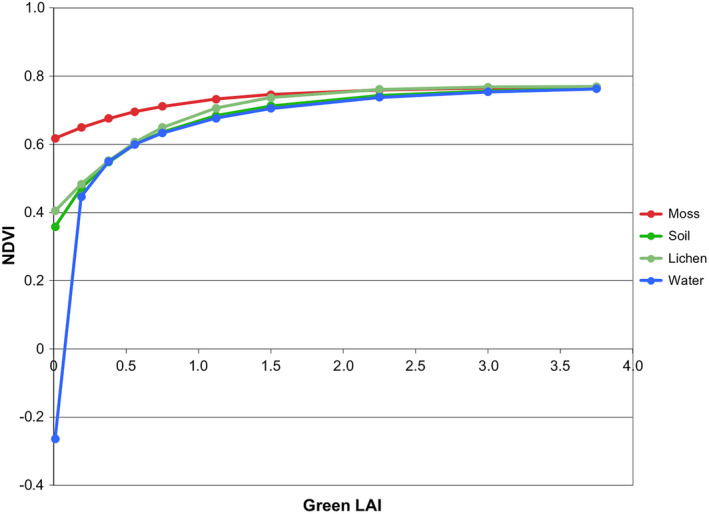
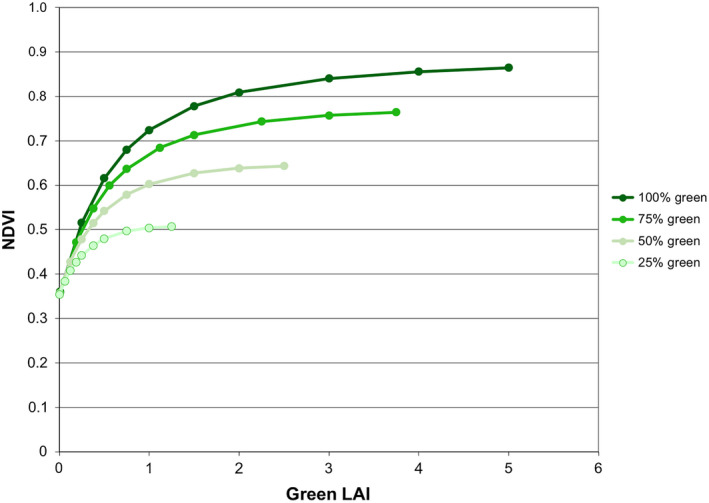
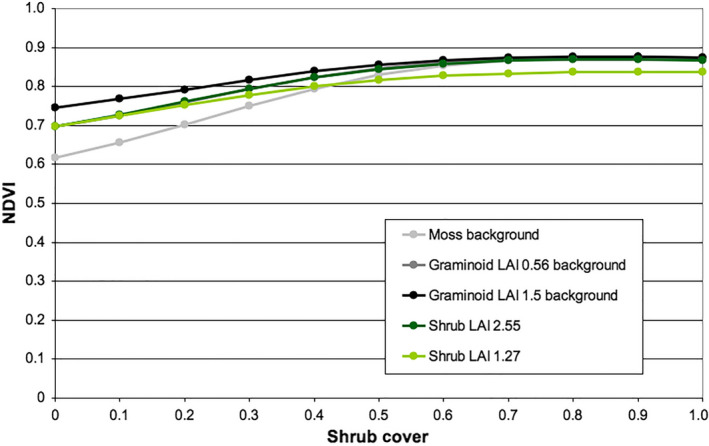
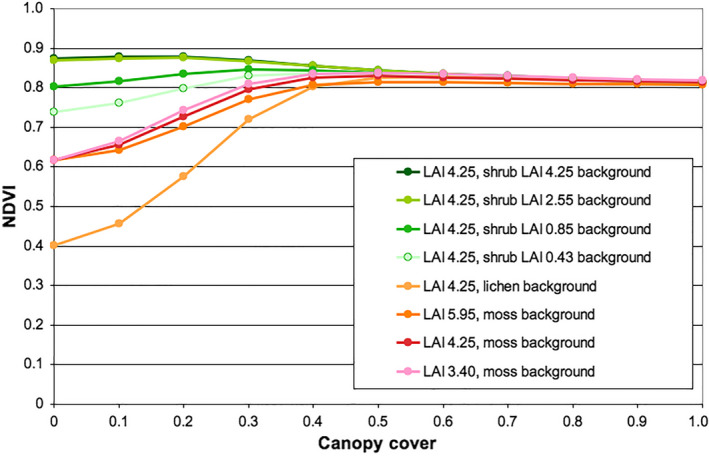
Multiyear trends in Normalized Difference Vegetation Index (NDVI) have been used as metrics of high latitude ecosystem change based on the assumption that NDVI change is associated with ecological change, generally as changes in green vegetation amount (green leaf area index [LAI] or plant cover). Further, no change in NDVI is often interpreted as no change in these variables. Three canopy reflectance models including linear mixture model, the SAIL (Scattering from Arbitrarily Inclined Leaves) model, and the GeoSail model were used to simulate scenarios representing high latitude landscape NDVI responses to changes in LAI and plant cover. The simulations showed inconsistent NDVI responses. Clear increases in NDVI are generally associated with increases in LAI and plant cover. At higher values of LAI, the change in NDVI per unit change in LAI decreases, with very little change in spruce forest NDVI where crown cover is >50% and at the tundra-taiga ecotone with transitions from shrub tundra to spruce woodland. These lower responses may bias the interpretation of greening/browning trends in boreal forests. Variations in water or snow coverage were shown to produce outsized nonbiological NDVI responses. Inconsistencies in NDVI responses exemplify the need for care in the interpretation of NDVI change as a metric of high latitude ecosystem change, and that landscape characteristics in terms of the type of cover and its characteristics, such as the initial plant cover, must be taken into account in evaluating the significance of any observed NDVI trends.

摘要

多年来归一化差异植被指数 (NDVI) 的变化一直被用作高纬度生态系统变化的指标,其假设是 NDVI 的变化与生态变化有关,通常与绿色植被数量的变化(绿叶面积指数 [LAI] 或植物覆盖)有关。此外,NDVI 没有变化通常被解释为这些变量没有变化。三种冠层反射模型,包括线性混合模型、SAIL(任意倾斜叶片散射)模型和 GeoSail 模型,被用来模拟代表高纬度景观 NDVI 对 LAI 和植物覆盖变化的响应场景。模拟结果显示 NDVI 的响应不一致。NDVI 的明显增加通常与 LAI 和植物覆盖的增加有关。在 LAI 较高的情况下,NDVI 的变化量与 LAI 的变化量成反比,云杉林的 NDVI 变化很小,树冠覆盖率 >50%,在苔原-泰加生态过渡带,从灌木苔原向云杉林地过渡。这些较低的响应可能会影响对北方森林绿化/变褐趋势的解释。水或雪覆盖的变化被证明会产生不成比例的非生物 NDVI 响应。NDVI 响应的不一致性说明了在解释 NDVI 变化作为高纬度生态系统变化的指标时需要谨慎,并且必须考虑覆盖类型及其特征(如初始植物覆盖)等景观特征,以评估任何观察到的 NDVI 趋势的重要性。

https://cdn.ncbi.nlm.nih.gov/pmc/blobs/bfc5/9285598/5baade76812a/EAP-31-0-g004.jpg
https://cdn.ncbi.nlm.nih.gov/pmc/blobs/bfc5/9285598/0bc4e5c2c4ee/EAP-31-0-g009.jpg
https://cdn.ncbi.nlm.nih.gov/pmc/blobs/bfc5/9285598/2054d84af96f/EAP-31-0-g003.jpg
https://cdn.ncbi.nlm.nih.gov/pmc/blobs/bfc5/9285598/09e60865fb9a/EAP-31-0-g002.jpg
https://cdn.ncbi.nlm.nih.gov/pmc/blobs/bfc5/9285598/e9ce859c22ce/EAP-31-0-g008.jpg
https://cdn.ncbi.nlm.nih.gov/pmc/blobs/bfc5/9285598/44803afa30f6/EAP-31-0-g007.jpg
https://cdn.ncbi.nlm.nih.gov/pmc/blobs/bfc5/9285598/c52039023118/EAP-31-0-g006.jpg
https://cdn.ncbi.nlm.nih.gov/pmc/blobs/bfc5/9285598/913d444bf6b5/EAP-31-0-g001.jpg
https://cdn.ncbi.nlm.nih.gov/pmc/blobs/bfc5/9285598/e63e7975b696/EAP-31-0-g005.jpg
https://cdn.ncbi.nlm.nih.gov/pmc/blobs/bfc5/9285598/5baade76812a/EAP-31-0-g004.jpg

相似文献

1
Canopy reflectance models illustrate varying NDVI responses to change in high latitude ecosystems.林冠反射率模型说明了高纬度生态系统中 NDVI 对变化的不同响应。
Ecol Appl. 2021 Dec;31(8):e02435. doi: 10.1002/eap.2435. Epub 2021 Aug 26.
2
Greater deciduous shrub abundance extends tundra peak season and increases modeled net CO2 uptake.落叶灌丛丰度增加延长了苔原的旺季,并增加了模拟的净 CO2 吸收量。
Glob Chang Biol. 2015 Jun;21(6):2394-409. doi: 10.1111/gcb.12852. Epub 2015 Mar 6.
3
NDVI changes in the Arctic: Functional significance in the moist acidic tundra of Northern Alaska.北极地区 NDVI 的变化:在阿拉斯加北部湿润酸性冻原的功能意义。
PLoS One. 2023 Apr 28;18(4):e0285030. doi: 10.1371/journal.pone.0285030. eCollection 2023.
4
Confounding effects of snow cover on remotely sensed vegetation indices of evergreen and deciduous trees: An experimental study.积雪对常绿和落叶树木遥感植被指数的混淆影响:一项实验研究。
Glob Chang Biol. 2023 Nov;29(21):6120-6138. doi: 10.1111/gcb.16916. Epub 2023 Aug 17.
5
NDVI as a predictor of canopy arthropod biomass in the Alaskan arctic tundra.归一化植被指数作为阿拉斯加北极苔原冠层节肢动物生物量的预测指标。
Ecol Appl. 2015 Apr;25(3):779-90. doi: 10.1890/14-0632.1.
6
Changes in vegetation in northern Alaska under scenarios of climate change, 2003-2100: implications for climate feedbacks.2003 - 2100年气候变化情景下阿拉斯加北部植被的变化:对气候反馈的影响
Ecol Appl. 2009 Jun;19(4):1022-43. doi: 10.1890/08-0806.1.
7
Determining the K coefficient to leaf area index estimations in a tropical dry forest.测定热带干旱森林叶面积指数估算中的 K 系数。
Int J Biometeorol. 2018 Jul;62(7):1187-1197. doi: 10.1007/s00484-018-1522-6. Epub 2018 Mar 15.
8
Seasonal variations of leaf and canopy properties tracked by ground-based NDVI imagery in a temperate forest.利用地面归一化植被指数图像追踪温带森林的叶片和冠层特性的季节性变化。
Sci Rep. 2017 Apr 28;7(1):1267. doi: 10.1038/s41598-017-01260-y.
9
The response of boreal peatland community composition and NDVI to hydrologic change, warming, and elevated carbon dioxide.北方泥炭地群落组成和 NDVI 对水文变化、变暖以及大气二氧化碳升高的响应。
Glob Chang Biol. 2019 Jan;25(1):93-107. doi: 10.1111/gcb.14465. Epub 2018 Oct 27.
10
The give and take of Arctic greening: differential responses of the carbon sink-to-source threshold to light and temperature in tussock tundra may be influenced by vegetation cover.北极绿化的得失:丛生苔原碳汇-源阈值对光照和温度的差异响应可能受到植被覆盖的影响。
Commun Biol. 2024 Aug 6;7(1):950. doi: 10.1038/s42003-024-06600-z.

引用本文的文献

1
Satellite observations document trends consistent with a boreal forest biome shift.卫星观测记录到与北方森林生物群落转变相一致的趋势。
Glob Chang Biol. 2022 May;28(10):3275-3292. doi: 10.1111/gcb.16121. Epub 2022 Feb 24.

本文引用的文献

1
A spectral analysis of common boreal ground lichen species.常见北方地衣物种的光谱分析
Remote Sens Environ. 2020 Sep 15;247:111955. doi: 10.1016/j.rse.2020.111955.
2
Satellite-based decadal change assessments of pan-Arctic environments.基于卫星的泛北极环境年代际变化评估。
Ambio. 2020 Mar;49(3):820-832. doi: 10.1007/s13280-019-01249-z. Epub 2019 Nov 4.
3
Velocity of change in vegetation productivity over northern high latitudes.北方高纬度地区植被生产力变化的速度。
Nat Ecol Evol. 2017 Nov;1(11):1649-1654. doi: 10.1038/s41559-017-0328-y. Epub 2017 Oct 2.
4
Vegetation productivity patterns at high northern latitudes: a multi-sensor satellite data assessment.高北纬地区植被生产力格局:多传感器卫星数据评估。
Glob Chang Biol. 2014 Oct;20(10):3147-58. doi: 10.1111/gcb.12647. Epub 2014 Jul 21.
5
Vegetation greening in the Canadian Arctic related to decadal warming.加拿大北极地区植被绿化与年代际变暖有关。
J Environ Monit. 2009 Dec;11(12):2231-8. doi: 10.1039/b911677j. Epub 2009 Sep 28.
6
Modeling the effect of photosynthetic vegetation properties on the NDVI--LAI relationship.
Ecology. 2006 Nov;87(11):2765-72. doi: 10.1890/0012-9658(2006)87[2765:mteopv]2.0.co;2.
7
Satellite-observed photosynthetic trends across boreal North America associated with climate and fire disturbance.卫星观测到的北美北方地区与气候和火灾干扰相关的光合趋势。
Proc Natl Acad Sci U S A. 2005 Sep 20;102(38):13521-5. doi: 10.1073/pnas.0506179102. Epub 2005 Sep 7.