Division of Nephrology, Department of Medicine, Stanford University School of Medicine, Palo Alto, California.
Division of Nephrology, Department of Medicine, University of Michigan, Ann Arbor.
JAMA Netw Open. 2022 Mar 1;5(3):e221847. doi: 10.1001/jamanetworkopen.2022.1847.
While recent policy reforms aim to improve access to kidney transplantation for patients with end-stage kidney disease, the cost implications of kidney waiting list expansion are not well understood. The Organ Acquisition Cost Center (OACC) is the mechanism by which Medicare reimburses kidney transplantation programs, at cost, for costs attributable to kidney transplantation evaluation and waiting list management, but these costs have not been well described to date.
To describe temporal trends in mean OACC costs per kidney transplantation and to identify factors most associated with cost.
DESIGN, SETTING, AND PARTICIPANTS: This economic evaluation included all kidney transplantation waiting list candidates and recipients in the United States from 2012 to 2017. A population-based study of cost center reports was conducted using data from all Center of Medicare & Medicaid-certified transplantation hospitals. Data analysis was conducted from June to August 2021.
Year, local price index, transplantation and waiting list volume of transplantation program, and comorbidity burden.
Mean OACC costs per kidney transplantation.
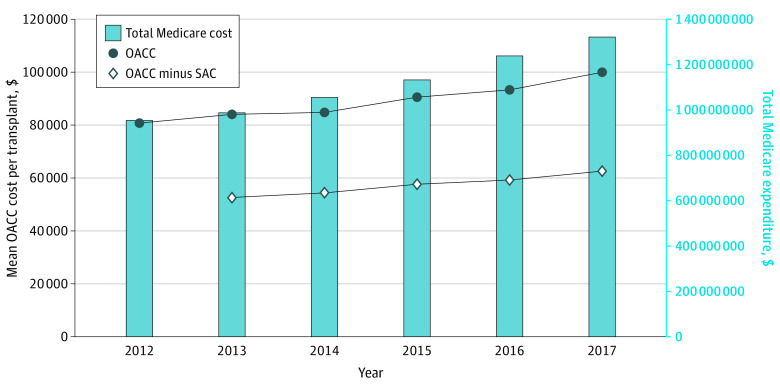
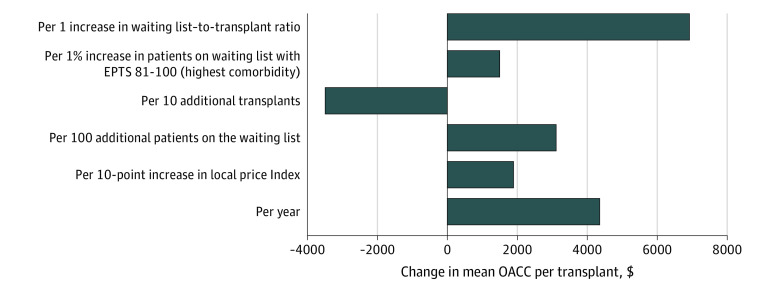
In 1335 hospital-years from 2012 through 2017, Medicare's share of OACC costs increased from $0.95 billion in 2012 to $1.32 billion in 2017 (3.7% of total Medicare End-Stage Renal Disease program expenditure). Median (IQR) OACC costs per transplantation increased from $81 000 ($66 000 to $103 000) in 2012 to $100 000 ($82 000 to $125 000) in 2017. Kidney organ procurement costs contributed to 36% of mean OACC costs per transplantation throughout the study period. During the study period, transplantation hospitals experienced increases in kidney waiting list volume, kidney waiting list active volume, kidney transplantation volume, and comorbidity burden. For a median-sized transplantation program, mean OACC costs per transplantation decreased with more transplants (-$3500 [95% CI, -$4300 to -$2700] per 10 transplants; P < .001) and increased with year ($4400 [95% CI, $3500 to $5300] per year; P < .001), local price index ($1900 [95% CI, $200 to $3700] per 10-point increase; P = .03), patients listed active on the waiting list ($3100 [95% CI, $1700 to $4600] per 100 patients; P < .001), and patients on the waiting list with high comorbidities ($1500 [9% CI, $600 to $2500] per 1% increase in proportion of waitlisted patients with the highest comorbidity score; P = .002).
In this study, OACC costs increased at 4% per year from 2012 to 2017 and were not solely attributable to the cost of organ procurement. Expanding the waiting list will likely contribute to further increases in the mean OACC costs per transplantation and substantially increase Medicare liability.
虽然最近的政策改革旨在为终末期肾病患者改善接受肾移植的机会,但对于肾等待名单扩大的成本影响尚不清楚。器官获取成本中心 (OACC) 是医疗保险按成本报销肾移植项目的机制,用于肾移植评估和等待名单管理的费用,但迄今为止,这些费用尚未得到很好的描述。
描述每例肾移植的 OACC 成本的时间趋势,并确定与成本最相关的因素。
设计、地点和参与者:本经济评估包括 2012 年至 2017 年期间美国所有的肾移植等待名单候选人和受者。对来自所有经医疗保险和医疗补助认证的移植医院的所有中心的成本中心报告进行了基于人群的研究。数据分析于 2021 年 6 月至 8 月进行。
年份、当地物价指数、移植和等待名单的移植项目数量、以及合并症负担。
每例肾移植的 OACC 成本平均值。
在 2012 年至 2017 年的 1335 个医院年度中,医疗保险在 OACC 成本中的份额从 2012 年的 95 亿美元增加到 2017 年的 132 亿美元(占医疗保险终末期肾病计划总支出的 3.7%)。中位数(IQR)每例移植的 OACC 成本从 2012 年的 81000 美元(66000 美元至 103000 美元)增加到 2017 年的 100000 美元(82000 美元至 125000 美元)。在整个研究期间,器官获取成本占每例移植 OACC 成本平均值的 36%。在研究期间,移植医院的肾等待名单数量、肾等待名单活跃数量、肾移植数量和合并症负担都有所增加。对于一个中等规模的移植项目,每例移植的 OACC 成本随着移植数量的增加而降低(每 10 例移植减少 3500 美元[95%CI,-4300 美元至-2700 美元];P < .001),随着年份的增加而增加(每年增加 4400 美元[95%CI,3500 美元至 5300 美元];P < .001),当地物价指数(每增加 10 个点增加 1900 美元[95%CI,200 美元至 3700 美元];P = .03),等待名单上活跃的患者(每增加 100 名患者增加 3100 美元[95%CI,1700 美元至 4600 美元];P < .001),以及等待名单上合并症较高的患者(每增加 1%等待名单上合并症评分最高的患者比例增加 1500 美元[95%CI,600 美元至 2500 美元];P = .002)。
在这项研究中,OACC 成本从 2012 年到 2017 年每年增加 4%,并且不仅仅是由于器官采购的成本。扩大等待名单将可能导致每例移植的 OACC 成本进一步增加,并大幅增加医疗保险的负债。