Division of Nephrology, Dalhousie University, Halifax, Nova Scotia, Canada.
Division of Nephrology, Centre de Recherche du CHUM, Montreal, Quebec, Canada.
Kidney360. 2021 May 27;2(8):1287-1295. doi: 10.34067/KID.0001892021. eCollection 2021 Aug 26.
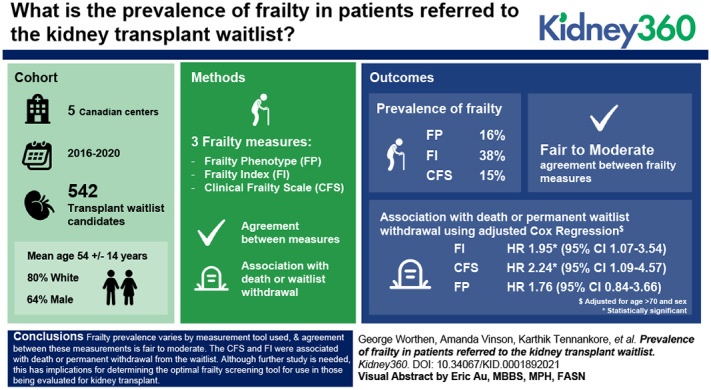
Comparisons between frailty assessment tools for waitlist candidates are a recognized priority area for kidney transplantation. We compared the prevalence of frailty using three established tools in a cohort of waitlist candidates.
Waitlist candidates were prospectively enrolled from 2016 to 2020 across five centers. Frailty was measured using the Frailty Phenotype (FP), a 37-variable frailty index (FI), and the Clinical Frailty Scale (CFS). The FI and CFS were dichotomized using established cutoffs. Agreement was compared using coefficients. Area under the receiver operating characteristic (ROC) curves were generated to compare the FI and CFS (treated as continuous measures) with the FP. Unadjusted associations between each frailty measure and time to death or waitlist withdrawal were determined using an unadjusted Cox proportional hazards model.
Of 542 enrolled patients, 64% were male, 80% were White, and the mean age was 54±14 years. The prevalence of frailty by the FP was 16%. The mean FI score was 0.23±0.14, and the prevalence of frailty was 38% (score of ≥0.25). The median CFS score was three (IQR, 2-3), and the prevalence was 15% (score of ≥4). The values comparing the FP with the FI (0.44) and CFS (0.27) showed fair to moderate agreement. The area under the ROC curves for the FP and FI/CFS were 0.86 (good) and 0.69 (poor), respectively. Frailty by the CFS (HR, 2.10; 95% CI, 1.04 to 4.24) and FI (HR, 1.79; 95% CI, 1.00 to 3.21) was associated with death or permanent withdrawal. The association between frailty by the FP and death/withdrawal was not statistically significant (HR, 1.78; 95% CI, 0.79 to 3.71).
Frailty prevalence varies by the measurement tool used, and agreement between these measurements is fair to moderate. This has implications for determining the optimal frailty screening tool for use in those being evaluated for kidney transplant.
对等待肾移植的候选者进行虚弱评估工具的比较是肾移植领域的一个公认的优先事项。我们在一组等待名单的候选者中比较了使用三种已建立的工具评估虚弱的流行率。
2016 年至 2020 年,我们在五个中心前瞻性地招募了等待名单的候选者。使用虚弱表型(FP)、37 变量虚弱指数(FI)和临床虚弱量表(CFS)来测量虚弱。FI 和 CFS 使用既定的截断值进行二分法。使用 系数比较一致性。生成接收者操作特征(ROC)曲线下面积,以比较 FI 和 CFS(视为连续测量)与 FP。使用未调整的 Cox 比例风险模型确定每个虚弱测量值与死亡或等待名单退出之间的未调整关联。
在纳入的 542 名患者中,64%为男性,80%为白人,平均年龄为 54±14 岁。FP 评估的虚弱患病率为 16%。FI 平均得分为 0.23±0.14,虚弱患病率为 38%(得分≥0.25)。CFS 中位数为 3(IQR,2-3),患病率为 15%(得分≥4)。FP 与 FI(0.44)和 CFS(0.27)的 值显示出适度到中度的一致性。FP 和 FI/CFS 的 ROC 曲线下面积分别为 0.86(良好)和 0.69(差)。CFS 评估的虚弱(HR,2.10;95%CI,1.04 至 4.24)和 FI(HR,1.79;95%CI,1.00 至 3.21)与死亡或永久性退出相关。FP 评估的虚弱与死亡/退出之间的关联没有统计学意义(HR,1.78;95%CI,0.79 至 3.71)。
虚弱的流行率因使用的测量工具而异,这些测量之间的一致性是适度到中度的。这对确定用于评估肾移植候选者的最佳虚弱筛选工具具有影响。