Center for Research on Nutrition and Health, National Institute of Public Health, Cuernavaca, Morelos, Mexico.
PLoS Med. 2022 Apr 20;19(4):e1003968. doi: 10.1371/journal.pmed.1003968. eCollection 2022 Apr.
Different nutrient profiles (NPs) have been developed in Latin America to assess the nutritional quality of packaged food products. Recently, the Mexican NP was developed as part of the new warning label regulation implemented in 2020, considering 5 warning octagons (calories, sugar, sodium, saturated fats, and trans fats) and 2 warning rectangles (caffeine and non-nutritive sweeteners). The objective of this cross-sectional study was to evaluate the Mexican NP and other NPs proposed or used in Latin America against the Pan American Health Organization (PAHO) model.
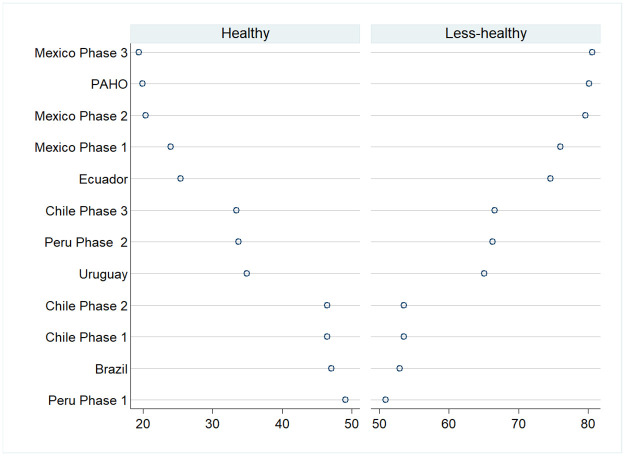
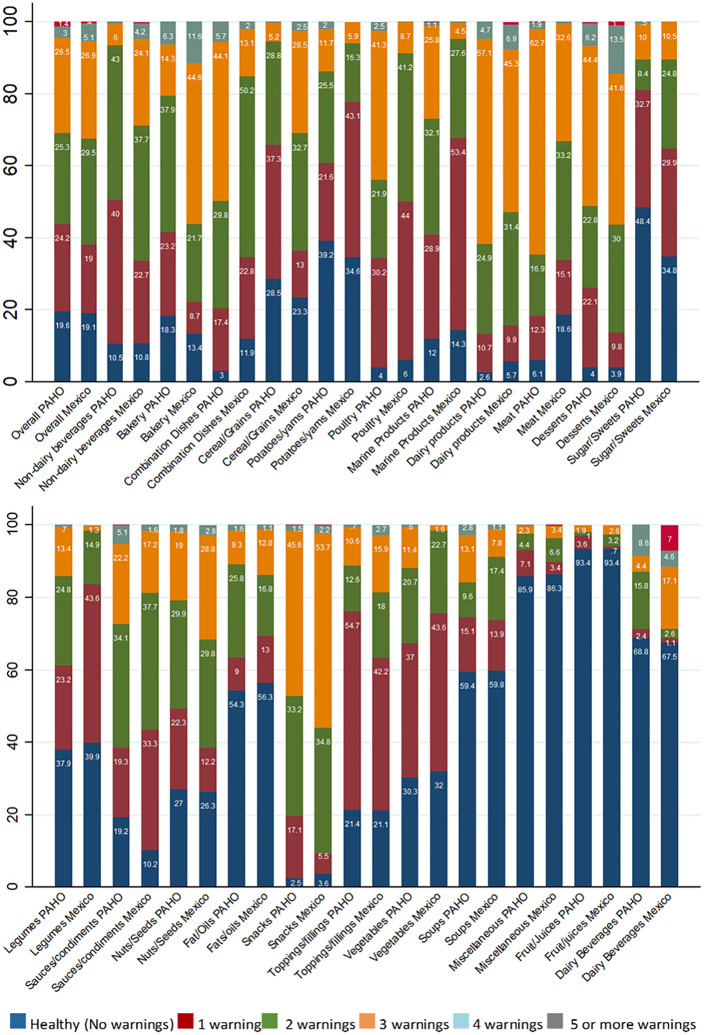
Nutrition content data of 38,872 packaged food products available in the Mexican market were collected in 2016 and 2017. The evaluation of the Mexican NP, including its 3 implementation phases of increasing stringency (2020, 2023, and 2025), was conducted by comparing the percentage of products classified as "healthy" (without warnings) or "less healthy" (with 1 or more warnings), as well as the number and type of warnings assigned to food products, against the PAHO NP. Using the calibration method, we compared the classifications produced by the PAHO model against those produced by the NP models of Ecuador, Chile (3 phases), Peru (2 phases), Uruguay, and Brazil. Kappa coefficients and Pearson correlations were estimated, and proportion tests were performed. We found that the 3 implementation phases of the Mexican NP had near to perfect agreement in the classification of healthy foods (Mexico NP models: 19.1% to 23.8%; PAHO model: 19.7%) and a strong correlation (>91.9%) with the PAHO model. Other NPs with high agreement with the PAHO model were the Ecuador (89.8%), Uruguay (82.5%), Chile Phase 3 (82.3%), and Peru Phase 2 (84.2%) NPs. In contrast, the Peru Phase 1, Brazil, and Chile Phase 1 NP models had the highest percentage of foods classified as healthy (49.2%, 47.1%, and 46.5%, respectively) and the lowest agreement with the PAHO model (69.9%, 69.3%, and 73%, respectively). Study limitations include that warnings considered by the Mexican NP models were evaluated as if all the warnings were octagon seals, while 2 out of the 7 were rectangular warnings (caffeine and non-nutritive sweeteners), and that our data are limited by the quality of the information reported in the list of ingredients and the nutrition facts table of the products.
The 3 implementation phases of the Mexican NP were useful to identify healthy food products. In contrast, the Peru Phase 1, Brazil, and Chile Phase 1 NP models may have limited usefulness for the classification of foods according to the content of ingredients of concern. The results of this study may inform countries seeking to adapt and evaluate existing NP models for use in population-specific applications.
为了评估包装食品的营养质量,拉丁美洲开发了不同的营养概况 (NPs)。最近,墨西哥 NP 作为 2020 年实施的新警告标签法规的一部分被开发出来,考虑了 5 个警告八角形(卡路里、糖、钠、饱和脂肪和反式脂肪)和 2 个警告矩形(咖啡因和非营养性甜味剂)。本横断面研究的目的是评估墨西哥 NP 以及拉丁美洲提出或使用的其他 NPs 与泛美卫生组织 (PAHO) 模型的对比。
2016 年至 2017 年,收集了墨西哥市场上 38872 种包装食品的营养成分数据。通过比较被分类为“健康”(无警告)或“较不健康”(有 1 个或多个警告)的产品的百分比,以及分配给食品的警告数量和类型,对墨西哥 NP 的 3 个实施阶段(2020 年、2023 年和 2025 年)进行评估,这与 PAHO NP 进行了比较。使用校准方法,我们将 PAHO 模型产生的分类与厄瓜多尔、智利(3 个阶段)、秘鲁(2 个阶段)、乌拉圭和巴西的 NP 模型进行了比较。估计了 Kappa 系数和 Pearson 相关性,并进行了比例检验。我们发现,墨西哥 NP 的 3 个实施阶段在健康食品的分类上具有近乎完美的一致性(墨西哥 NP 模型:19.1%至 23.8%;PAHO 模型:19.7%),并且与 PAHO 模型具有很强的相关性(>91.9%)。与 PAHO 模型高度一致的其他 NPs 是厄瓜多尔(89.8%)、乌拉圭(82.5%)、智利第 3 阶段(82.3%)和秘鲁第 2 阶段(84.2%)NP。相比之下,秘鲁第 1 阶段、巴西和智利第 1 阶段 NP 模型具有最高百分比的被分类为健康的食品(分别为 49.2%、47.1%和 46.5%),与 PAHO 模型的一致性最低(分别为 69.9%、69.3%和 73%)。研究的局限性包括,墨西哥 NP 模型考虑的警告被评估为所有警告都是八角形印章,而实际上有 7 个警告中有 2 个是矩形警告(咖啡因和非营养性甜味剂),并且我们的数据受到产品成分清单和营养成分表中报告的信息质量的限制。
墨西哥 NP 的 3 个实施阶段有助于识别健康食品。相比之下,秘鲁第 1 阶段、巴西和智利第 1 阶段 NP 模型可能在根据关注成分的食品分类方面的应用有限。本研究的结果可能为希望适应和评估现有 NP 模型以用于特定人群应用的国家提供信息。