Department of Geography, Yarmouk University, Irbid 21163, Jordan.
Physical Geography, Institute of Geographical Sciences, Freie Universidad Berlin, Malteserstraße 74-100, 12449 Berlin, Germany.
Sensors (Basel). 2022 May 23;22(10):3931. doi: 10.3390/s22103931.
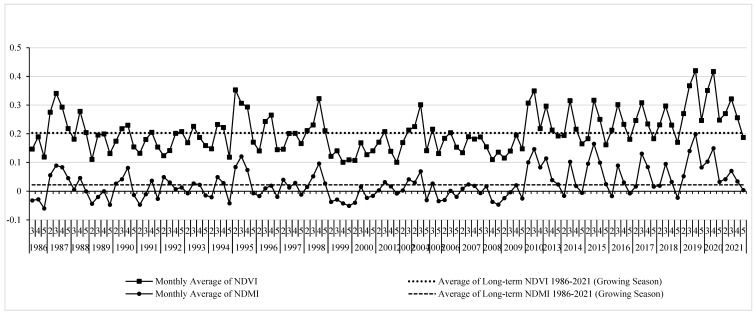
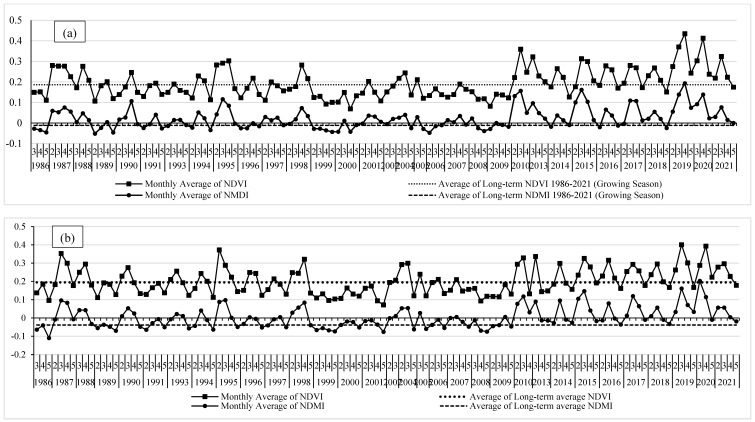
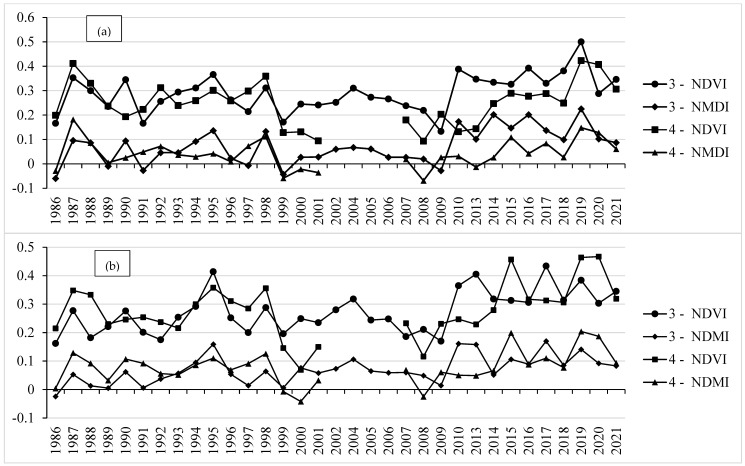
In this study, we implemented a remote sensing-based approach for monitoring abandoned agricultural land in the Yarmouk River Basin (YRB) in Southern Syria and Northern Jordan during the Syrian crisis. A time series analysis for the Normalized Difference Vegetation Index (NDVI) and Normalized Difference Moisture Index (NDMI) was conducted using 1650 multi-temporal images from Landsat-5 and Landsat-8 between 1986 and 2021. We analyzed the agricultural phenological profiles and investigated the impact of the Syrian crisis on agricultural activities in YRB. The analysis was performed using JavaScript commands in Google Earth Engine. The results confirmed the impact of the Syrian crisis on agricultural land use. The phenological characteristics of NDVI and NDMI during the crisis (2013-2021) were compared to the phenological profiles for the period before the crisis (1986-2010). The NDVI and NDMI profiles had smooth, bell-shaped, and single beak NDVI and NDMI values during the period of crisis in comparison to those irregular phenological profiles for the period before the crisis or during the de-escalation/reconciliation period in the study area. The maximum average NDVI and NDMI values was found in March during the crisis, indicating the progress of natural vegetation and fallow land, while they fluctuated between March and April before the crisis or during the de-escalation/reconciliation period, indicating regular agricultural and cultivation practices.
在本研究中,我们实施了一种基于遥感的方法,用于监测叙利亚南部和约旦北部的幼发拉底河流域(YRB)在叙利亚危机期间的废弃农田。使用 1986 年至 2021 年期间来自 Landsat-5 和 Landsat-8 的 1650 多时间图像,对归一化差异植被指数(NDVI)和归一化差异水分指数(NDMI)进行了时间序列分析。我们分析了农业物候特征,并调查了叙利亚危机对 YRB 农业活动的影响。该分析是在 Google Earth Engine 中使用 JavaScript 命令进行的。结果证实了叙利亚危机对农业土地利用的影响。与危机前时期(1986-2010 年)的物候特征相比,比较了危机期间(2013-2021 年)NDVI 和 NDMI 的物候特征。与危机前时期或研究区缓和/和解期间的不规则物候特征相比,NDVI 和 NDMI 曲线在危机期间具有平滑、钟形和单峰 NDVI 和 NDMI 值。最大平均 NDVI 和 NDMI 值出现在危机期间的 3 月,表明自然植被和休耕地的进展,而在危机前或缓和/和解期间,它们在 3 月和 4 月之间波动,表明常规的农业和种植实践。