Kumar Atul, Chen Yasheng, Corbin Aaron, Hamzehloo Ali, Abedini Amin, Vardar Zeynep, Carey Grace, Bhatia Kunal, Heitsch Laura, Derakhshan Jamal J, Lee Jin-Moo, Dhar Rajat
Department of Neurology, Washington University in St. Louis School of Medicine, Saint Louis, MO, United States.
Saint Louis University School of Medicine, Saint Louis, MO, United States.
Front Neurol. 2022 Jun 27;13:898728. doi: 10.3389/fneur.2022.898728. eCollection 2022.
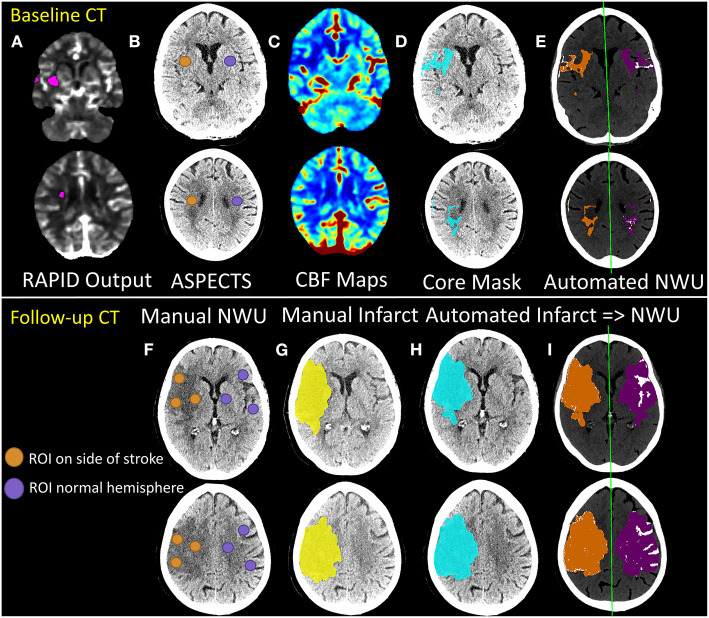
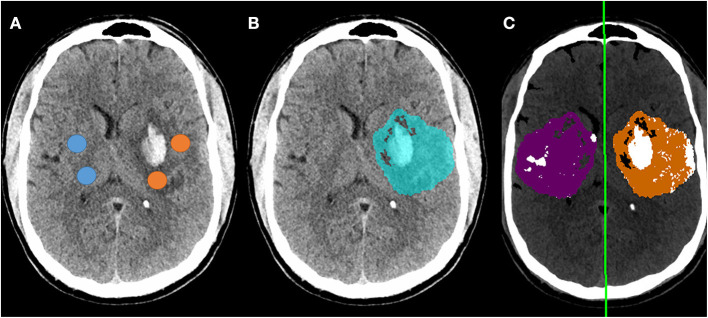
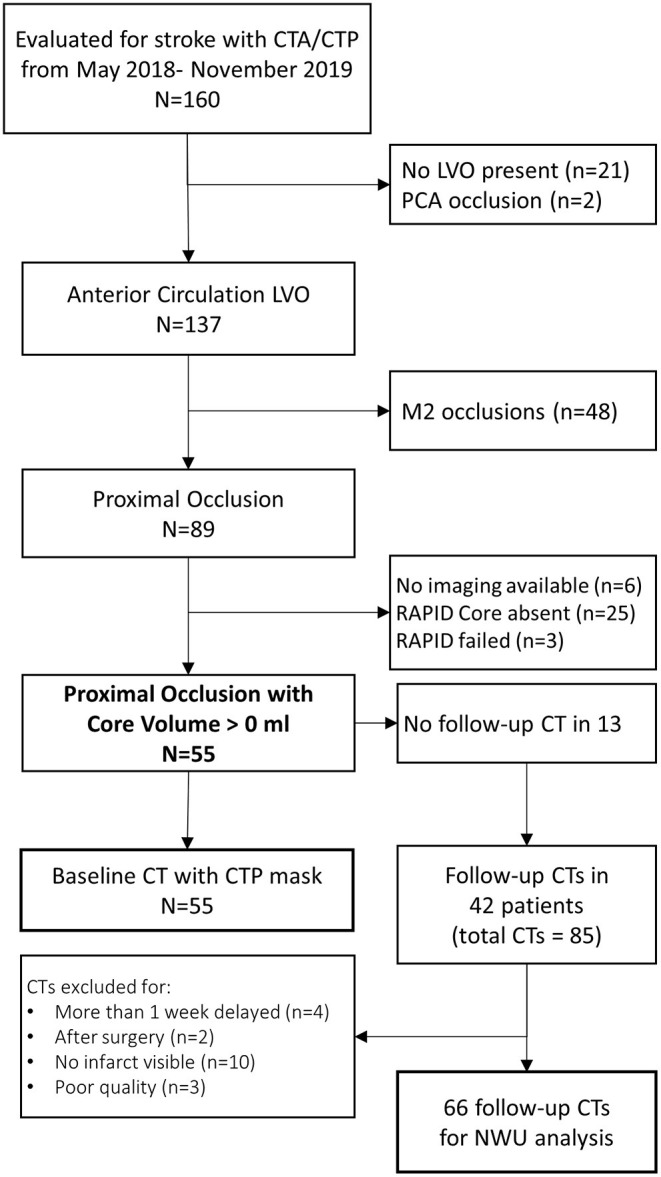
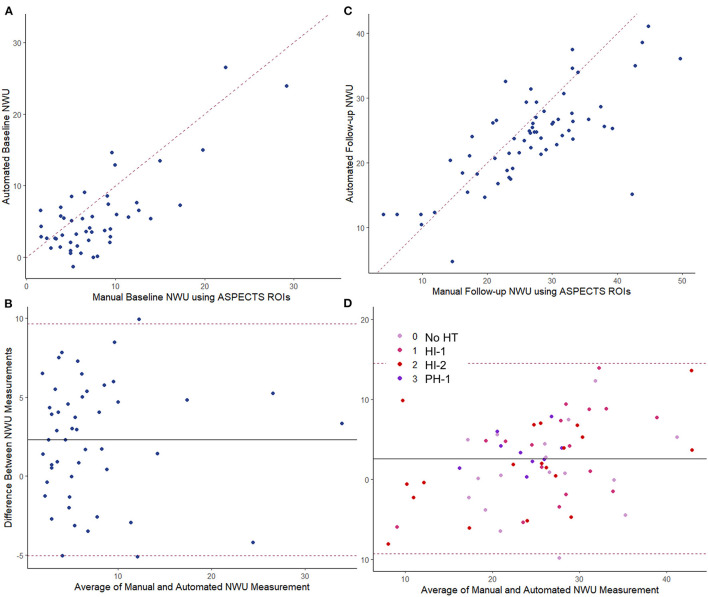
Quantifying the extent and evolution of cerebral edema developing after stroke is an important but challenging goal. Lesional net water uptake (NWU) is a promising CT-based biomarker of edema, but its measurement requires manually delineating infarcted tissue and mirrored regions in the contralateral hemisphere. We implement an imaging pipeline capable of automatically segmenting the infarct region and calculating NWU from both baseline and follow-up CTs of large-vessel occlusion (LVO) patients. Infarct core is extracted from CT perfusion images using a deconvolution algorithm while infarcts on follow-up CTs were segmented from non-contrast CT (NCCT) using a deep-learning algorithm. These infarct masks were flipped along the brain midline to generate mirrored regions in the contralateral hemisphere of NCCT; NWU was calculated as one minus the ratio of densities between regions, removing voxels segmented as CSF and with HU outside thresholds of 20-80 (normal hemisphere and baseline CT) and 0-40 (infarct region on follow-up). Automated results were compared with those obtained using manually-drawn infarcts and an ASPECTS region-of-interest based method that samples densities within the infarct and normal hemisphere, using intraclass correlation coefficient (ρ). This was tested on serial CTs from 55 patients with anterior circulation LVO (including 66 follow-up CTs). Baseline NWU using automated core was 4.3% (IQR 2.6-7.3) and correlated with manual measurement (ρ = 0.80, < 0.0001) and ASPECTS ( = -0.60, = 0.0001). Automatically segmented infarct volumes (median 110-ml) correlated to manually-drawn volumes (ρ = 0.96, < 0.0001) with median Dice similarity coefficient of 0.83 (IQR 0.72-0.90). Automated NWU was 24.6% (IQR 20-27) and highly correlated to NWU from manually-drawn infarcts (ρ = 0.98) and the sampling-based method (ρ = 0.68, both < 0.0001). We conclude that this automated imaging pipeline is able to accurately quantify region of infarction and NWU from serial CTs and could be leveraged to study the evolution and impact of edema in large cohorts of stroke patients.
量化中风后发生的脑水肿的程度和演变是一个重要但具有挑战性的目标。病变净水摄取量(NWU)是一种很有前景的基于CT的水肿生物标志物,但其测量需要手动勾勒梗死组织和对侧半球的镜像区域。我们实现了一种成像流程,能够自动分割梗死区域,并根据大血管闭塞(LVO)患者的基线和随访CT计算NWU。使用去卷积算法从CT灌注图像中提取梗死核心,而使用深度学习算法从非增强CT(NCCT)中分割随访CT上的梗死灶。将这些梗死灶掩码沿脑中线翻转,以在NCCT的对侧半球生成镜像区域;NWU计算为区域间密度比的倒数,去除分割为脑脊液且HU值超出20 - 80(正常半球和基线CT)以及0 - 40(随访时的梗死区域)阈值的体素。将自动结果与使用手动绘制梗死灶以及基于ASPECTS感兴趣区域的方法(该方法对梗死灶和正常半球内的密度进行采样)获得的结果进行比较,使用组内相关系数(ρ)。在55例前循环LVO患者的系列CT(包括6次随访CT)上进行了测试。使用自动核心计算的基线NWU为4.3%(四分位距2.6 - 7.3),与手动测量相关(ρ = 0.80,< 0.0001)且与ASPECTS相关( = -0.60, = 0.0001)。自动分割的梗死体积(中位数110 - ml)与手动绘制的体积相关(ρ = 0.96,< 0.0001),中位数骰子相似系数为0.83(四分位距0.72 - 0.90)。自动计算的NWU为24.6%(四分位距20 - 27),与手动绘制梗死灶计算的NWU高度相关(ρ = 0.98)以及与基于采样的方法高度相关(ρ = 0.68,两者均< 0.0001)。我们得出结论,这种自动成像流程能够从系列CT中准确量化梗死区域和NWU,并可用于研究大量中风患者群体中水肿的演变和影响。