• 文献检索
  • 文档翻译
  • 深度研究
  • 学术资讯
  • Suppr Zotero 插件Zotero 插件
  • 邀请有礼
  • 套餐&价格
  • 历史记录
应用&插件
Suppr Zotero 插件Zotero 插件浏览器插件Mac 客户端Windows 客户端微信小程序
定价
高级版会员购买积分包购买API积分包
服务
文献检索文档翻译深度研究API 文档MCP 服务
关于我们
关于 Suppr公司介绍联系我们用户协议隐私条款
关注我们

Suppr 超能文献

核心技术专利:CN118964589B侵权必究
粤ICP备2023148730 号-1Suppr @ 2026

文献检索

告别复杂PubMed语法,用中文像聊天一样搜索,搜遍4000万医学文献。AI智能推荐,让科研检索更轻松。

立即免费搜索

文件翻译

保留排版,准确专业,支持PDF/Word/PPT等文件格式,支持 12+语言互译。

免费翻译文档

深度研究

AI帮你快速写综述,25分钟生成高质量综述,智能提取关键信息,辅助科研写作。

立即免费体验

复合视图:一种基于网络的可视化工具。

CompositeView: A Network-Based Visualization Tool.

作者信息

Allegri Stephen A, McCoy Kevin, Mitchell Cassie S

机构信息

Laboratory for Pathology Dynamics, Georgia Institute of Technology and Emory University, Atlanta, GA 30332, USA.

Department of Biomedical Engineering, Georgia Institute of Technology and Emory University, Atlanta, GA 30332, USA.

出版信息

Big Data Cogn Comput. 2022 Jun;6(2). doi: 10.3390/bdcc6020066. Epub 2022 Jun 14.

DOI:10.3390/bdcc6020066
PMID:35847767
原文链接:https://pmc.ncbi.nlm.nih.gov/articles/PMC9281616/
Abstract

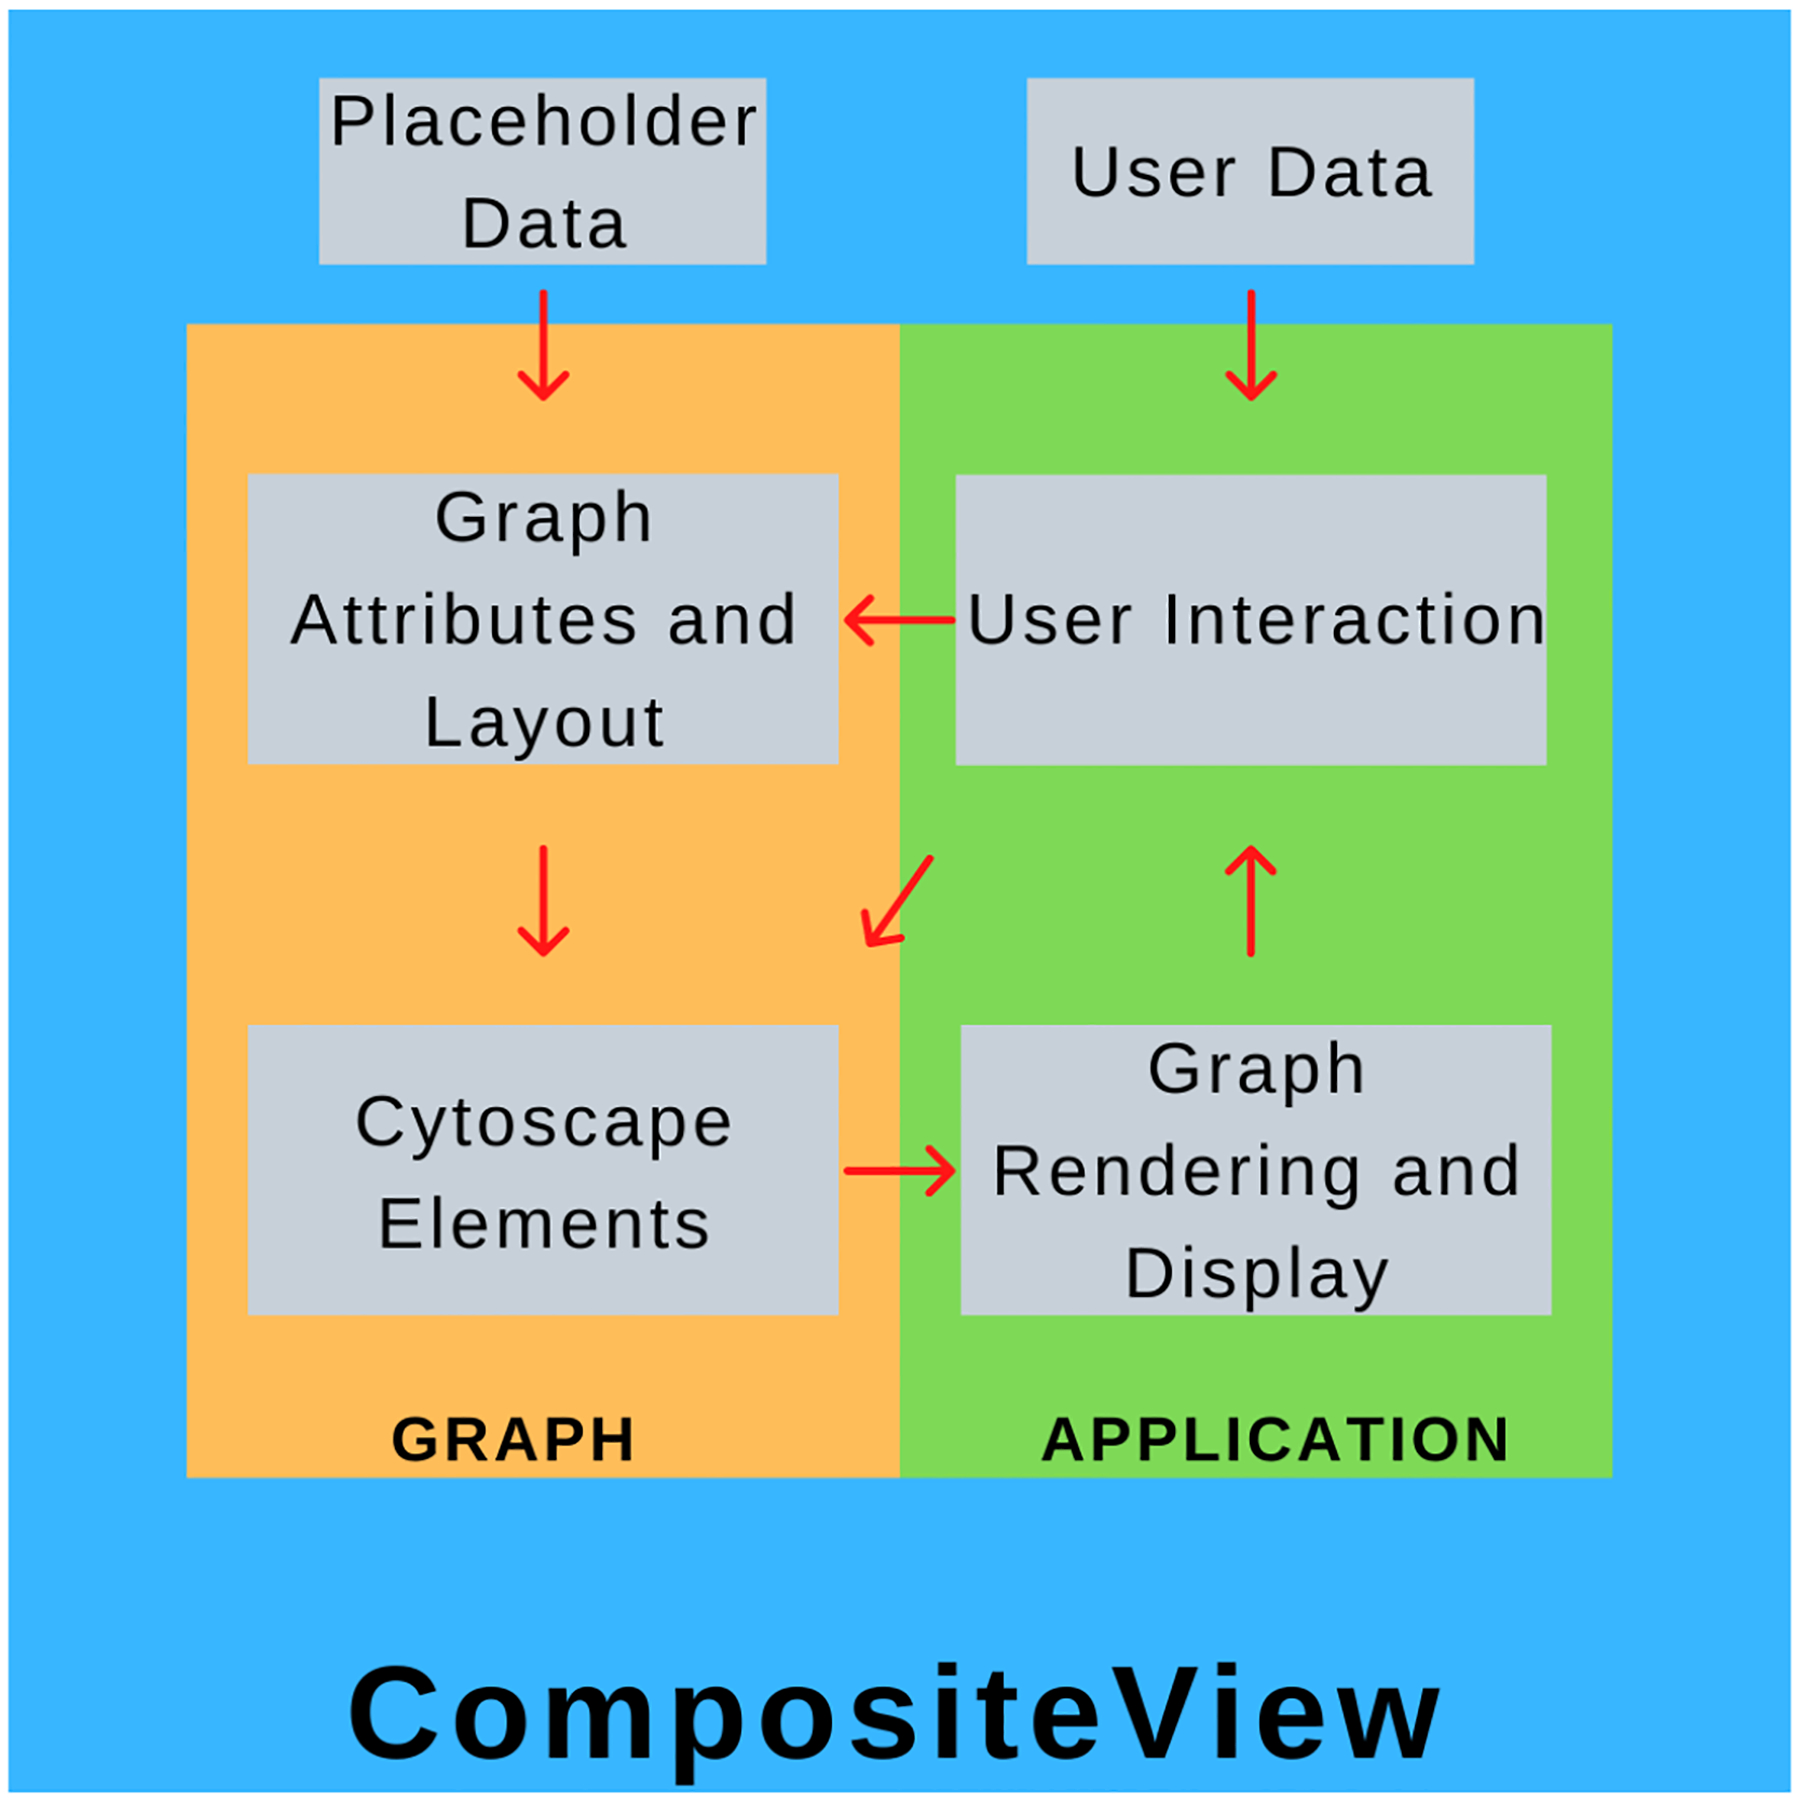
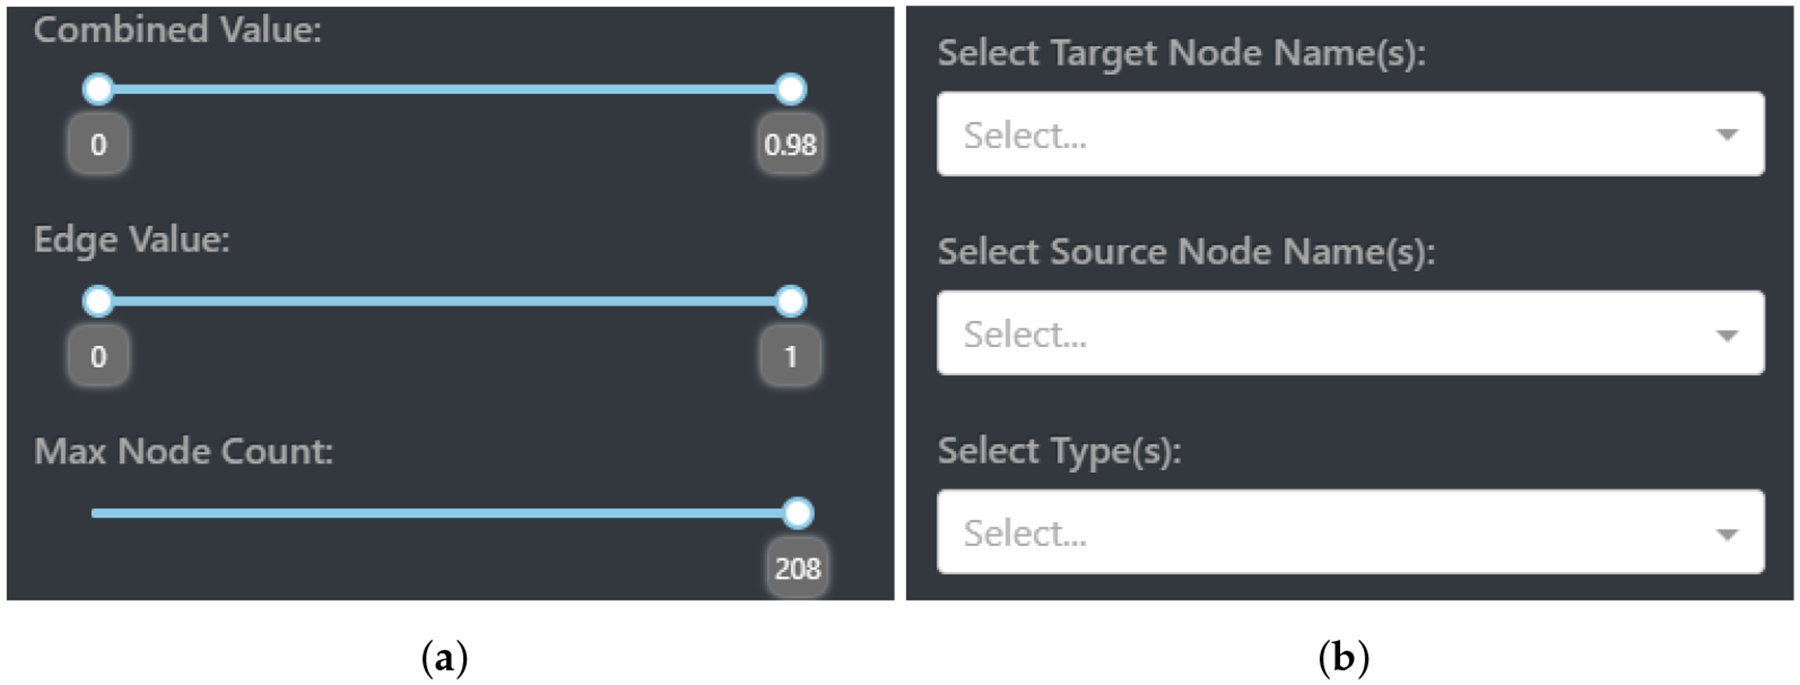
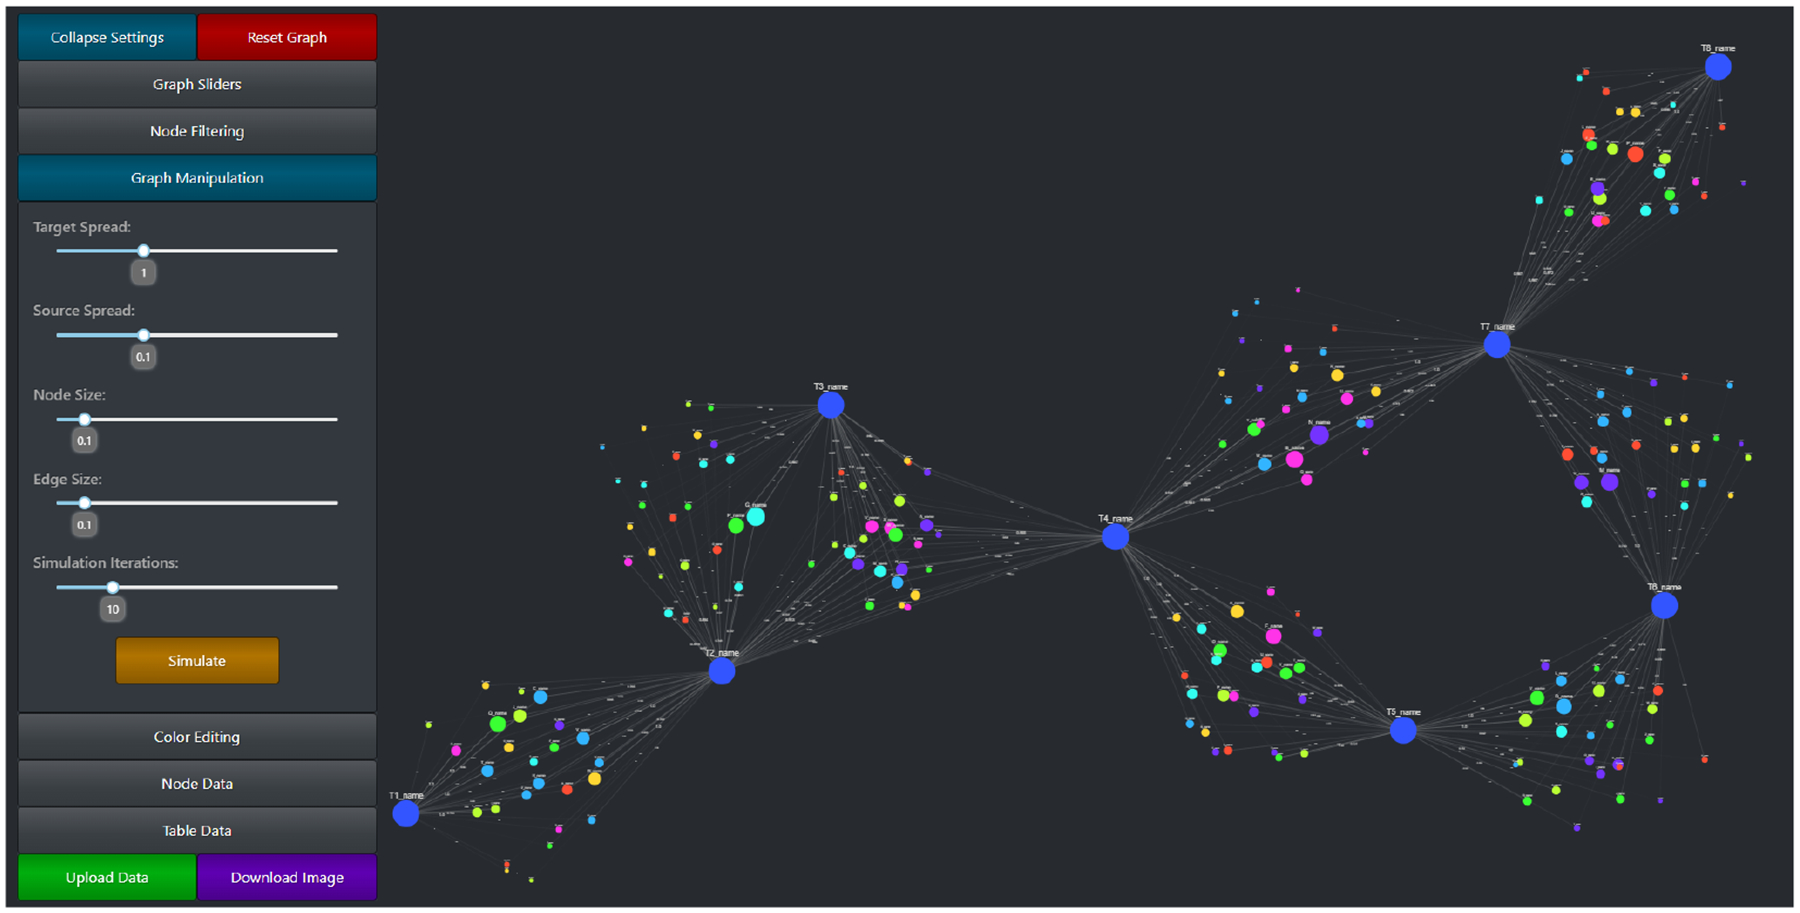
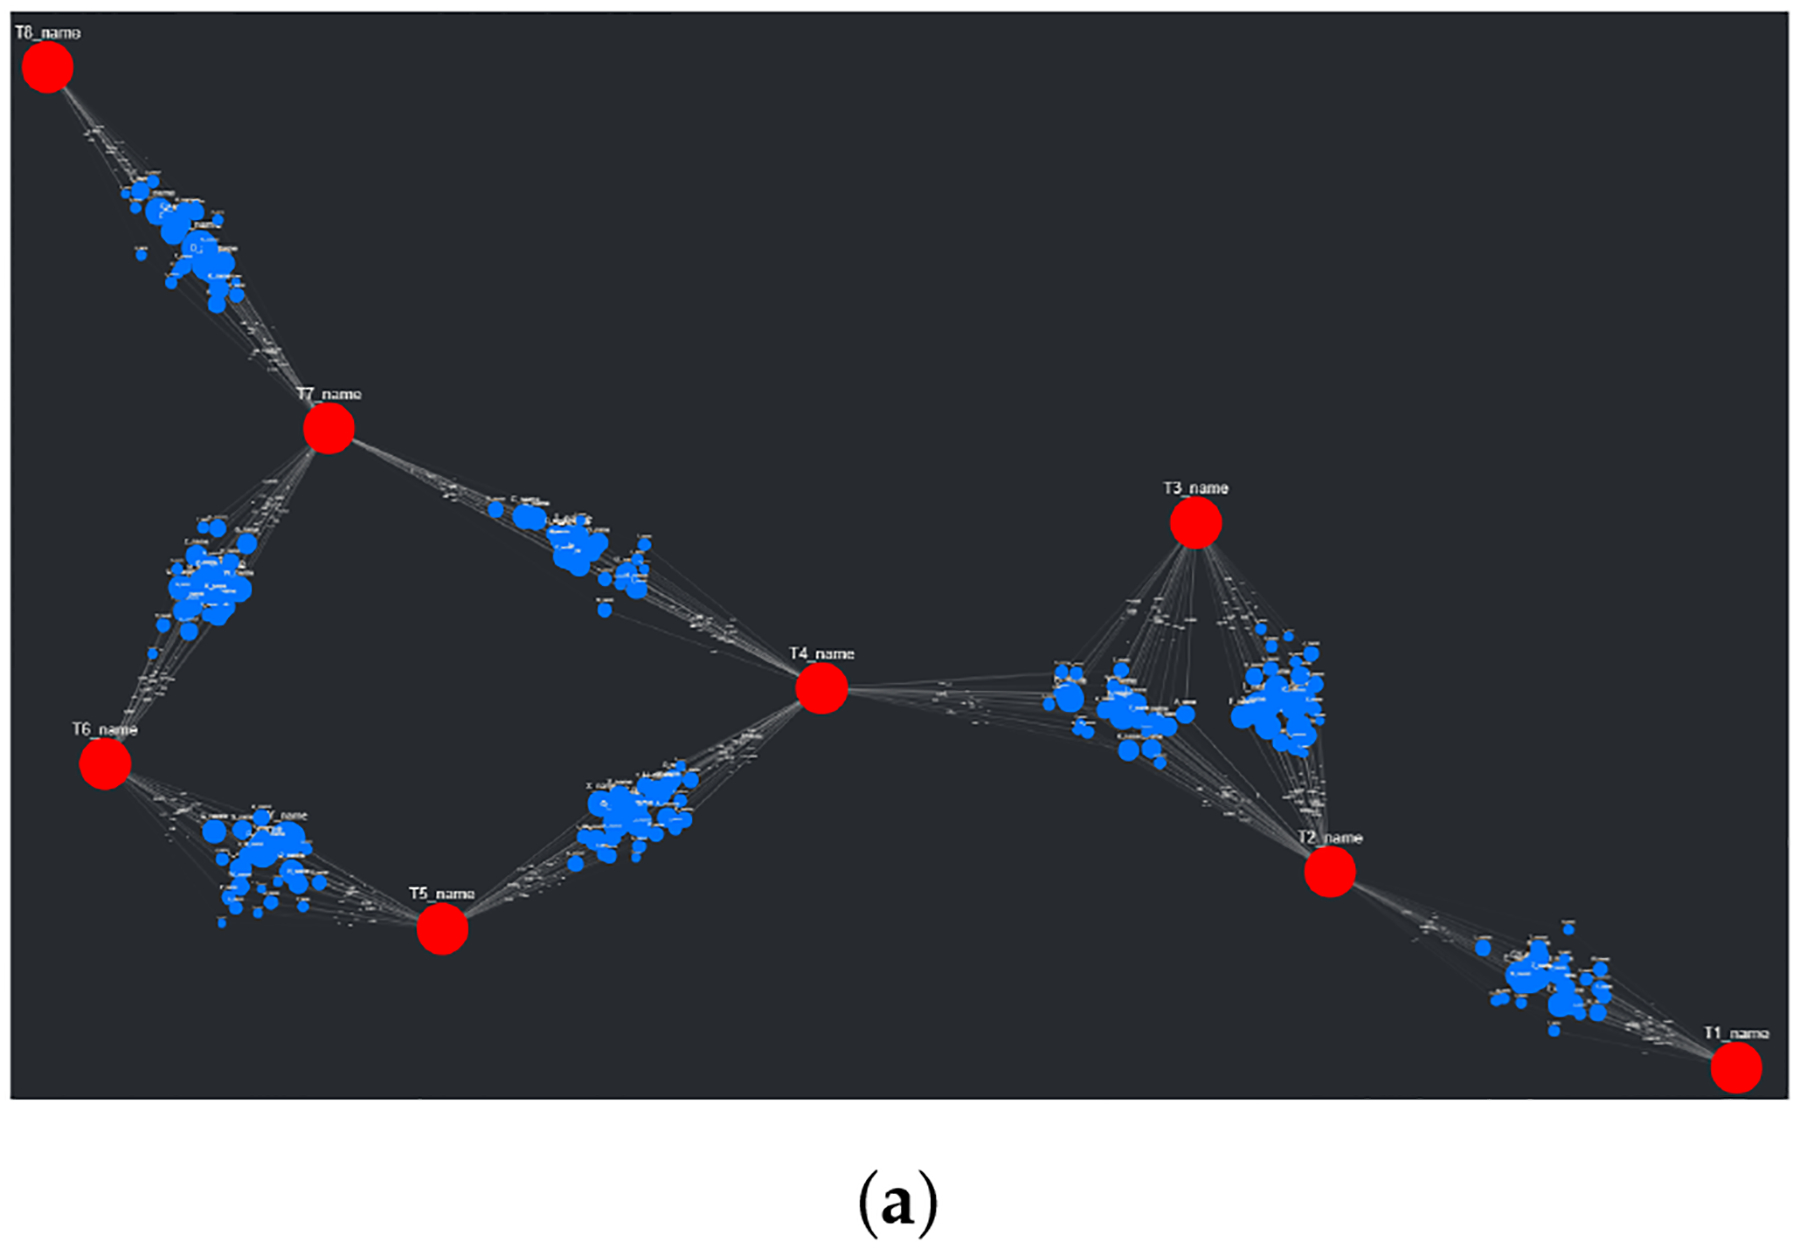
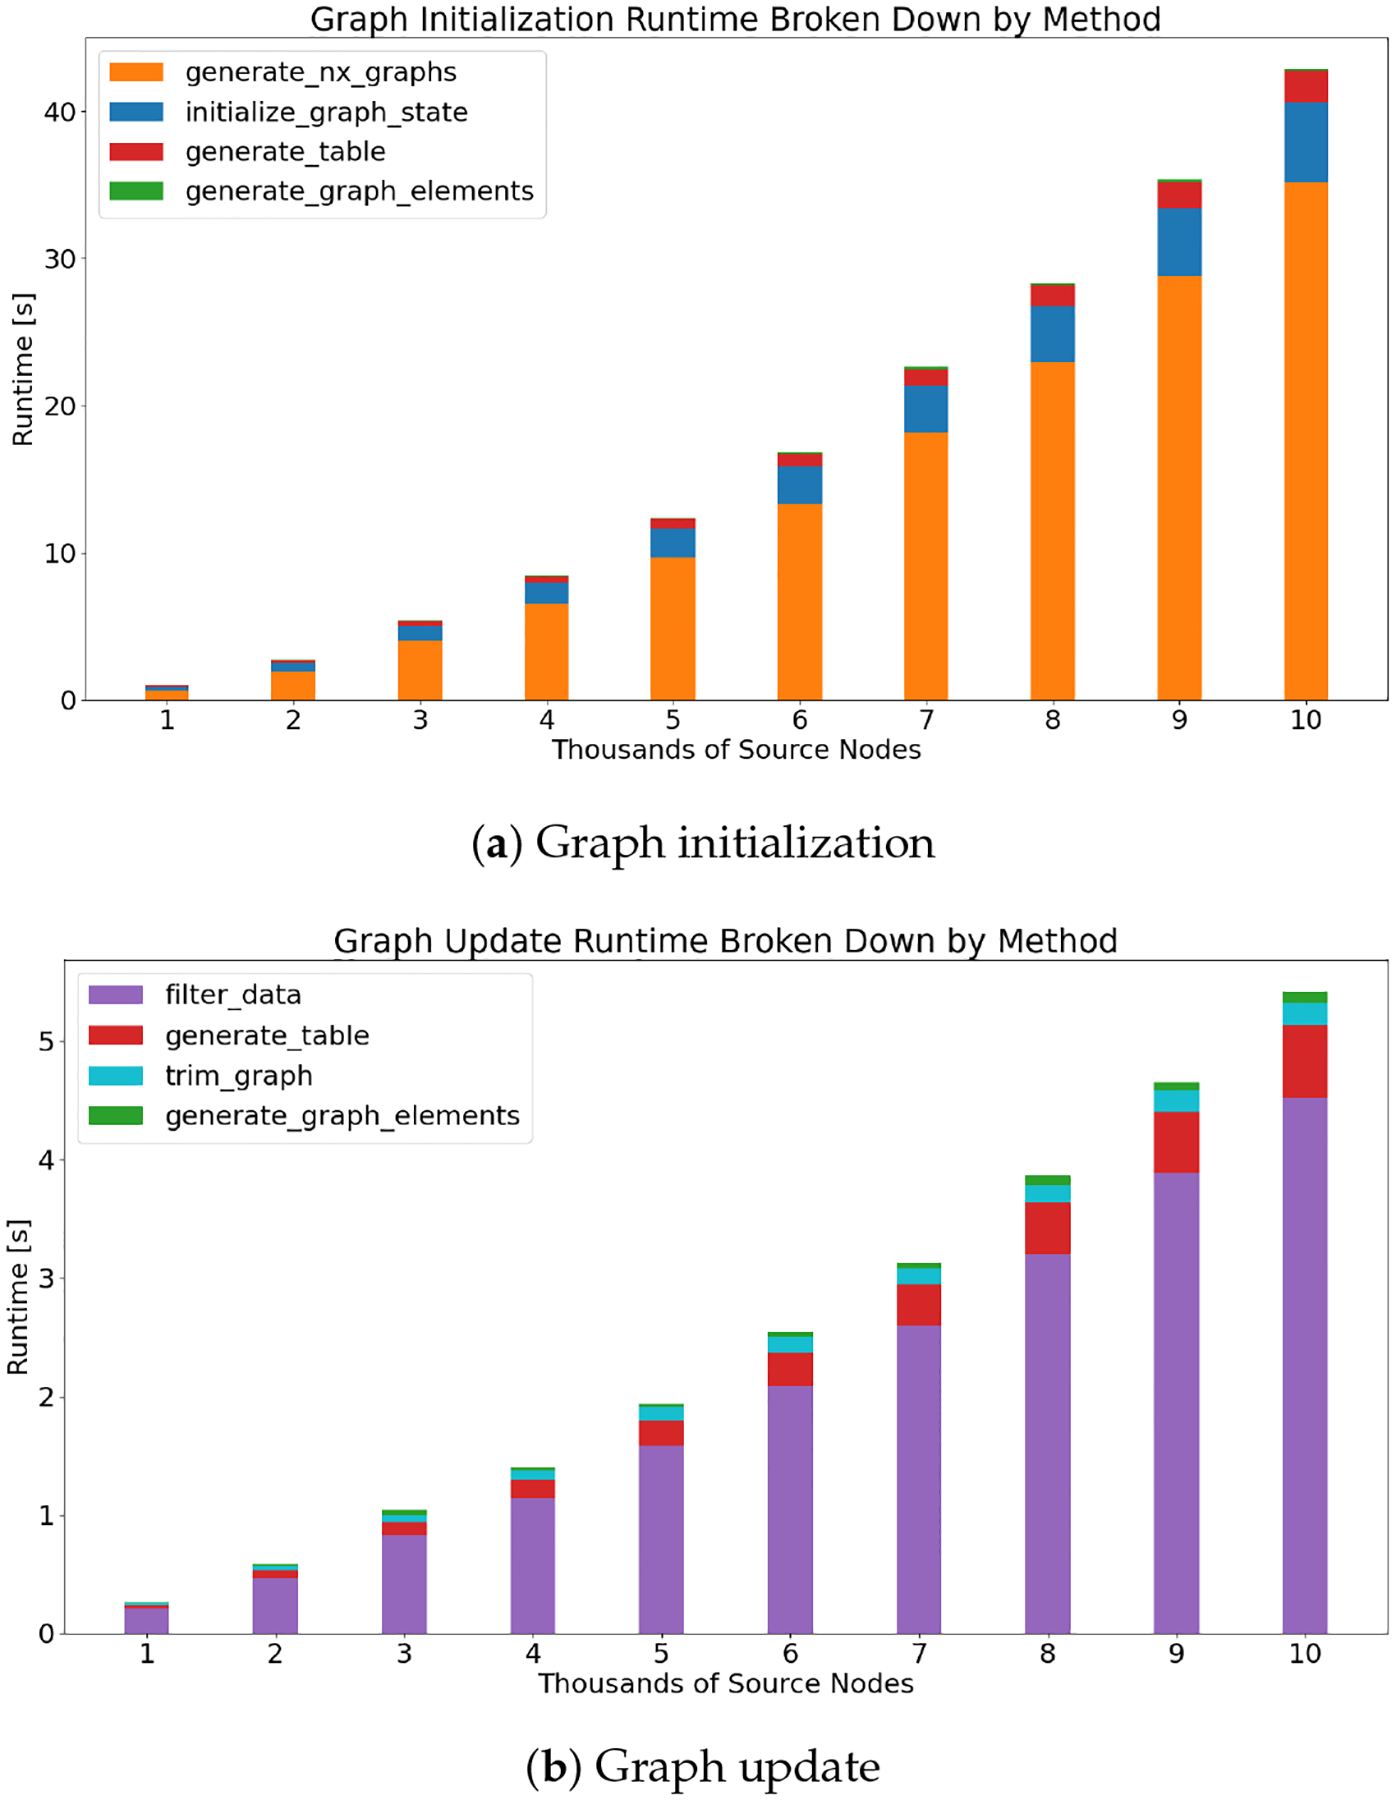
Large networks are quintessential to bioinformatics, knowledge graphs, social network analysis, and graph-based learning. CompositeView is a Python-based open-source application that improves interactive complex network visualization and extraction of actionable insight. CompositeView utilizes specifically formatted input data to calculate composite scores and display them using the Cytoscape component of Dash. Composite scores are defined representations of smaller sets of conceptually similar data that, when combined, generate a single score to reduce information overload. Visualized interactive results are user-refined via filtering elements such as node value and edge weight sliders and graph manipulation options (e.g., node color and layout spread). The primary difference between CompositeView and other network visualization tools is its ability to auto-calculate and auto-update composite scores as the user interactively filters or aggregates data. CompositeView was developed to visualize network relevance rankings, but it performs well with non-network data. Three disparate CompositeView use cases are shown: relevance rankings from SemNet 2.0, an open-source knowledge graph relationship ranking software for biomedical literature-based discovery; Human Development Index (HDI) data; and the Framingham cardiovascular study. CompositeView was stress tested to construct reference benchmarks that define breadth and size of data effectively visualized. Finally, CompositeView is compared to Excel, Tableau, Cytoscape, neo4j, NodeXL, and Gephi.

摘要

大型网络对于生物信息学、知识图谱、社交网络分析和基于图的学习至关重要。CompositeView是一个基于Python的开源应用程序,它改进了交互式复杂网络可视化并提取可操作的见解。CompositeView利用特定格式的输入数据来计算综合得分,并使用Dash的Cytoscape组件显示这些得分。综合得分是概念上相似的较小数据集的定义表示,当组合在一起时会生成一个单一得分以减少信息过载。可视化的交互式结果可通过诸如节点值和边权重滑块以及图形操作选项(例如节点颜色和布局分布)等过滤元素由用户进行优化。CompositeView与其他网络可视化工具的主要区别在于,当用户交互式过滤或聚合数据时,它能够自动计算和自动更新综合得分。CompositeView是为可视化网络相关性排名而开发的,但它在处理非网络数据时也表现良好。展示了三个不同的CompositeView用例:来自SemNet 2.0的相关性排名,SemNet 2.0是一个用于基于生物医学文献发现的开源知识图谱关系排名软件;人类发展指数(HDI)数据;以及弗雷明汉姆心血管研究。对CompositeView进行了压力测试,以构建定义有效可视化数据的广度和大小的参考基准。最后,将CompositeView与Excel、Tableau、Cytoscape、neo4j、NodeXL和Gephi进行了比较。

https://cdn.ncbi.nlm.nih.gov/pmc/blobs/b385/9281616/0c5bbbcaaa1e/nihms-1820207-f0015.jpg
https://cdn.ncbi.nlm.nih.gov/pmc/blobs/b385/9281616/ecc246900858/nihms-1820207-f0001.jpg
https://cdn.ncbi.nlm.nih.gov/pmc/blobs/b385/9281616/ec4b71d022fc/nihms-1820207-f0002.jpg
https://cdn.ncbi.nlm.nih.gov/pmc/blobs/b385/9281616/bbe289ac1034/nihms-1820207-f0003.jpg
https://cdn.ncbi.nlm.nih.gov/pmc/blobs/b385/9281616/19693faeba2a/nihms-1820207-f0004.jpg
https://cdn.ncbi.nlm.nih.gov/pmc/blobs/b385/9281616/94d811fcdca4/nihms-1820207-f0005.jpg
https://cdn.ncbi.nlm.nih.gov/pmc/blobs/b385/9281616/336b8da51316/nihms-1820207-f0006.jpg
https://cdn.ncbi.nlm.nih.gov/pmc/blobs/b385/9281616/61f5238a61e9/nihms-1820207-f0007.jpg
https://cdn.ncbi.nlm.nih.gov/pmc/blobs/b385/9281616/bb6449dbd96b/nihms-1820207-f0008.jpg
https://cdn.ncbi.nlm.nih.gov/pmc/blobs/b385/9281616/1b61e0eb62b5/nihms-1820207-f0010.jpg
https://cdn.ncbi.nlm.nih.gov/pmc/blobs/b385/9281616/dfebe1bd6784/nihms-1820207-f0011.jpg
https://cdn.ncbi.nlm.nih.gov/pmc/blobs/b385/9281616/f1f42f7dcde6/nihms-1820207-f0012.jpg
https://cdn.ncbi.nlm.nih.gov/pmc/blobs/b385/9281616/c33669bc0ff0/nihms-1820207-f0013.jpg
https://cdn.ncbi.nlm.nih.gov/pmc/blobs/b385/9281616/0070372fd0e0/nihms-1820207-f0014.jpg
https://cdn.ncbi.nlm.nih.gov/pmc/blobs/b385/9281616/0c5bbbcaaa1e/nihms-1820207-f0015.jpg

相似文献

1
CompositeView: A Network-Based Visualization Tool.复合视图:一种基于网络的可视化工具。
Big Data Cogn Comput. 2022 Jun;6(2). doi: 10.3390/bdcc6020066. Epub 2022 Jun 14.
2
SemNet: Using Local Features to Navigate the Biomedical Concept Graph.SemNet:利用局部特征在生物医学概念图中导航。
Front Bioeng Biotechnol. 2019 Jul 3;7:156. doi: 10.3389/fbioe.2019.00156. eCollection 2019.
3
Optimizations for Computing Relatedness in Biomedical Heterogeneous Information Networks: SemNet 2.0.生物医学异构信息网络中计算相关性的优化:SemNet 2.0
Big Data Cogn Comput. 2022 Mar;6(1). doi: 10.3390/bdcc6010027. Epub 2022 Mar 1.
4
Expediting knowledge acquisition by a web framework for Knowledge Graph Exploration and Visualization (KGEV): case studies on COVID-19 and Human Phenotype Ontology.利用知识图谱探索和可视化(KGEV)的网络框架加速知识获取:COVID-19 和人类表型本体论的案例研究。
BMC Med Inform Decis Mak. 2022 Jun 2;22(Suppl 2):147. doi: 10.1186/s12911-022-01848-z.
5
Linking Cytoscape and the corynebacterial reference database CoryneRegNet.将Cytoscape与棒状杆菌参考数据库CoryneRegNet相连接。
BMC Genomics. 2008 Apr 21;9:184. doi: 10.1186/1471-2164-9-184.
6
Folic acid supplementation and malaria susceptibility and severity among people taking antifolate antimalarial drugs in endemic areas.在流行地区,服用抗叶酸抗疟药物的人群中,叶酸补充剂与疟疾易感性和严重程度的关系。
Cochrane Database Syst Rev. 2022 Feb 1;2(2022):CD014217. doi: 10.1002/14651858.CD014217.
7
NAP: The Network Analysis Profiler, a web tool for easier topological analysis and comparison of medium-scale biological networks.NAP:网络分析剖析器,一种用于更轻松地对中等规模生物网络进行拓扑分析和比较的网络工具。
BMC Res Notes. 2017 Jul 14;10(1):278. doi: 10.1186/s13104-017-2607-8.
8
Visualization of protein interaction networks: problems and solutions.蛋白质相互作用网络的可视化:问题与解决方案。
BMC Bioinformatics. 2013;14 Suppl 1(Suppl 1):S1. doi: 10.1186/1471-2105-14-S1-S1. Epub 2013 Jan 14.
9
Dynamic graph exploration by interactively linked node-link diagrams and matrix visualizations.通过交互式链接的节点链接图和矩阵可视化进行动态图探索。
Vis Comput Ind Biomed Art. 2021 Sep 7;4(1):23. doi: 10.1186/s42492-021-00088-8.
10
ProteoLens: a visual analytic tool for multi-scale database-driven biological network data mining.ProteoLens:一种用于多尺度数据库驱动的生物网络数据挖掘的可视化分析工具。
BMC Bioinformatics. 2008 Aug 12;9 Suppl 9(Suppl 9):S5. doi: 10.1186/1471-2105-9-S9-S5.

引用本文的文献

1
Artificial Intelligence-Assisted Comparative Analysis of the Overlapping Molecular Pathophysiology of Alzheimer's Disease, Amyotrophic Lateral Sclerosis, and Frontotemporal Dementia.人工智能辅助对阿尔茨海默病、肌萎缩侧索硬化症和额颞叶痴呆重叠分子病理生理学的比较分析
Int J Mol Sci. 2024 Dec 15;25(24):13450. doi: 10.3390/ijms252413450.
2
Cross-Domain Text Mining of Pathophysiological Processes Associated with Diabetic Kidney Disease.与糖尿病肾病相关的病理生理过程的跨领域文本挖掘
Int J Mol Sci. 2024 Apr 19;25(8):4503. doi: 10.3390/ijms25084503.
3
Cross-Domain Text Mining to Predict Adverse Events from Tyrosine Kinase Inhibitors for Chronic Myeloid Leukemia.

本文引用的文献

1
Optimizations for Computing Relatedness in Biomedical Heterogeneous Information Networks: SemNet 2.0.生物医学异构信息网络中计算相关性的优化:SemNet 2.0
Big Data Cogn Comput. 2022 Mar;6(1). doi: 10.3390/bdcc6010027. Epub 2022 Mar 1.
2
Biomedical Text Link Prediction for Drug Discovery: A Case Study with COVID-19.用于药物发现的生物医学文本链接预测:以COVID-19为例的案例研究
Pharmaceutics. 2021 May 26;13(6):794. doi: 10.3390/pharmaceutics13060794.
3
Application of network link prediction in drug discovery.网络链接预测在药物发现中的应用。
跨领域文本挖掘以预测慢性髓性白血病酪氨酸激酶抑制剂的不良事件
Cancers (Basel). 2022 Sep 26;14(19):4686. doi: 10.3390/cancers14194686.
BMC Bioinformatics. 2021 Apr 12;22(1):187. doi: 10.1186/s12859-021-04082-y.
4
Similarity-based link prediction in social networks using latent relationships between the users.基于相似性的社交网络链接预测,利用用户之间潜在的关系。
Sci Rep. 2020 Nov 18;10(1):20137. doi: 10.1038/s41598-020-76799-4.
5
Biological network analysis with deep learning.基于深度学习的生物网络分析。
Brief Bioinform. 2021 Mar 22;22(2):1515-1530. doi: 10.1093/bib/bbaa257.
6
Array programming with NumPy.使用 NumPy 进行数组编程。
Nature. 2020 Sep;585(7825):357-362. doi: 10.1038/s41586-020-2649-2. Epub 2020 Sep 16.
7
A Guide to Conquer the Biological Network Era Using Graph Theory.《利用图论征服生物网络时代指南》
Front Bioeng Biotechnol. 2020 Jan 31;8:34. doi: 10.3389/fbioe.2020.00034. eCollection 2020.
8
Predicting links between tumor samples and genes using 2-Layered graph based diffusion approach.使用基于双层图的扩散方法预测肿瘤样本和基因之间的联系。
BMC Bioinformatics. 2019 Sep 9;20(1):462. doi: 10.1186/s12859-019-3056-2.
9
SemNet: Using Local Features to Navigate the Biomedical Concept Graph.SemNet:利用局部特征在生物医学概念图中导航。
Front Bioeng Biotechnol. 2019 Jul 3;7:156. doi: 10.3389/fbioe.2019.00156. eCollection 2019.
10
PARS risk charts: A 10-year study of risk assessment for cardiovascular diseases in Eastern Mediterranean Region.PARS风险图表:东地中海区域心血管疾病风险评估的十年研究。
PLoS One. 2017 Dec 19;12(12):e0189389. doi: 10.1371/journal.pone.0189389. eCollection 2017.