• 文献检索
  • 文档翻译
  • 深度研究
  • 学术资讯
  • Suppr Zotero 插件Zotero 插件
  • 邀请有礼
  • 套餐&价格
  • 历史记录
应用&插件
Suppr Zotero 插件Zotero 插件浏览器插件Mac 客户端Windows 客户端微信小程序
定价
高级版会员购买积分包购买API积分包
服务
文献检索文档翻译深度研究API 文档MCP 服务
关于我们
关于 Suppr公司介绍联系我们用户协议隐私条款
关注我们

Suppr 超能文献

核心技术专利:CN118964589B侵权必究
粤ICP备2023148730 号-1Suppr @ 2026

文献检索

告别复杂PubMed语法,用中文像聊天一样搜索,搜遍4000万医学文献。AI智能推荐,让科研检索更轻松。

立即免费搜索

文件翻译

保留排版,准确专业,支持PDF/Word/PPT等文件格式,支持 12+语言互译。

免费翻译文档

深度研究

AI帮你快速写综述,25分钟生成高质量综述,智能提取关键信息,辅助科研写作。

立即免费体验

NAP:网络分析剖析器,一种用于更轻松地对中等规模生物网络进行拓扑分析和比较的网络工具。

NAP: The Network Analysis Profiler, a web tool for easier topological analysis and comparison of medium-scale biological networks.

作者信息

Theodosiou Theodosios, Efstathiou Georgios, Papanikolaou Nikolas, Kyrpides Nikos C, Bagos Pantelis G, Iliopoulos Ioannis, Pavlopoulos Georgios A

机构信息

Bioinformatics & Computational Biology Laboratory, Division of Basic Sciences, University of Crete Medical School, 70013 Heraklion, Crete, Greece.

Joint Genome Institute, Lawrence Berkeley Lab, United States Department of Energy, 2800 Mitchell Drive, Walnut Creek, CA, 94598, USA.

出版信息

BMC Res Notes. 2017 Jul 14;10(1):278. doi: 10.1186/s13104-017-2607-8.

DOI:10.1186/s13104-017-2607-8
PMID:28705239
原文链接:https://pmc.ncbi.nlm.nih.gov/articles/PMC5513407/
Abstract

OBJECTIVE

Nowadays, due to the technological advances of high-throughput techniques, Systems Biology has seen a tremendous growth of data generation. With network analysis, looking at biological systems at a higher level in order to better understand a system, its topology and the relationships between its components is of a great importance. Gene expression, signal transduction, protein/chemical interactions, biomedical literature co-occurrences, are few of the examples captured in biological network representations where nodes represent certain bioentities and edges represent the connections between them. Today, many tools for network visualization and analysis are available. Nevertheless, most of them are standalone applications that often (i) burden users with computing and calculation time depending on the network's size and (ii) focus on handling, editing and exploring a network interactively. While such functionality is of great importance, limited efforts have been made towards the comparison of the topological analysis of multiple networks.

RESULTS

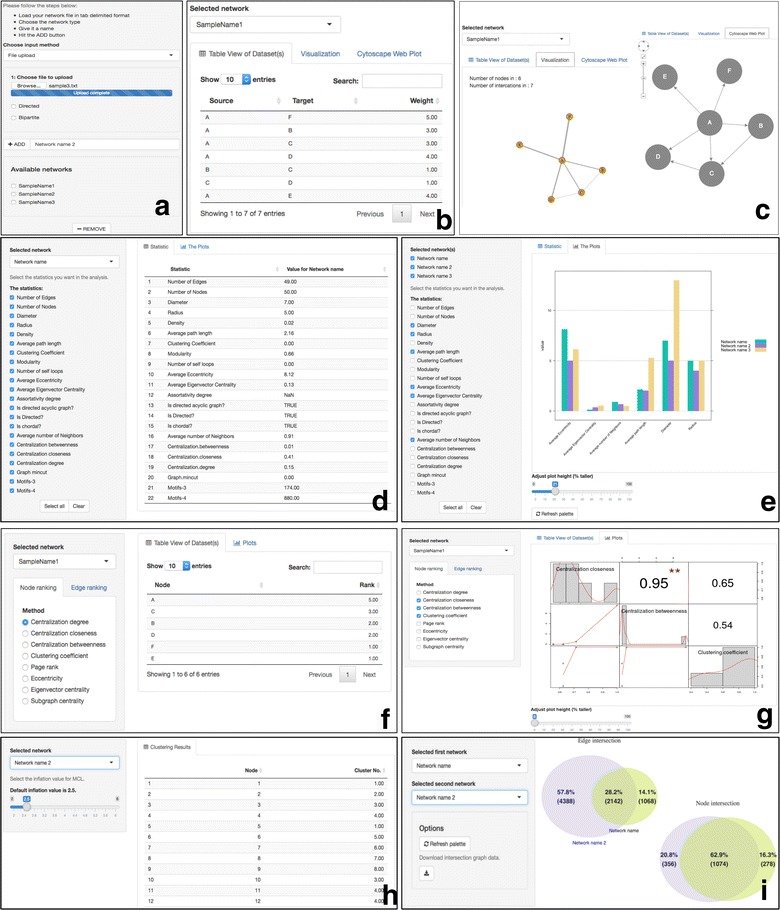
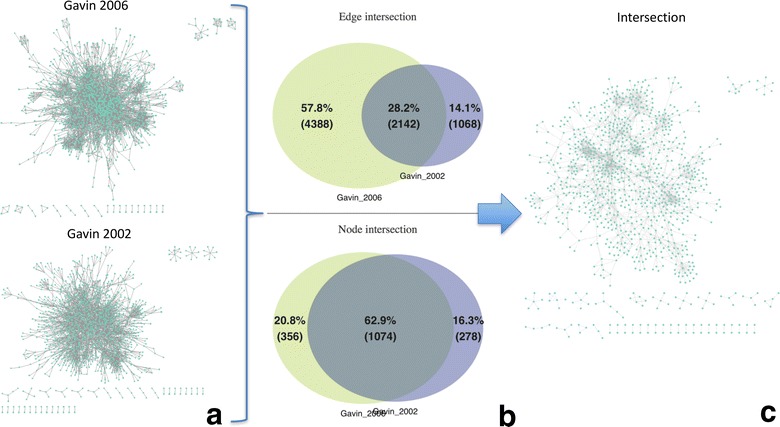
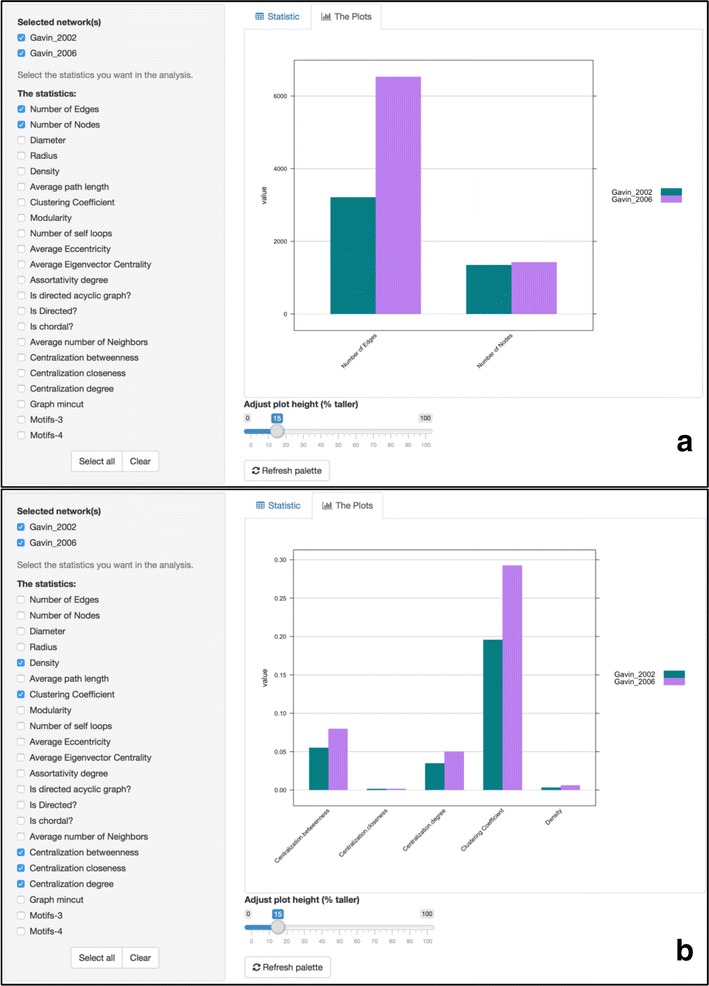
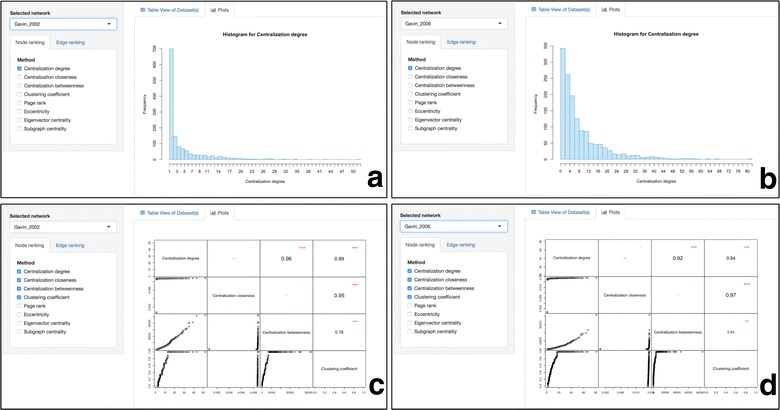
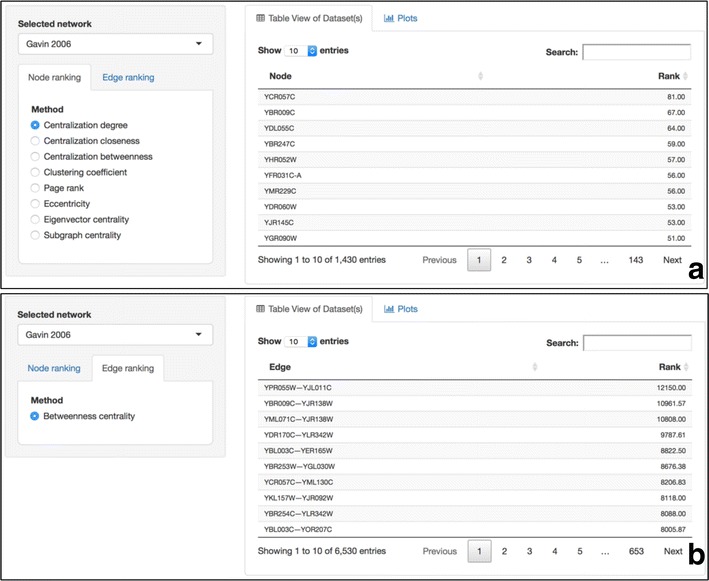
Network Analysis Provider (NAP) is a comprehensive web tool to automate network profiling and intra/inter-network topology comparison. It is designed to bridge the gap between network analysis, statistics, graph theory and partially visualization in a user-friendly way. It is freely available and aims to become a very appealing tool for the broader community. It hosts a great plethora of topological analysis methods such as node and edge rankings. Few of its powerful characteristics are: its ability to enable easy profile comparisons across multiple networks, find their intersection and provide users with simplified, high quality plots of any of the offered topological characteristics against any other within the same network. It is written in R and Shiny, it is based on the igraph library and it is able to handle medium-scale weighted/unweighted, directed/undirected and bipartite graphs. NAP is available at http://bioinformatics.med.uoc.gr/NAP .

摘要

目的

如今,由于高通量技术的进步,系统生物学领域的数据生成量大幅增长。通过网络分析,从更高层次审视生物系统,以更好地理解系统、其拓扑结构及其组成部分之间的关系至关重要。基因表达、信号转导、蛋白质/化学相互作用、生物医学文献共现等,是生物网络表示中捕获的一些示例,其中节点代表特定生物实体,边代表它们之间的连接。如今,有许多用于网络可视化和分析的工具。然而,它们中的大多数都是独立应用程序,通常(i)根据网络大小给用户带来计算和计算时间负担,(ii)专注于交互式地处理、编辑和探索网络。虽然此类功能很重要,但在多个网络的拓扑分析比较方面所做的努力有限。

结果

网络分析提供程序(NAP)是一个全面的网络工具,用于自动进行网络分析和网络内/网络间拓扑比较。它旨在以用户友好的方式弥合网络分析、统计学、图论和部分可视化之间的差距。它是免费提供的,旨在成为广大社区非常有吸引力的工具。它拥有大量拓扑分析方法,如节点和边排名。它的一些强大特性包括:能够轻松跨多个网络进行分析比较,找到它们的交集,并为用户提供同一网络内任何两个提供的拓扑特征的简化、高质量绘图。它用R和Shiny编写,基于igraph库,能够处理中等规模的加权/未加权、有向/无向和二分图。NAP可在http://bioinformatics.med.uoc.gr/NAP获取。

https://cdn.ncbi.nlm.nih.gov/pmc/blobs/9465/5513407/87951fe6458f/13104_2017_2607_Fig5_HTML.jpg
https://cdn.ncbi.nlm.nih.gov/pmc/blobs/9465/5513407/9c86dd985df6/13104_2017_2607_Fig1_HTML.jpg
https://cdn.ncbi.nlm.nih.gov/pmc/blobs/9465/5513407/1dde192afce1/13104_2017_2607_Fig2_HTML.jpg
https://cdn.ncbi.nlm.nih.gov/pmc/blobs/9465/5513407/aab11157679a/13104_2017_2607_Fig3_HTML.jpg
https://cdn.ncbi.nlm.nih.gov/pmc/blobs/9465/5513407/7717a3516f2f/13104_2017_2607_Fig4_HTML.jpg
https://cdn.ncbi.nlm.nih.gov/pmc/blobs/9465/5513407/87951fe6458f/13104_2017_2607_Fig5_HTML.jpg

相似文献

1
NAP: The Network Analysis Profiler, a web tool for easier topological analysis and comparison of medium-scale biological networks.NAP:网络分析剖析器,一种用于更轻松地对中等规模生物网络进行拓扑分析和比较的网络工具。
BMC Res Notes. 2017 Jul 14;10(1):278. doi: 10.1186/s13104-017-2607-8.
2
BisoGenet: a new tool for gene network building, visualization and analysis.BisoGenet:一种用于基因网络构建、可视化和分析的新工具。
BMC Bioinformatics. 2010 Feb 17;11:91. doi: 10.1186/1471-2105-11-91.
3
CellNetVis: a web tool for visualization of biological networks using force-directed layout constrained by cellular components.CellNetVis:一种利用受细胞成分约束的力导向布局来可视化生物网络的网络工具。
BMC Bioinformatics. 2017 Sep 13;18(Suppl 10):395. doi: 10.1186/s12859-017-1787-5.
4
HRGRN: A Graph Search-Empowered Integrative Database of Arabidopsis Signaling Transduction, Metabolism and Gene Regulation Networks.HRGRN:一个由图形搜索支持的拟南芥信号转导、代谢和基因调控网络综合数据库。
Plant Cell Physiol. 2016 Jan;57(1):e12. doi: 10.1093/pcp/pcv200. Epub 2015 Dec 12.
5
Computing topological parameters of biological networks.计算生物网络的拓扑参数。
Bioinformatics. 2008 Jan 15;24(2):282-4. doi: 10.1093/bioinformatics/btm554. Epub 2007 Nov 15.
6
ZoomOut: Analyzing Multiple Networks as Single Nodes.缩小显示:将多个网络作为单个节点进行分析。
IEEE/ACM Trans Comput Biol Bioinform. 2015 Sep-Oct;12(5):1213-6. doi: 10.1109/TCBB.2015.2424411.
7
Arena3Dweb: interactive 3D visualization of multilayered networks.Arena3Dweb:多层网络的交互式 3D 可视化。
Nucleic Acids Res. 2021 Jul 2;49(W1):W36-W45. doi: 10.1093/nar/gkab278.
8
DEEP--a tool for differential expression effector prediction.DEEP——一种用于差异表达效应预测的工具。
Nucleic Acids Res. 2007 Jul;35(Web Server issue):W619-24. doi: 10.1093/nar/gkm469. Epub 2007 Jun 21.
9
UNIPred-Web: a web tool for the integration and visualization of biomolecular networks for protein function prediction.UNIPred-Web:一个用于整合和可视化生物分子网络的网络工具,用于蛋白质功能预测。
BMC Bioinformatics. 2019 Aug 14;20(1):422. doi: 10.1186/s12859-019-2959-2.
10
Biological Network Inference and analysis using SEBINI and CABIN.使用SEBINI和CABIN进行生物网络推断与分析。
Methods Mol Biol. 2009;541:551-76. doi: 10.1007/978-1-59745-243-4_24.

引用本文的文献

1
In-silico identification of therapeutic targets in pancreatic ductal adenocarcinoma using WGCNA and Trader.基于 WGCNA 和 Trader 的胰腺导管腺癌治疗靶点的计算机识别
Sci Rep. 2024 Oct 7;14(1):23292. doi: 10.1038/s41598-024-74252-4.
2
WIPER: Weighted in-Path Edge Ranking for biomolecular association networks.WIPER:生物分子关联网络的加权路径内边排序
Quant Biol. 2019 Dec;7(4):313-326. doi: 10.1007/s40484-019-0180-y. Epub 2019 Dec 1.
3
Bioinformatics Prediction for Network-Based Integrative Multi-Omics Expression Data Analysis in Hirschsprung Disease.

本文引用的文献

1
SNAP: A General Purpose Network Analysis and Graph Mining Library.SNAP:一个通用的网络分析和图挖掘库。
ACM Trans Intell Syst Technol. 2016 Oct;8(1). doi: 10.1145/2898361. Epub 2016 Oct 3.
2
ZoomOut: Analyzing Multiple Networks as Single Nodes.缩小显示:将多个网络作为单个节点进行分析。
IEEE/ACM Trans Comput Biol Bioinform. 2015 Sep-Oct;12(5):1213-6. doi: 10.1109/TCBB.2015.2424411.
3
Cytoscape.js: a graph theory library for visualisation and analysis.Cytoscape.js:一个用于可视化和分析的图论库。
基于网络的综合多组学表达数据分析在先天性巨结肠病中的生物信息学预测。
Biomolecules. 2024 Jan 30;14(2):164. doi: 10.3390/biom14020164.
4
Time-resolved proteomic profiling reveals compositional and functional transitions across the stress granule life cycle.时间分辨蛋白质组学分析揭示应激颗粒生命周期中组成和功能的转变。
Nat Commun. 2023 Nov 27;14(1):7782. doi: 10.1038/s41467-023-43470-1.
5
Single-cell sequencing and transcriptome analyses in the construction of a liquid-liquid phase separation-associated gene model for rheumatoid arthritis.单细胞测序和转录组分析在类风湿关节炎液-液相分离相关基因模型构建中的应用
Front Genet. 2023 Oct 25;14:1210722. doi: 10.3389/fgene.2023.1210722. eCollection 2023.
6
Darling: A Web Application for Detecting Disease-Related Biomedical Entity Associations with Literature Mining.亲爱的:一个使用文献挖掘技术检测与疾病相关的生物医学实体关联的网络应用程序。
Biomolecules. 2022 Mar 30;12(4):520. doi: 10.3390/biom12040520.
7
A Bioinformatics-Assisted Review on Iron Metabolism and Immune System to Identify Potential Biomarkers of Exercise Stress-Induced Immunosuppression.一项关于铁代谢与免疫系统的生物信息学辅助综述,以确定运动应激诱导免疫抑制的潜在生物标志物。
Biomedicines. 2022 Mar 21;10(3):724. doi: 10.3390/biomedicines10030724.
8
Biomolecule and Bioentity Interaction Databases in Systems Biology: A Comprehensive Review.系统生物学中的生物分子和生物实体相互作用数据库:全面综述。
Biomolecules. 2021 Aug 20;11(8):1245. doi: 10.3390/biom11081245.
9
Biological Network Mining.生物网络挖掘。
Methods Mol Biol. 2021;2328:139-151. doi: 10.1007/978-1-0716-1534-8_8.
10
NORMA: The Network Makeup Artist - A Web Tool for Network Annotation Visualization.NORMA:网络化妆师——一种用于网络注释可视化的网络工具。
Genomics Proteomics Bioinformatics. 2022 Jun;20(3):578-586. doi: 10.1016/j.gpb.2021.02.005. Epub 2021 Jun 24.
Bioinformatics. 2016 Jan 15;32(2):309-11. doi: 10.1093/bioinformatics/btv557. Epub 2015 Sep 28.
4
Visualizing genome and systems biology: technologies, tools, implementation techniques and trends, past, present and future.可视化基因组与系统生物学:技术、工具、实施方法及趋势,过去、现在与未来
Gigascience. 2015 Aug 25;4:38. doi: 10.1186/s13742-015-0077-2. eCollection 2015.
5
Corbi: a new R package for biological network alignment and querying.Corbi:用于生物网络比对和查询的一个新的R软件包。
BMC Syst Biol. 2013;7 Suppl 2(Suppl 2):S6. doi: 10.1186/1752-0509-7-S2-S6. Epub 2013 Oct 14.
6
Arena3D: visualizing time-driven phenotypic differences in biological systems.Arena3D:可视化生物系统中时间驱动的表型差异。
BMC Bioinformatics. 2012 Mar 22;13:45. doi: 10.1186/1471-2105-13-45.
7
Topological analysis and interactive visualization of biological networks and protein structures.生物网络和蛋白质结构的拓扑分析及交互式可视化。
Nat Protoc. 2012 Mar 15;7(4):670-85. doi: 10.1038/nprot.2012.004.
8
Clustering algorithms in biomedical research: a review.生物医学研究中的聚类算法:综述。
IEEE Rev Biomed Eng. 2010;3:120-54. doi: 10.1109/RBME.2010.2083647.
9
clusterMaker: a multi-algorithm clustering plugin for Cytoscape.clusterMaker:Cytoscape 的多算法聚类插件。
BMC Bioinformatics. 2011 Nov 9;12:436. doi: 10.1186/1471-2105-12-436.
10
Using graph theory to analyze biological networks.运用图论分析生物网络。
BioData Min. 2011 Apr 28;4:10. doi: 10.1186/1756-0381-4-10.