• 文献检索
  • 文档翻译
  • 深度研究
  • 学术资讯
  • Suppr Zotero 插件Zotero 插件
  • 邀请有礼
  • 套餐&价格
  • 历史记录
应用&插件
Suppr Zotero 插件Zotero 插件浏览器插件Mac 客户端Windows 客户端微信小程序
定价
高级版会员购买积分包购买API积分包
服务
文献检索文档翻译深度研究API 文档MCP 服务
关于我们
关于 Suppr公司介绍联系我们用户协议隐私条款
关注我们

Suppr 超能文献

核心技术专利:CN118964589B侵权必究
粤ICP备2023148730 号-1Suppr @ 2026

文献检索

告别复杂PubMed语法,用中文像聊天一样搜索,搜遍4000万医学文献。AI智能推荐,让科研检索更轻松。

立即免费搜索

文件翻译

保留排版,准确专业,支持PDF/Word/PPT等文件格式,支持 12+语言互译。

免费翻译文档

深度研究

AI帮你快速写综述,25分钟生成高质量综述,智能提取关键信息,辅助科研写作。

立即免费体验

利用 GEE 实现评估更粗分辨率到更细分辨率多光谱卫星在稻田制图中的效率。

Evaluating the efficiency of coarser to finer resolution multispectral satellites in mapping paddy rice fields using GEE implementation.

机构信息

Department of Environmental Sciences, COMSATS University Islamabad, Vehari Campus, Islamabad, 61100, Pakistan.

Asian Disaster Preparedness Center (ADPC), Bangkok, Thailand.

出版信息

Sci Rep. 2022 Aug 1;12(1):13210. doi: 10.1038/s41598-022-17454-y.

DOI:10.1038/s41598-022-17454-y
PMID:35915211
原文链接:https://pmc.ncbi.nlm.nih.gov/articles/PMC9343374/
Abstract

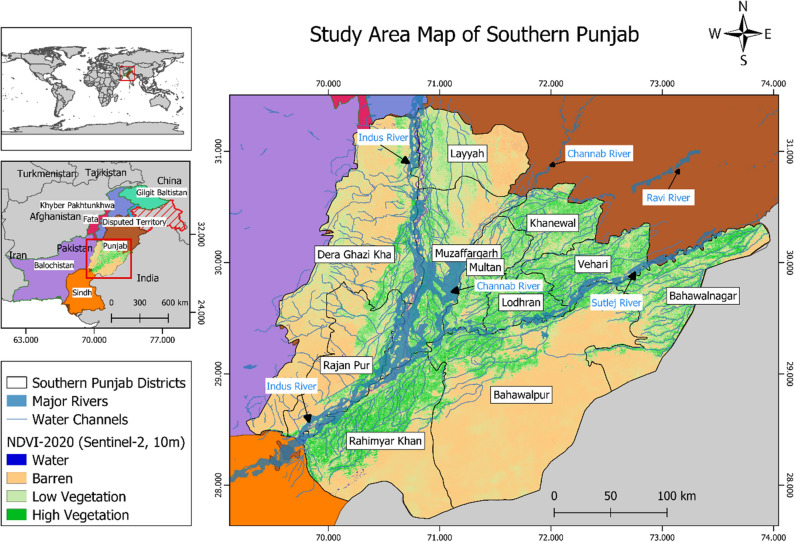
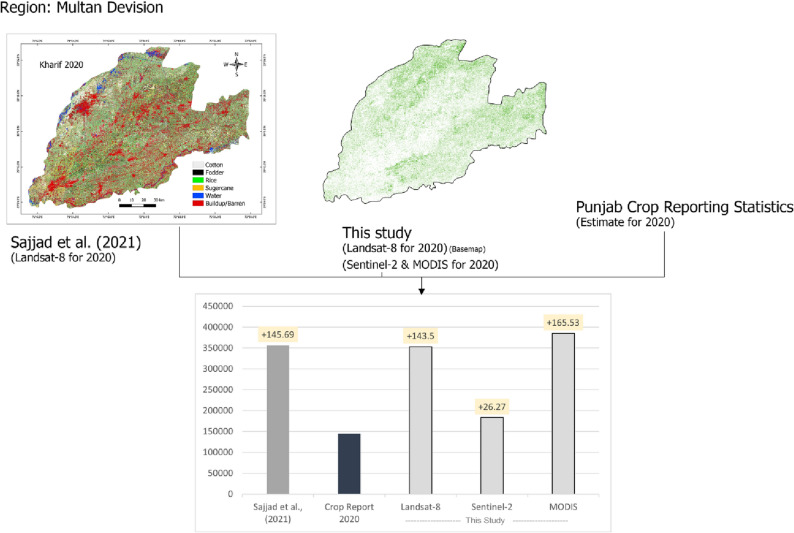
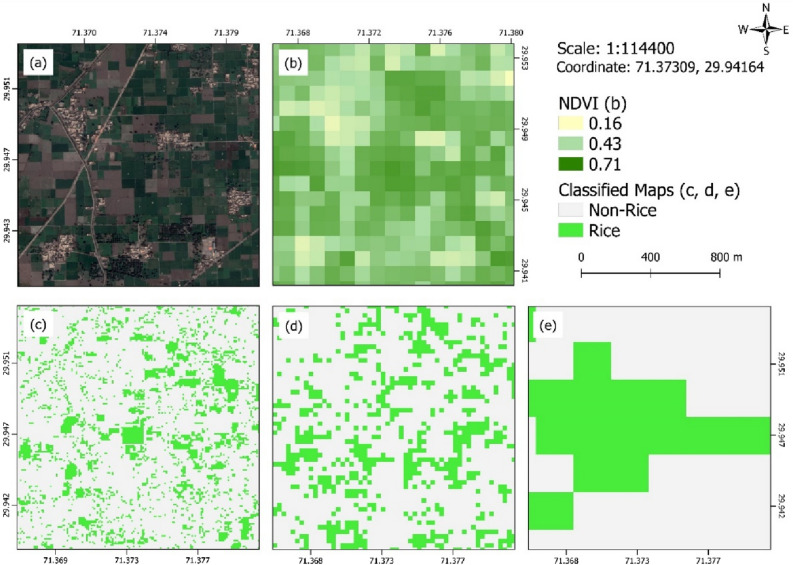
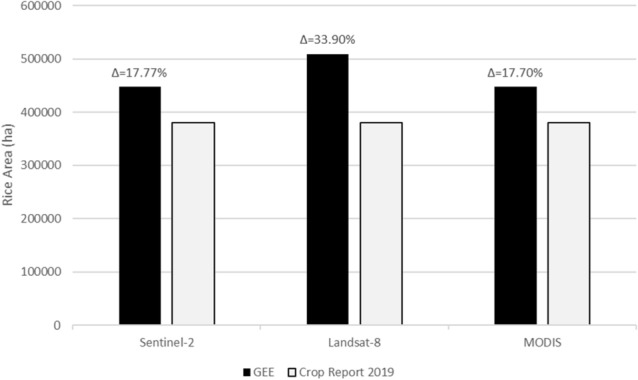
Timely and accurate estimation of rice-growing areas and forecasting of production can provide crucial information for governments, planners, and decision-makers in formulating policies. While there exists studies focusing on paddy rice mapping, only few have compared multi-scale datasets performance in rice classification. Furthermore, rice mapping of large geographical areas with sufficient accuracy for planning purposes has been a challenge in Pakistan, but recent advancements in Google Earth Engine make it possible to analyze spatial and temporal variations within these areas. The study was carried out over southern Punjab (Pakistan)-a region with 380,400 hectares devoted to rice production in year 2020. Previous studies support the individual capabilities of Sentinel-2, Landsat-8, and Moderate Resolution Imaging Spectroradiometer (MODIS) for paddy rice classification. However, to our knowledge, no study has compared the efficiencies of these three datasets in rice crop classification. Thus, this study primarily focuses on comparing these satellites' data by estimating their potential in rice crop classification using accuracy assessment methods and area estimation. The overall accuracies were found to be 96% for Sentinel-2, 91.7% for Landsat-8, and 82.6% for MODIS. The F1-Scores for derived rice class were 83.8%, 75.5%, and 65.5% for Sentinel-2, Landsat-8, and MODIS, respectively. The rice estimated area corresponded relatively well with the crop statistics report provided by the Department of Agriculture, Punjab, with a mean percentage difference of less than 20% for Sentinel-2 and MODIS and 33% for Landsat-8. The outcomes of this study highlight three points; (a) Rice mapping accuracy improves with increase in spatial resolution, (b) Sentinel-2 efficiently differentiated individual farm level paddy fields while Landsat-8 was not able to do so, and lastly (c) Increase in rice cultivated area was observed using satellite images compared to the government provided statistics.

摘要

及时准确地估算水稻种植面积和预测产量,可以为政府、规划者和决策者提供制定政策的关键信息。虽然已经有研究专注于稻田制图,但很少有研究比较过多尺度数据集在水稻分类中的性能。此外,对于规划目的而言,对巴基斯坦这样的大面积地区进行准确的水稻制图一直是一个挑战,但谷歌地球引擎的最新进展使得分析这些地区的时空变化成为可能。该研究在巴基斯坦南部旁遮普省进行,该地区 2020 年有 38 万公顷用于水稻生产。之前的研究支持 Sentinel-2、Landsat-8 和中等分辨率成像光谱仪(MODIS)在稻田分类方面的单独能力。然而,据我们所知,没有研究比较过这三个数据集在水稻作物分类中的效率。因此,本研究主要侧重于通过使用精度评估方法和面积估算来比较这些卫星数据,以评估它们在水稻作物分类中的潜力。Sentinel-2 的总体精度为 96%,Landsat-8 的总体精度为 91.7%,MODIS 的总体精度为 82.6%。Sentinel-2、Landsat-8 和 MODIS 生成的水稻分类的 F1 分数分别为 83.8%、75.5%和 65.5%。与旁遮普省农业部提供的作物统计报告相比,估算的水稻面积相对吻合,Sentinel-2 和 MODIS 的平均百分比差异小于 20%,而 Landsat-8 的平均百分比差异为 33%。本研究的结果突出了三点:(a)随着空间分辨率的提高,水稻制图精度提高;(b)Sentinel-2 能够有效地区分单个农田级别的稻田,而 Landsat-8 则不能;(c)与政府提供的统计数据相比,使用卫星图像观察到水稻种植面积增加。

https://cdn.ncbi.nlm.nih.gov/pmc/blobs/54b8/9343374/169d1adae70a/41598_2022_17454_Fig11_HTML.jpg
https://cdn.ncbi.nlm.nih.gov/pmc/blobs/54b8/9343374/e2e455ece102/41598_2022_17454_Fig1_HTML.jpg
https://cdn.ncbi.nlm.nih.gov/pmc/blobs/54b8/9343374/8480f50c0c6d/41598_2022_17454_Fig2_HTML.jpg
https://cdn.ncbi.nlm.nih.gov/pmc/blobs/54b8/9343374/8137938f6add/41598_2022_17454_Fig3_HTML.jpg
https://cdn.ncbi.nlm.nih.gov/pmc/blobs/54b8/9343374/a539e8872b97/41598_2022_17454_Fig4_HTML.jpg
https://cdn.ncbi.nlm.nih.gov/pmc/blobs/54b8/9343374/2741784ad214/41598_2022_17454_Fig5_HTML.jpg
https://cdn.ncbi.nlm.nih.gov/pmc/blobs/54b8/9343374/0e773563d168/41598_2022_17454_Fig6_HTML.jpg
https://cdn.ncbi.nlm.nih.gov/pmc/blobs/54b8/9343374/bf40e2539a22/41598_2022_17454_Fig7_HTML.jpg
https://cdn.ncbi.nlm.nih.gov/pmc/blobs/54b8/9343374/1f873507bd88/41598_2022_17454_Fig8_HTML.jpg
https://cdn.ncbi.nlm.nih.gov/pmc/blobs/54b8/9343374/b9c1991a73aa/41598_2022_17454_Fig9_HTML.jpg
https://cdn.ncbi.nlm.nih.gov/pmc/blobs/54b8/9343374/98d8aa04f7ab/41598_2022_17454_Fig10_HTML.jpg
https://cdn.ncbi.nlm.nih.gov/pmc/blobs/54b8/9343374/169d1adae70a/41598_2022_17454_Fig11_HTML.jpg

相似文献

1
Evaluating the efficiency of coarser to finer resolution multispectral satellites in mapping paddy rice fields using GEE implementation.利用 GEE 实现评估更粗分辨率到更细分辨率多光谱卫星在稻田制图中的效率。
Sci Rep. 2022 Aug 1;12(1):13210. doi: 10.1038/s41598-022-17454-y.
2
High resolution paddy rice maps in cloud-prone Bangladesh and Northeast India using Sentinel-1 data.利用 Sentinel-1 数据在孟加拉国和印度东北部多云地区制作高分辨率水稻图。
Sci Data. 2019 Apr 11;6(1):26. doi: 10.1038/s41597-019-0036-3.
3
Mapping paddy rice planting area in cold temperate climate region through analysis of time series Landsat 8 (OLI), Landsat 7 (ETM+) and MODIS imagery.通过分析Landsat 8(OLI)、Landsat 7(ETM+)和MODIS影像时间序列来绘制寒温带气候区的水稻种植面积。
ISPRS J Photogramm Remote Sens. 2015 Jul;105:220-233. doi: 10.1016/j.isprsjprs.2015.04.008. Epub 2015 May 4.
4
Mapping paddy rice planting area in northeastern Asia with Landsat 8 images, phenology-based algorithm and Google Earth Engine.利用Landsat 8影像、基于物候的算法和谷歌地球引擎绘制东北亚水稻种植面积图。
Remote Sens Environ. 2016 Nov;185:142-154. doi: 10.1016/j.rse.2016.02.016. Epub 2016 Mar 2.
5
Combined use of Landsat-8 and Sentinel-2A images for winter crop mapping and winter wheat yield assessment at regional scale.结合使用陆地卫星8号和哨兵2A号影像进行区域尺度的冬季作物制图和冬小麦产量评估。
AIMS Geosci. 2017;3(2):163-186. doi: 10.3934/geosci.2017.2.163. Epub 2017 May 23.
6
Mapping paddy rice planting area in rice-wetland coexistent areas through analysis of Landsat 8 OLI and MODIS images.通过分析陆地卫星8号OLI和中分辨率成像光谱仪(MODIS)图像绘制水稻-湿地共存区域的水稻种植面积
Int J Appl Earth Obs Geoinf. 2016 Apr;46:1-12. doi: 10.1016/j.jag.2015.11.001. Epub 2015 Nov 28.
7
Mapping paddy rice planting areas through time series analysis of MODIS land surface temperature and vegetation index data.通过MODIS地表温度和植被指数数据的时间序列分析绘制水稻种植区地图。
ISPRS J Photogramm Remote Sens. 2015 Aug;106:157-171. doi: 10.1016/j.isprsjprs.2015.05.011. Epub 2015 Jun 12.
8
Mapping paddy rice planting area in wheat-rice double-cropped areas through integration of Landsat-8 OLI, MODIS, and PALSAR images.通过整合陆地卫星8号OLI、中分辨率成像光谱仪(MODIS)和先进陆地观测卫星雷达(PALSAR)图像绘制稻麦两熟地区的水稻种植面积
Sci Rep. 2015 May 12;5:10088. doi: 10.1038/srep10088.
9
Object-Based Paddy Rice Mapping Using HJ-1A/B Data and Temporal Features Extracted from Time Series MODIS NDVI Data.基于HJ-1A/B数据和从MODIS NDVI时间序列数据中提取的时间特征的水稻目标分类制图
Sensors (Basel). 2016 Dec 22;17(1):10. doi: 10.3390/s17010010.
10
Spatiotemporal patterns of paddy rice croplands in China and India from 2000 to 2015.2000-2015 年中国和印度水稻种植区的时空格局。
Sci Total Environ. 2017 Feb 1;579:82-92. doi: 10.1016/j.scitotenv.2016.10.223. Epub 2016 Nov 17.

引用本文的文献

1
Identification of Paddy Croplands and Its Stages Using Remote Sensors: A Systematic Review.利用遥感技术识别稻田及其生长阶段:一项系统综述。
Sensors (Basel). 2023 Aug 3;23(15):6932. doi: 10.3390/s23156932.
2
Early-season and refined mapping of winter wheat based on phenology algorithms - a case of Shandong, China.基于物候算法的冬小麦早期精细测绘——以中国山东为例
Front Plant Sci. 2023 Jul 24;14:1016890. doi: 10.3389/fpls.2023.1016890. eCollection 2023.

本文引用的文献

1
Examining the effects of climate change on rice production: case study of Pakistan.探讨气候变化对水稻生产的影响:以巴基斯坦为例。
Environ Sci Pollut Res Int. 2020 Mar;27(8):7812-7822. doi: 10.1007/s11356-019-07486-9. Epub 2019 Dec 30.
2
Study of land cover/land use changes using RS and GIS: a case study of Multan district, Pakistan.利用遥感和 GIS 研究土地覆盖/土地利用变化:以巴基斯坦木尔坦地区为例。
Environ Monit Assess. 2019 Dec 2;192(1):2. doi: 10.1007/s10661-019-7959-1.
3
Using GIS tools to detect the land use/land cover changes during forty years in Lodhran District of Pakistan.
利用 GIS 工具探测巴基斯坦洛德拉区四十年来的土地利用/土地覆盖变化。
Environ Sci Pollut Res Int. 2020 Nov;27(32):39676-39692. doi: 10.1007/s11356-019-06072-3. Epub 2019 Aug 5.
4
High resolution paddy rice maps in cloud-prone Bangladesh and Northeast India using Sentinel-1 data.利用 Sentinel-1 数据在孟加拉国和印度东北部多云地区制作高分辨率水稻图。
Sci Data. 2019 Apr 11;6(1):26. doi: 10.1038/s41597-019-0036-3.
5
Integrated climate change risk assessment and evaluation of adaptation perspective in southern Punjab, Pakistan.巴基斯坦旁遮普省南部的综合气候变化风险评估和适应视角评价。
Sci Total Environ. 2018 Jul 1;628-629:1422-1436. doi: 10.1016/j.scitotenv.2018.02.129. Epub 2018 Feb 20.
6
Automatic and adaptive paddy rice mapping using Landsat images: Case study in Songnen Plain in Northeast China.利用 Landsat 图像进行自动和自适应的水稻田制图:以中国东北松嫩平原为例。
Sci Total Environ. 2017 Nov 15;598:581-592. doi: 10.1016/j.scitotenv.2017.03.221. Epub 2017 Apr 25.
7
Mapping paddy rice planting area in northeastern Asia with Landsat 8 images, phenology-based algorithm and Google Earth Engine.利用Landsat 8影像、基于物候的算法和谷歌地球引擎绘制东北亚水稻种植面积图。
Remote Sens Environ. 2016 Nov;185:142-154. doi: 10.1016/j.rse.2016.02.016. Epub 2016 Mar 2.
8
Spatiotemporal patterns of paddy rice croplands in China and India from 2000 to 2015.2000-2015 年中国和印度水稻种植区的时空格局。
Sci Total Environ. 2017 Feb 1;579:82-92. doi: 10.1016/j.scitotenv.2016.10.223. Epub 2016 Nov 17.
9
The climate hazards infrared precipitation with stations--a new environmental record for monitoring extremes.气候危害与站点的红外降水——一种新的极端环境监测记录。
Sci Data. 2015 Dec 8;2:150066. doi: 10.1038/sdata.2015.66.
10
Spatiotemporal analysis of land use and land cover change in the Brazilian Amazon.巴西亚马逊地区土地利用与土地覆盖变化的时空分析。
Int J Remote Sens. 2013;34(16):5953-5978. doi: 10.1080/01431161.2013.802825.