Leonard D. Schaeffer Center for Health Policy & Economics, Price School of Public Policy, University of Southern California, Los Angeles.
JAMA Health Forum. 2021 Nov 5;2(11):e213409. doi: 10.1001/jamahealthforum.2021.3409. eCollection 2021 Nov.
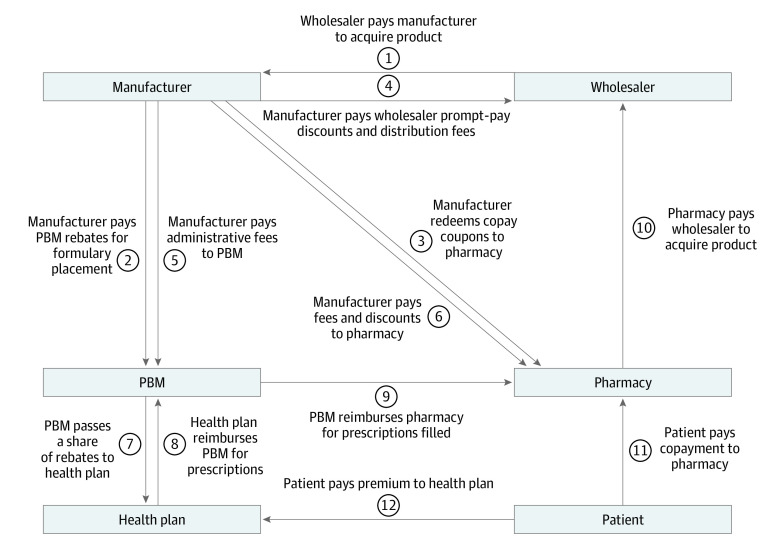
Recent US media and policy attention on insulin affordability has focused on the role of manufacturers in setting prices; however, the role of other drug distribution intermediaries in determining prices has received less attention.
To estimate the share of net expenditures on insulin captured by manufacturers, wholesalers, pharmacy benefit managers, pharmacies, and health plans from 2014 to 2018.
This cross-sectional study of the US insulin market was conducted in 2020 using 2014-2018 data from multiple sources, including list and estimated net prices from SSR Health for 32 insulin products, mean use weights from a commercial pharmacy claims database, mean acquisition costs and reimbursements from the Centers for Medicare & Medicaid Services, mean spread and share of rebates retained by pharmacy benefit managers from state Medicaid and drug transparency reports, and profit margins from the public filings of distribution system participant companies. Participants were insulin manufacturers, drug wholesalers, pharmacies, pharmacy benefit managers, and health plans.
Mean list and net insulin prices, mean net expenditures on insulin, share of expenditures retained by each distribution system participant.
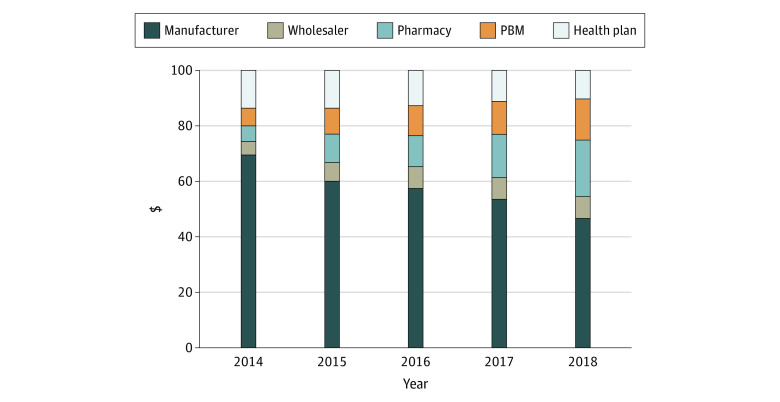
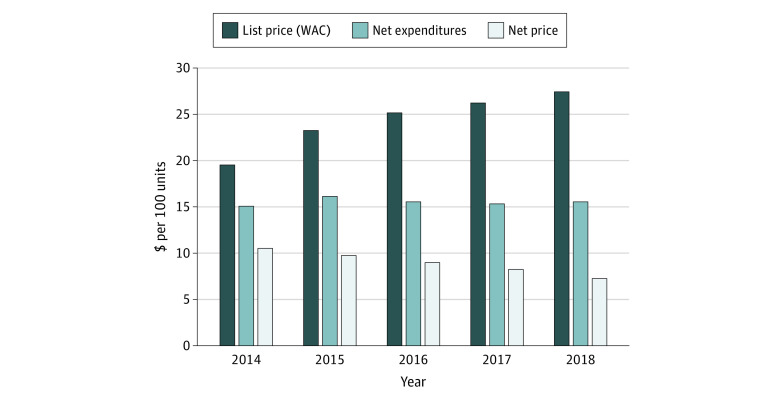
Between 2014 and 2018, mean list prices of 32 insulin products increased by 40.1% (from $19.60 to $27.45), while mean net prices received by manufacturers decreased by 30.8% (from $10.53 to $7.29). Net expenditures per 100 units of insulin increased by 3.2% (from $15.11 to $15.59) while the share of a hypothetical $100 insulin expenditure accruing to manufacturers decreased by 33.0% (from $69.71 to $46.73) and the share accruing to health plans decreased by 24.7% (from $13.82 to $10.40). The share of insulin expenditures retained by pharmacy benefit managers increased by 154.6% (from $5.64 to $14.36), the share retained by pharmacies increased by 228.8% (from $6.21 to $20.42), and the share retained by wholesalers increased by 74.7% (from $4.63 to $8.09).
Results of this cross-sectional study of the distribution of insulin expenditures suggest that policies to control insulin costs should consider all entities throughout the insulin distribution system. Manufacturers represented a decreasing share of insulin expenditures, and pharmacies, pharmacy benefit managers, and wholesalers accounted for a growing share; all entities play a role in increasing insulin costs.
最近美国媒体和政策对胰岛素可负担性的关注集中在制造商在定价方面的作用上;然而,其他药品分销中介在确定价格方面的作用却受到较少关注。
估计 2014 年至 2018 年期间,制造商、批发商、药品福利管理公司、药店和健康计划从胰岛素中获得的净支出份额。
这项对美国胰岛素市场的横断面研究于 2020 年进行,使用了来自多个来源的 2014-2018 年数据,包括 SSR Health 提供的 32 种胰岛素产品的目录和估计净价格、商业药房索赔数据库中的平均使用权重、医疗保险和医疗补助服务中心的平均收购成本和报销、州医疗补助和药品透明度报告中药品福利管理公司保留的回扣率以及分销系统参与者公司的公开备案中的利润率。参与者为胰岛素制造商、药品批发商、药店、药品福利管理公司和健康计划。
32 种胰岛素产品的平均目录和净价格、制造商获得的平均净胰岛素支出、每个分销系统参与者保留的支出份额。
2014 年至 2018 年间,32 种胰岛素产品的平均目录价格上涨了 40.1%(从 19.60 美元涨至 27.45 美元),而制造商获得的平均净价格却下降了 30.8%(从 10.53 美元降至 7.29 美元)。每 100 单位胰岛素的净支出增长了 3.2%(从 15.11 美元涨至 15.59 美元),而假设 100 美元胰岛素支出中归制造商的份额下降了 33.0%(从 69.71 美元降至 46.73 美元),归健康计划的份额下降了 24.7%(从 13.82 美元降至 10.40 美元)。药品福利管理公司保留的胰岛素支出份额增加了 154.6%(从 5.64 美元增至 14.36 美元),药店保留的胰岛素支出份额增加了 228.8%(从 6.21 美元增至 20.42 美元),批发商保留的胰岛素支出份额增加了 74.7%(从 4.63 美元增至 8.09 美元)。
这项对胰岛素支出分配的横断面研究结果表明,控制胰岛素成本的政策应考虑胰岛素分销系统中的所有实体。制造商在胰岛素支出中的份额下降,而药店、药品福利管理公司和批发商的份额上升;所有实体都在增加胰岛素成本方面发挥了作用。