MS Center Amsterdam, Radiology and Nuclear Medicine, Amsterdam Neuroscience, Amsterdam UMC Location VUmc, De Boelelaan 1118, 1081 HZ Amsterdam, the Netherlands.
Department of Medicine, Surgery and Neuroscience, University of Siena, 53100 Siena, Italy; Siena Imaging SRL, 53100 Siena, Italy.
Neuroimage Clin. 2022;36:103220. doi: 10.1016/j.nicl.2022.103220. Epub 2022 Oct 3.
White matter lesions and brain atrophy are both present early in multiple sclerosis. However, the spatio-temporal relationship between atrophy and lesion processes remains unclear.
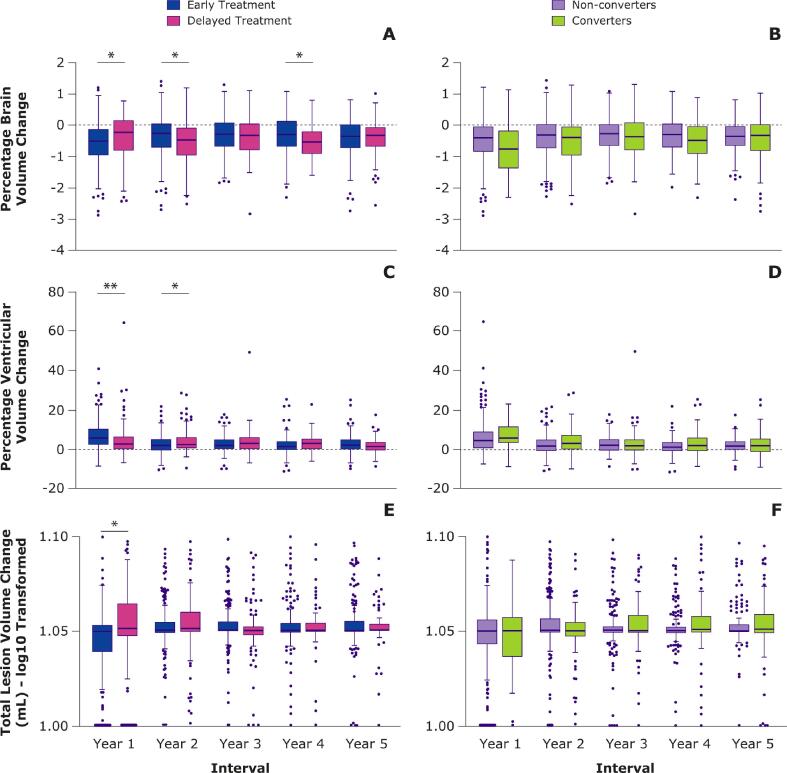
Yearly magnetic resonance images were analyzed in 392 patients with clinically isolated syndrome from the 5-year REFLEX/REFLEXION studies. Patients received early treatment (from baseline; N = 262) or delayed treatment (from month-24; N = 130) with subcutaneous interferon beta-1a. Global and central atrophy were assessed using FSL-SIENA to provide yearly percentage volume change of brain and ventricles, respectively. Yearly total lesion volume change was calculated by subtracting the sum of the negative lesion volume change (disappearing + shrinking) from the positive lesion volume change (new + enlarging) for each yearly interval, as determined by an in-house developed semi-automated method. Using linear mixed models, during the period where patients had received ≥1 year of treatment, we investigated whether total lesion volume change was associated with percentage brain volume change or percentage ventricular volume change in the next year, and vice versa.
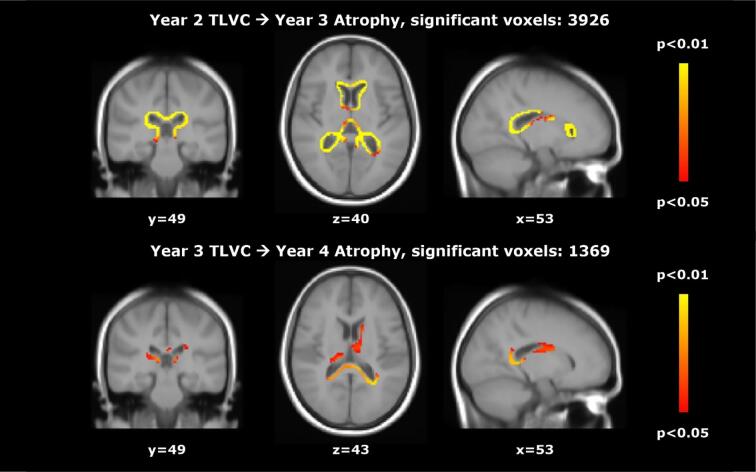
Higher total lesion volume change was related to significantly faster global atrophy (percentage brain volume change) in the next year (B = - 0.113, SE = 0.022, p < 0.001). In patients receiving early treatment only, total lesion volume change was also associated with percentage ventricular volume change in the next year (B = 1.348, SE = 0.181, p < 0.001). Voxel-wise analyses showed that in patients receiving early treatment, higher total lesion volume change in years 2, 3, and 4 was related to faster atrophy in the next year, and in year 4 this relationship was stronger in patients receiving delayed treatment. Interestingly, faster atrophy was related to higher total lesion volume change in the next year (percentage brain volume change: B = - 0.136, SE = 0.062, p = 0.028; percentage ventricular volume change: B = 0.028, SE = 0.008, p < 0.001).
Higher lesion volume changes were associated with faster atrophy in the next year. Interestingly, there was also an association between faster atrophy and higher lesion volume changes in the next year.
脑白质病变和脑萎缩在多发性硬化症早期均存在。然而,萎缩和病变过程之间的时空关系仍不清楚。
对 REFLEX/REFLEXION 研究中 392 例临床孤立综合征患者的每年磁共振图像进行分析。患者接受皮下注射干扰素 beta-1a 进行早期治疗(从基线开始;n=262)或延迟治疗(从第 24 个月开始;n=130)。使用 FSL-SIENA 评估全脑和中央萎缩,分别提供脑和脑室的每年体积变化百分比。通过内部开发的半自动方法,每年间隔从阳性病变体积变化(新增大)中减去阴性病变体积变化(消失+缩小)的总和,计算每年总病变体积变化。使用线性混合模型,在患者接受至少 1 年治疗的期间,我们研究了下一年总病变体积变化是否与下一年的脑容量变化百分比或脑室容量变化百分比相关,反之亦然。
更高的总病变体积变化与下一年全脑萎缩(脑容量变化百分比)显著加快相关(B=-0.113,SE=0.022,p<0.001)。仅接受早期治疗的患者中,总病变体积变化也与下一年脑室容量变化百分比相关(B=1.348,SE=0.181,p<0.001)。体素分析显示,在接受早期治疗的患者中,第 2、3 和 4 年的总病变体积变化较高与下一年的萎缩较快相关,而在第 4 年,接受延迟治疗的患者的这种关系更强。有趣的是,更快的萎缩与下一年更高的总病变体积变化相关(脑容量变化百分比:B=-0.136,SE=0.062,p=0.028;脑室容量变化百分比:B=0.028,SE=0.008,p<0.001)。
更高的病变体积变化与下一年的萎缩较快相关。有趣的是,下一年的萎缩较快也与更高的病变体积变化相关。