• 文献检索
  • 文档翻译
  • 深度研究
  • 学术资讯
  • Suppr Zotero 插件Zotero 插件
  • 邀请有礼
  • 套餐&价格
  • 历史记录
应用&插件
Suppr Zotero 插件Zotero 插件浏览器插件Mac 客户端Windows 客户端微信小程序
定价
高级版会员购买积分包购买API积分包
服务
文献检索文档翻译深度研究API 文档MCP 服务
关于我们
关于 Suppr公司介绍联系我们用户协议隐私条款
关注我们

Suppr 超能文献

核心技术专利:CN118964589B侵权必究
粤ICP备2023148730 号-1Suppr @ 2026

文献检索

告别复杂PubMed语法,用中文像聊天一样搜索,搜遍4000万医学文献。AI智能推荐,让科研检索更轻松。

立即免费搜索

文件翻译

保留排版,准确专业,支持PDF/Word/PPT等文件格式,支持 12+语言互译。

免费翻译文档

深度研究

AI帮你快速写综述,25分钟生成高质量综述,智能提取关键信息,辅助科研写作。

立即免费体验

社区排放制图操作(NEMO):美国的一个 1 公里人为排放数据集。

Neighborhood Emission Mapping Operation (NEMO): A 1-km anthropogenic emission dataset in the United States.

机构信息

Department of Atmospheric, Oceanic and Earth Sciences, George Mason University, Fairfax, VA, 22030, USA.

出版信息

Sci Data. 2022 Nov 9;9(1):680. doi: 10.1038/s41597-022-01790-9.

DOI:10.1038/s41597-022-01790-9
PMID:36351966
原文链接:https://pmc.ncbi.nlm.nih.gov/articles/PMC9646775/
Abstract

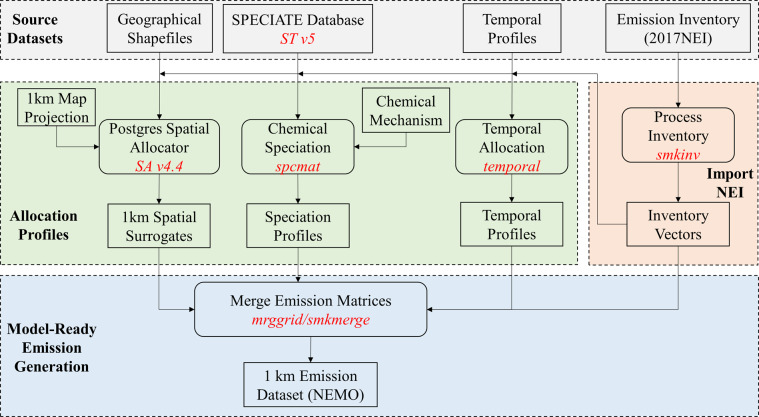
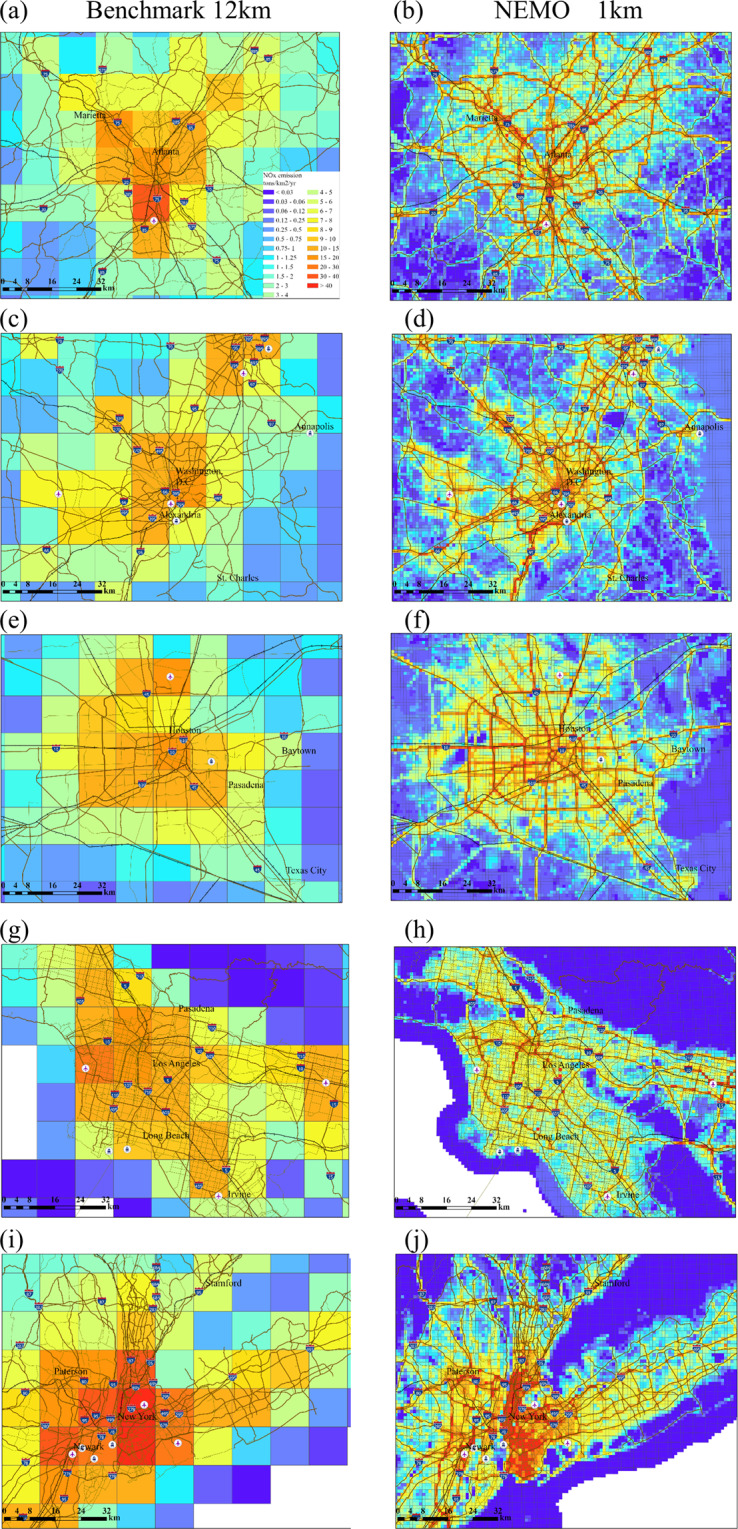
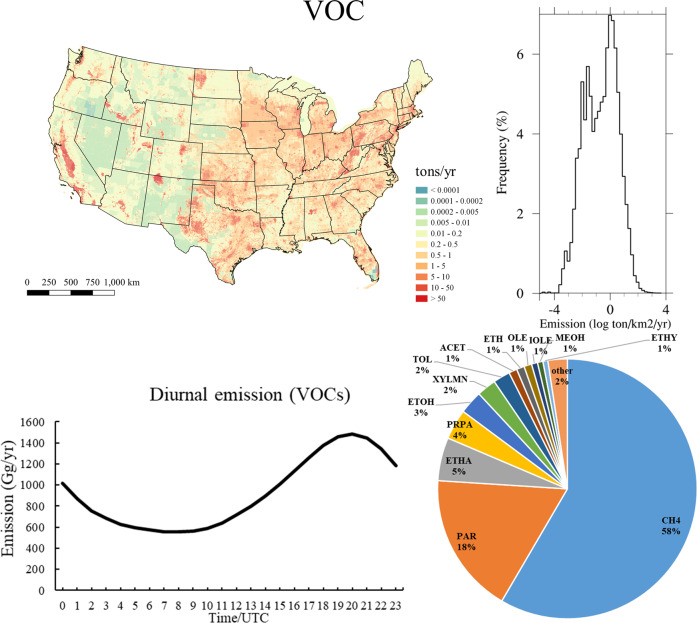
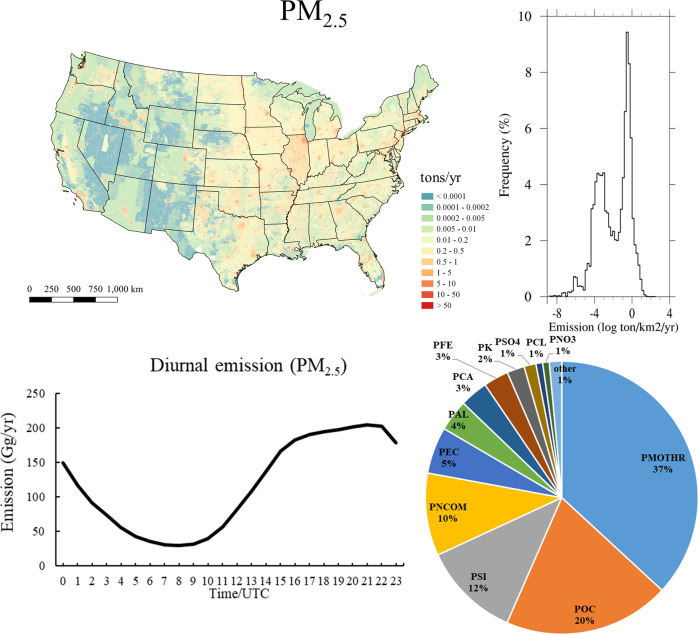
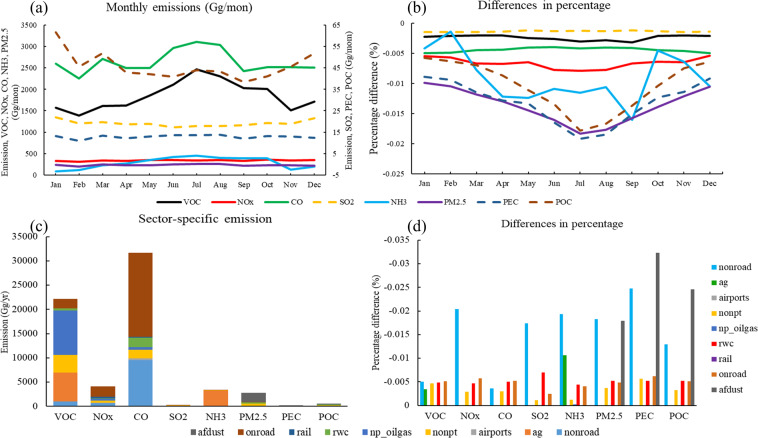
We present an unprecedented effort to map anthropogenic emissions of air pollutants at 1 km spatial resolution in the contiguous United States (CONUS). This new dataset, Neighborhood Emission Mapping Operation (NEMO), is produced at hourly intervals based on the United States Environmental Protection Agency (US EPA) National Emission Inventories 2017. Fine-scale spatial allocation was achieved through distributing the emission sources using 108 spatial surrogates, factors representing the portion of a source in each 1 km grid. Gaseous and particulate pollutants are speciated into model species for the Carbon Bond 6 chemical mechanism. All sources are grouped in 9 sectors and stored in NetCDF format for air quality models, and in shapefile format for GIS users and air quality managers. This dataset shows good consistency with the USEPA benchmark dataset, with a monthly difference in emissions less than 0.03% for any sector. NEMO provides the first 1 km mapping of air pollution over the CONUS, enabling new applications such as fine-scale air quality modeling, air pollution exposure assessment, and environmental justice studies.

摘要

我们首次以 1 公里的空间分辨率绘制了美国本土(CONUS)人为空气污染物排放图。这个新数据集名为 Neighborhood Emission Mapping Operation(NEMO),是基于美国环境保护署(US EPA)2017 年国家排放清单以每小时为间隔制作的。通过使用 108 个空间替代物将排放源分配到各个 1 公里网格中,实现了精细的空间分配,这些替代物代表了每个源在每个 1 公里网格中的部分。气态和颗粒污染物根据碳键 6 化学机制被分类为模型物质。所有的污染源都被分为 9 个行业,并以 NetCDF 格式存储,用于空气质量模型,以 shapefile 格式存储,供 GIS 用户和空气质量管理人员使用。该数据集与美国环保署的基准数据集具有很好的一致性,任何行业的排放月度差异都小于 0.03%。NEMO 提供了美国本土的首个 1 公里空气污染图,可用于空气质量模型、空气污染暴露评估和环境正义研究等新应用。

https://cdn.ncbi.nlm.nih.gov/pmc/blobs/f7fe/9646775/0a0b20ebfd7a/41597_2022_1790_Fig5_HTML.jpg
https://cdn.ncbi.nlm.nih.gov/pmc/blobs/f7fe/9646775/67ad74bae79d/41597_2022_1790_Fig1_HTML.jpg
https://cdn.ncbi.nlm.nih.gov/pmc/blobs/f7fe/9646775/d99a162fd5eb/41597_2022_1790_Fig2_HTML.jpg
https://cdn.ncbi.nlm.nih.gov/pmc/blobs/f7fe/9646775/c545f44140a9/41597_2022_1790_Fig3_HTML.jpg
https://cdn.ncbi.nlm.nih.gov/pmc/blobs/f7fe/9646775/9c1f06aaed97/41597_2022_1790_Fig4_HTML.jpg
https://cdn.ncbi.nlm.nih.gov/pmc/blobs/f7fe/9646775/0a0b20ebfd7a/41597_2022_1790_Fig5_HTML.jpg

相似文献

1
Neighborhood Emission Mapping Operation (NEMO): A 1-km anthropogenic emission dataset in the United States.社区排放制图操作(NEMO):美国的一个 1 公里人为排放数据集。
Sci Data. 2022 Nov 9;9(1):680. doi: 10.1038/s41597-022-01790-9.
2
Air pollutant source characterization using the revised regional haze tracking metric and a photochemical grid model and implications for regional haze planning.利用修订后的区域霾跟踪指标和光化学网格模型进行空气污染物源特征描述及其对区域霾规划的影响。
J Air Waste Manag Assoc. 2019 Mar;69(3):373-390. doi: 10.1080/10962247.2018.1537985. Epub 2019 Jan 9.
3
Air toxics exposure from vehicle emissions at a U.S. border crossing: Buffalo Peace Bridge Study.美国边境口岸车辆排放造成的空气有毒物质暴露:布法罗和平桥研究
Res Rep Health Eff Inst. 2011 Jul(158):5-132.
4
Development and application of an aerosol screening model for size-resolved urban aerosols.用于粒径分辨的城市气溶胶的气溶胶筛选模型的开发与应用。
Res Rep Health Eff Inst. 2014 Jun(179):3-79.
5
MOVES-Matrix for high-performance on-road energy and running emission rate modeling applications.MOVES 模型——用于高性能道路能源和行驶排放率建模应用的矩阵。
J Air Waste Manag Assoc. 2019 Dec;69(12):1415-1428. doi: 10.1080/10962247.2019.1640806. Epub 2019 Oct 28.
6
Trends and spatial patterns of fine-resolution aerosol optical depth-derived PM emissions in the Northeast United States from 2002 to 2013.2002年至2013年美国东北部基于高分辨率气溶胶光学厚度推导的颗粒物排放趋势及空间格局
J Air Waste Manag Assoc. 2017 Jan;67(1):64-74. doi: 10.1080/10962247.2016.1218393.
7
Assessing the manageable portion of ground-level ozone in the contiguous United States.评估美国本土可管理部分的地面臭氧。
J Air Waste Manag Assoc. 2020 Nov;70(11):1136-1147. doi: 10.1080/10962247.2020.1805375.
8
Criteria and air-toxic emissions from in-use automobiles in the National Low-Emission Vehicle program.
J Air Waste Manag Assoc. 2005 Sep;55(9):1263-8. doi: 10.1080/10473289.2005.10464722.
9
Real-World Vehicle Emissions Characterization for the Shing Mun Tunnel in Hong Kong and Fort McHenry Tunnel in the United States.香港城门隧道和美国麦克亨利堡隧道的实际车辆排放特征
Res Rep Health Eff Inst. 2019 Mar;2019(199):5-52.
10
Part 1. Statistical Learning Methods for the Effects of Multiple Air Pollution Constituents.第1部分. 多种空气污染成分影响的统计学习方法
Res Rep Health Eff Inst. 2015 Jun(183 Pt 1-2):5-50.

引用本文的文献

1
Intercomparison of Modeled Urban-Scale Vehicle NO and PM Emissions-Implications for Equity Assessments.城市尺度车辆氮氧化物和颗粒物排放模型的相互比较——对公平性评估的启示
Environ Sci Technol. 2025 Mar 11;59(9):4560-4570. doi: 10.1021/acs.est.4c09777. Epub 2025 Feb 27.
2
PM exposure disparities persist despite strict vehicle emissions controls in California.尽管加利福尼亚州实施了严格的车辆排放标准,但 PM 暴露的差异仍然存在。
Sci Adv. 2024 Sep 13;10(37):eadn8544. doi: 10.1126/sciadv.adn8544. Epub 2024 Sep 11.
3
Air pollution impacts from warehousing in the United States uncovered with satellite data.

本文引用的文献

1
Satellite Monitoring for Air Quality and Health.卫星监测空气质量与健康。
Annu Rev Biomed Data Sci. 2021 Jul 20;4:417-447. doi: 10.1146/annurev-biodatasci-110920-093120. Epub 2021 Jun 1.
2
Identifying hotspots based on high-resolution emission inventory of volatile organic compounds: A case study in China.基于挥发性有机物高分辨率排放清单识别热点地区:以中国为例。
J Environ Manage. 2021 Jun 15;288:112419. doi: 10.1016/j.jenvman.2021.112419. Epub 2021 Apr 7.
3
The Vulcan Version 3.0 High-Resolution Fossil Fuel CO Emissions for the United States.
利用卫星数据发现美国仓储业对空气污染的影响。
Nat Commun. 2024 Jul 24;15(1):6006. doi: 10.1038/s41467-024-50000-0.
4
State-of-the-Science Data and Methods Need to Guide Place-Based Efforts to Reduce Air Pollution Inequity.科学现状数据和方法需要指导基于地点的减少空气污染不平等的努力。
Environ Health Perspect. 2023 Dec;131(12):125003. doi: 10.1289/EHP13063. Epub 2023 Dec 18.
5
Healthy Cities, A comprehensive dataset for environmental determinants of health in England cities.健康城市:英格兰城市健康环境决定因素的综合数据集。
Sci Data. 2023 Mar 25;10(1):165. doi: 10.1038/s41597-023-02060-y.
美国的“瓦肯3.0版”高分辨率化石燃料一氧化碳排放
J Geophys Res Atmos. 2020 Oct 16;125(19):e2020JD032974. doi: 10.1029/2020JD032974. Epub 2020 Oct 5.
4
Assessment of NO observations during DISCOVER-AQ and KORUS-AQ field campaigns.在“大气成分观测和垂直结构探测与分析(DISCOVER-AQ)”及“美韩空气质量与气候联合观测研究(KORUS-AQ)”实地考察期间对一氧化氮观测数据的评估。
Atmos Meas Tech. 2020 May 19;13(5). doi: 10.5194/amt-13-2523-2020.
5
Estimating daily PM concentrations in New York City at the neighborhood-scale: Implications for integrating non-regulatory measurements.估算纽约市邻里尺度的日 PM 浓度:整合非监管测量的意义。
Sci Total Environ. 2019 Dec 20;697:134094. doi: 10.1016/j.scitotenv.2019.134094. Epub 2019 Aug 27.
6
Acid rain and air pollution: 50 years of progress in environmental science and policy.酸雨和空气污染:环境科学和政策 50 年的进展。
Ambio. 2020 Apr;49(4):849-864. doi: 10.1007/s13280-019-01244-4. Epub 2019 Sep 21.
7
Improvement of a Global High-Resolution Ammonia Emission Inventory for Combustion and Industrial Sources with New Data from the Residential and Transportation Sectors.利用住宅和交通领域的新数据改进全球燃烧和工业源高分辨率氨排放清单。
Environ Sci Technol. 2017 Mar 7;51(5):2821-2829. doi: 10.1021/acs.est.6b03694. Epub 2017 Feb 13.
8
A review of AirQ Models and their applications for forecasting the air pollution health outcomes.空气品质模型及其在空气污染健康影响预测中的应用综述。
Environ Sci Pollut Res Int. 2017 Mar;24(7):6426-6445. doi: 10.1007/s11356-016-8180-1. Epub 2017 Jan 4.
9
National Spatiotemporal Exposure Surface for NO2: Monthly Scaling of a Satellite-Derived Land-Use Regression, 2000-2010.全国时空 NO2 暴露面:基于卫星反演的土地利用回归模型的月度尺度扩展,2000-2010 年。
Environ Sci Technol. 2015 Oct 20;49(20):12297-305. doi: 10.1021/acs.est.5b02882. Epub 2015 Oct 9.
10
Exposure to ambient black carbon derived from a unique inventory and high-resolution model.接触源自独特清单和高分辨率模型的环境黑碳。
Proc Natl Acad Sci U S A. 2014 Feb 18;111(7):2459-63. doi: 10.1073/pnas.1318763111. Epub 2014 Jan 27.