Huang Chung-Chien, Effendi Fransisca Fortunata, Kosik Russell Oliver, Lee Wen-Jeng, Wang Li-Jen, Juan Chun-Jung, Chan Wing P
International Ph.D. Program In BioTech And Healthcare Management, Department of Health Care Administration, College of Management, Taipei Medical University, Taipei, Taiwan.
Department of Medical Quality, Wan Fang Hospital, Taipei Medical University, Taipei, Taiwan.
Insights Imaging. 2023 Feb 3;14(1):23. doi: 10.1186/s13244-023-01364-2.
This population-based study aimed to collect, analyze, and summarize the long-term trends in medical imaging use in Taiwan.
A retrospective cohort population-based study of medical imaging usage for the individuals who received care under the National Health Insurance system from 2000 to 2017. CT and MRI utilization rates were determined overall as well as across certain variables including patient age, hospital type, health care type, hospital characteristics, and geographic area.
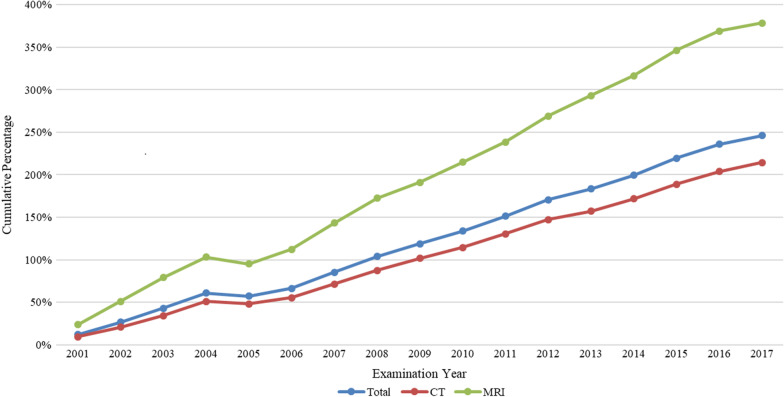
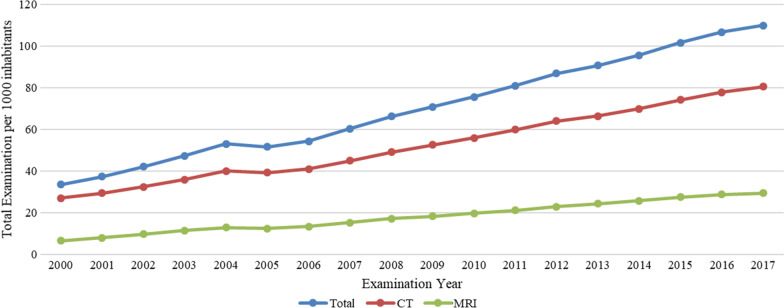
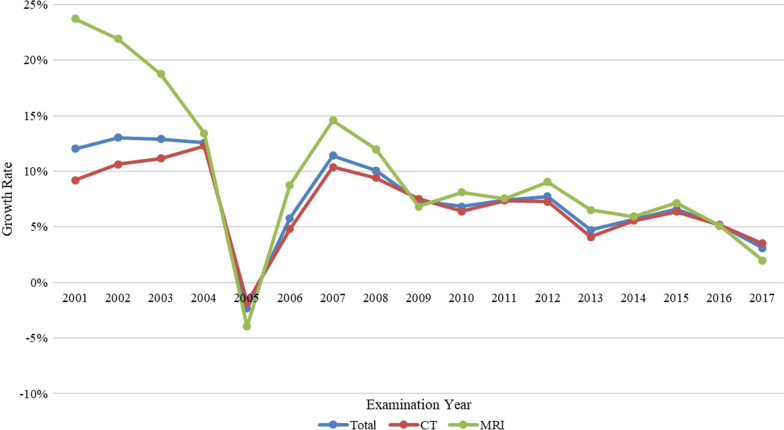
Individuals registered in our health insurance system have received 21,766,745 CT scans and 7,520,088 MRI scans from 2000 to 2017. Annual growth rates for both imaging types were positive over that period, though growth rates have slowed in recent years. The growth rate for CT use was greatest (9-12%) between 2001 and 2004, dropped to 2% in 2005, then generally rose thereafter, reaching 3% in 2017. Similarly, MRI use growth peaked at 24% between 2001 and 2003, dropped to 4% in 2005, then increased in a fluctuating manner, reaching 2% in 2017.
Over the past 2 decades, CT and MRI use in Taiwan has increased sharply, especially in the oldest age group (≥ 60 years old), but growth rates have slowed in recent years. Increases in imaging use have corresponded with improved clinical outcomes, including greater life expectancy and reduced mortality rates, though further assessment is required to demonstrate a direct link with imaging. Nevertheless, the better clinical outcomes are also predisposed by the comprehensive care covered by the NHI system.
本基于人群的研究旨在收集、分析和总结台湾医学影像使用的长期趋势。
对2000年至2017年在国民健康保险系统接受治疗的个体进行基于人群的回顾性队列研究,分析医学影像使用情况。总体以及按患者年龄、医院类型、医疗保健类型、医院特征和地理区域等特定变量确定CT和MRI利用率。
2000年至2017年,在我们医疗保险系统登记的个体接受了21,766,745次CT扫描和7,520,088次MRI扫描。在此期间,两种影像类型的年增长率均为正值,不过近年来增长率有所放缓。CT使用增长率在2001年至2004年期间最高(9%-12%),2005年降至2%,此后总体上升,2017年达到3%。同样,MRI使用增长率在2001年至2003年期间达到峰值24%,2005年降至4%,然后以波动方式增加,2017年达到2%。
在过去20年中,台湾的CT和MRI使用量急剧增加,尤其是在最年长年龄组(≥60岁),但近年来增长率有所放缓。影像使用量的增加与临床结果改善相对应,包括更高的预期寿命和更低的死亡率,不过需要进一步评估以证明与影像检查有直接联系。尽管如此,更好的临床结果也得益于国民健康保险系统提供的全面护理。