Translational Imaging in Neurology (ThINK) Basel, Department of Biomedical Engineering, Faculty of Medicine, University Hospital Basel and University of Basel, Basel, Switzerland; Department of Neurology, University Hospital Basel, Switzerland; Research Center for Clinical Neuroimmunology and Neuroscience Basel (RC2NB), University Hospital Basel and University of Basel, Basel, Switzerland.
Translational Imaging in Neurology (ThINK) Basel, Department of Biomedical Engineering, Faculty of Medicine, University Hospital Basel and University of Basel, Basel, Switzerland; Department of Neurology, University Hospital Basel, Switzerland; Research Center for Clinical Neuroimmunology and Neuroscience Basel (RC2NB), University Hospital Basel and University of Basel, Basel, Switzerland; Division of Radiological Physics, Department of Radiology, University Hospital Basel, Basel, Switzerland.
Neuroimage Clin. 2023;37:103349. doi: 10.1016/j.nicl.2023.103349. Epub 2023 Feb 13.
Quantitative MRI (qMRI) has greatly improved the sensitivity and specificity of microstructural brain pathology in multiple sclerosis (MS) when compared to conventional MRI (cMRI). More than cMRI, qMRI also provides means to assess pathology within the normal-appearing and lesion tissue. In this work, we further developed a method providing personalized quantitative T1 (qT1) abnormality maps in individual MS patients by modeling the age dependence of qT1 alterations. In addition, we assessed the relationship between qT1 abnormality maps and patients' disability, in order to evaluate the potential value of this measurement in clinical practice.
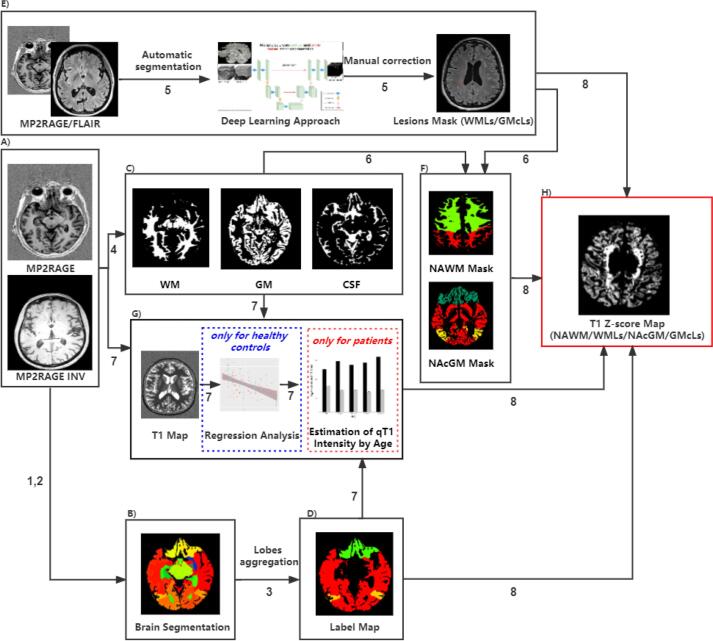
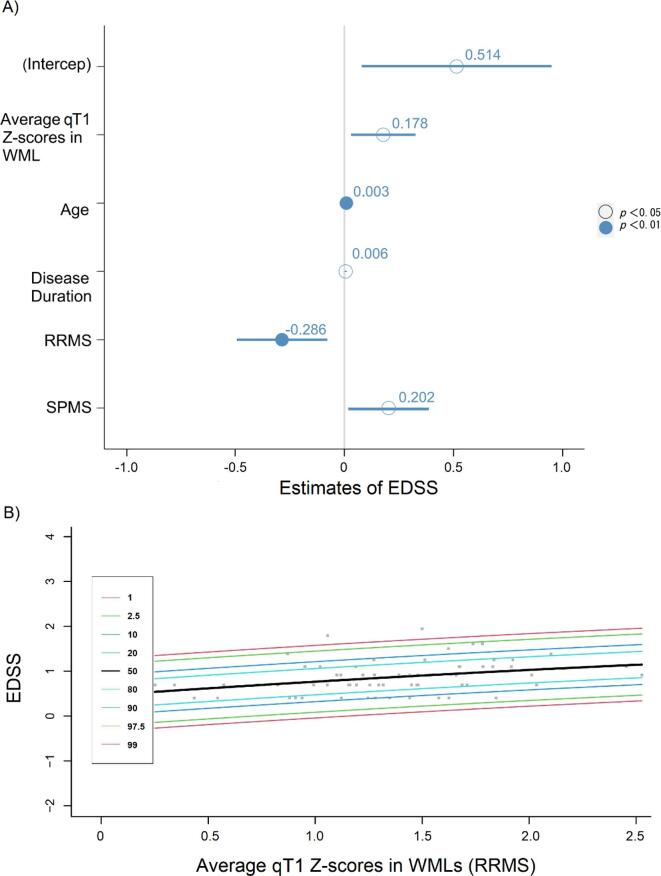
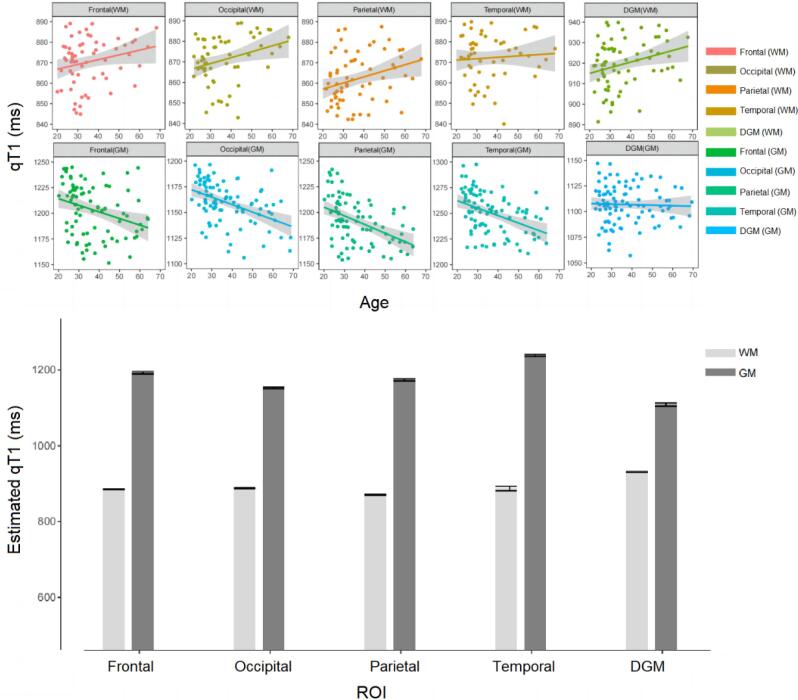
We included 119 MS patients (64 relapsing-remitting MS (RRMS), 34 secondary progressive MS (SPMS), 21 primary progressive MS (PPMS)), and 98 Healthy Controls (HC). All individuals underwent 3T MRI examinations, including Magnetization Prepared 2 Rapid Acquisition Gradient Echoes (MP2RAGE) for qT1 maps and High-Resolution 3D Fluid Attenuated Inversion Recovery (FLAIR) imaging. To calculate personalized qT1 abnormality maps, we compared qT1 in each brain voxel in MS patients to the average qT1 obtained in the same tissue (grey/white matter) and region of interest (ROI) in healthy controls, hereby providing individual voxel-based Z-score maps. The age dependence of qT1 in HC was modeled using linear polynomial regression. We computed the average qT1 Z-scores in white matter lesions (WMLs), normal-appearing white matter (NAWM), cortical grey matter lesions (GMcLs) and normal-appearing cortical grey matter (NAcGM). Lastly, a multiple linear regression (MLR) model with the backward selection including age, sex, disease duration, phenotype, lesion number, lesion volume and average Z-score (NAWM/NAcGM/WMLs/GMcLs) was used to assess the relationship between qT1 measures and clinical disability (evaluated with EDSS).
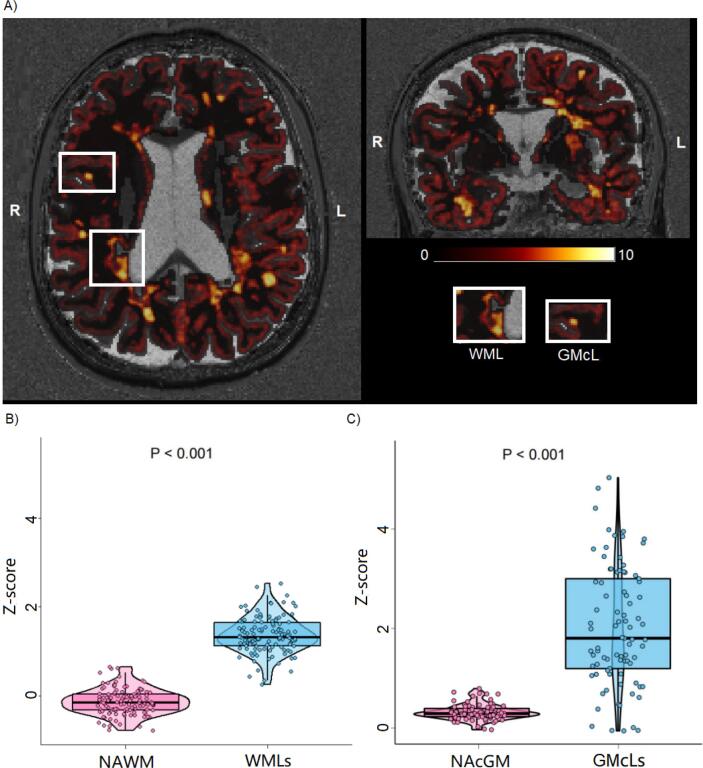
The average qT1 Z-score was higher in WMLs than in NAWM. (WMLs: 1.366 ± 0.409, NAWM: -0.133 ± 0.288, [mean ± SD], p < 0.001). The average Z-score in NAWM in RRMS patients was significantly lower than in PPMS patients (p = 0.010). The MLR model showed a strong association between average qT1 Z-scores in white matter lesions (WMLs) and EDSS (R = 0.549, β = 0.178, 97.5 % CI = 0.030 to 0.326, p = 0.019). Specifically, we measured a 26.9 % increase in EDSS per unit of qT1 Z-score in WMLs in RRMS patients (R = 0.099, β = 0.269, 97.5 % CI = 0.078 to 0.461, p = 0.007).
We showed that personalized qT1 abnormality maps in MS patients provide measures related to clinical disability, supporting the use of those maps in clinical practice.
与常规 MRI(cMRI)相比,定量 MRI(qMRI)极大地提高了多发性硬化症(MS)患者的微观结构脑病理学的敏感性和特异性。与 cMRI 相比,qMRI 还提供了评估正常表现和病变组织内病理学的手段。在这项工作中,我们通过建模 qT1 改变的年龄依赖性,进一步开发了一种为个体 MS 患者提供个性化定量 T1(qT1)异常图的方法。此外,我们评估了 qT1 异常图与患者残疾之间的关系,以评估该测量在临床实践中的潜在价值。
我们纳入了 119 名 MS 患者(64 名复发缓解型 MS(RRMS),34 名继发进展型 MS(SPMS),21 名原发进展型 MS(PPMS))和 98 名健康对照者(HC)。所有个体均接受了 3T MRI 检查,包括用于 qT1 图谱的磁化准备 2 快速获取梯度回波(MP2RAGE)和高分辨率 3D 液体衰减反转恢复(FLAIR)成像。为了计算个性化 qT1 异常图,我们将 MS 患者每个脑区的 qT1 与健康对照者同一组织(灰质/白质)和感兴趣区(ROI)中的平均 qT1 进行比较,从而提供个体体素基于 Z 分数图。HC 中 qT1 的年龄依赖性通过线性多项式回归进行建模。我们计算了白质病变(WMLs)、正常表现白质(NAWM)、皮质灰质病变(GMcLs)和正常表现皮质灰质(NAcGM)中 qT1 Z 分数的平均值。最后,使用具有向后选择的多元线性回归(MLR)模型,包括年龄、性别、疾病持续时间、表型、病变数量、病变体积和平均 Z 分数(NAWM/NAcGM/WMLs/GMcLs),评估 qT1 测量值与临床残疾(用 EDSS 评估)之间的关系。
WMLs 中的平均 qT1 Z 分数高于 NAWM。(WMLs:1.366±0.409,NAWM:-0.133±0.288,[平均值±标准差],p<0.001)。RRMS 患者的 NAWM 平均 Z 分数明显低于 PPMS 患者(p=0.010)。MLR 模型显示白质病变(WMLs)的平均 qT1 Z 分数与 EDSS 之间存在很强的相关性(R=0.549,β=0.178,97.5%CI=0.030 至 0.326,p=0.019)。具体来说,我们在 RRMS 患者中测量到 WMLs 中 qT1 Z 分数每增加一个单位,EDSS 增加 26.9%(R=0.099,β=0.269,97.5%CI=0.078 至 0.461,p=0.007)。
我们表明,MS 患者的个性化 qT1 异常图提供了与临床残疾相关的测量值,支持在临床实践中使用这些图谱。