• 文献检索
  • 文档翻译
  • 深度研究
  • 学术资讯
  • Suppr Zotero 插件Zotero 插件
  • 邀请有礼
  • 套餐&价格
  • 历史记录
应用&插件
Suppr Zotero 插件Zotero 插件浏览器插件Mac 客户端Windows 客户端微信小程序
定价
高级版会员购买积分包购买API积分包
服务
文献检索文档翻译深度研究API 文档MCP 服务
关于我们
关于 Suppr公司介绍联系我们用户协议隐私条款
关注我们

Suppr 超能文献

核心技术专利:CN118964589B侵权必究
粤ICP备2023148730 号-1Suppr @ 2026

文献检索

告别复杂PubMed语法,用中文像聊天一样搜索,搜遍4000万医学文献。AI智能推荐,让科研检索更轻松。

立即免费搜索

文件翻译

保留排版,准确专业,支持PDF/Word/PPT等文件格式,支持 12+语言互译。

免费翻译文档

深度研究

AI帮你快速写综述,25分钟生成高质量综述,智能提取关键信息,辅助科研写作。

立即免费体验

印度洋-太平洋暖池上空的高浓度 CO 集气层。

A high concentration CO pool over the Indo-Pacific Warm Pool.

机构信息

CORAL, Indian Institute of Technology Kharagpur, Kharagpur, West Bengal, 721302, India.

Indian National Centre for Ocean Information Services, Ministry of Earth Sciences, Hyderabad, India.

出版信息

Sci Rep. 2023 Mar 15;13(1):4314. doi: 10.1038/s41598-023-31468-0.

DOI:10.1038/s41598-023-31468-0
PMID:36922652
原文链接:https://pmc.ncbi.nlm.nih.gov/articles/PMC10017811/
Abstract

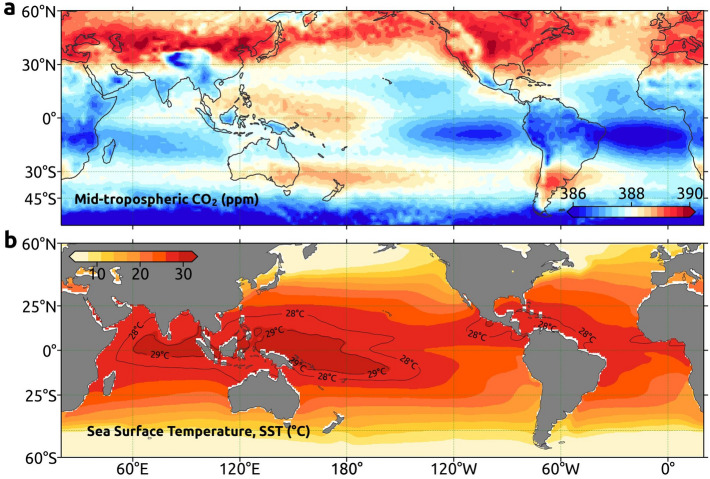
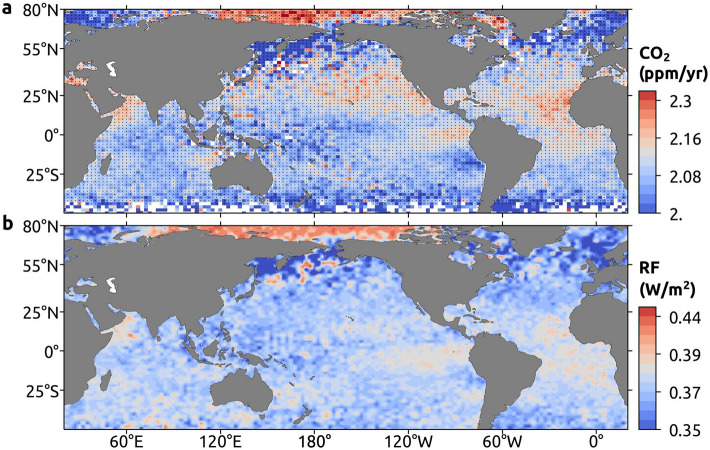
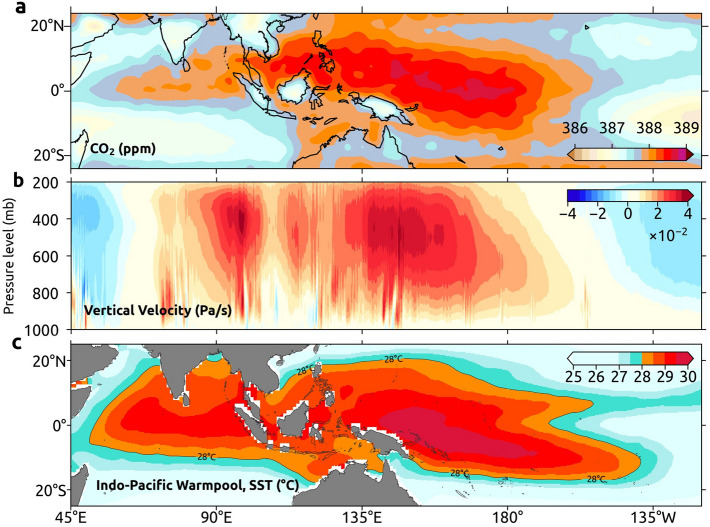
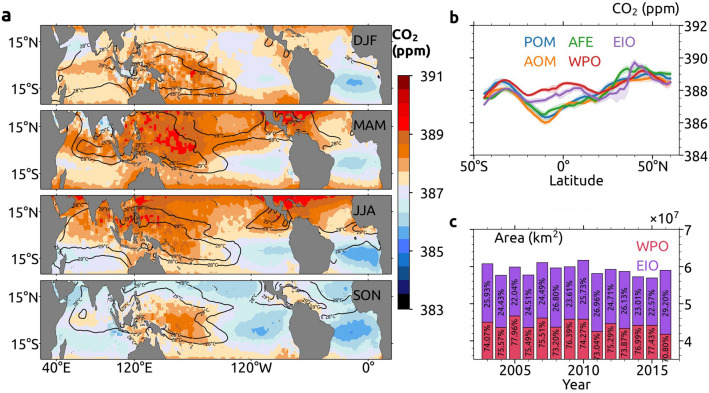
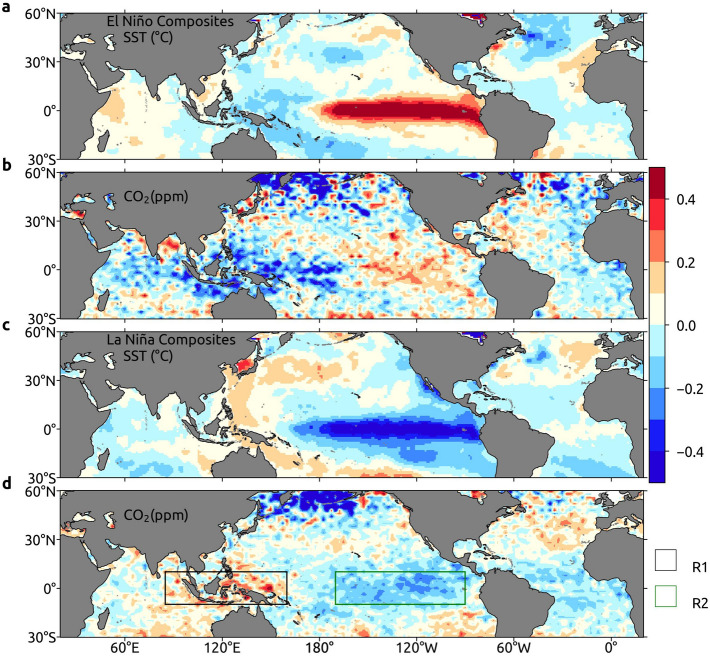
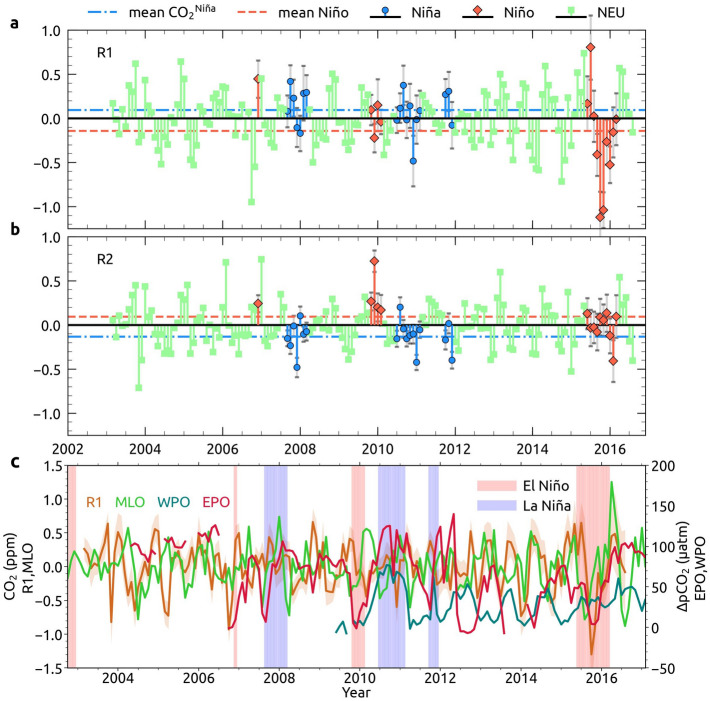
Anthropogenic emissions have produced significant amount of carbon dioxide (CO) in the atmosphere since the beginning of the industrial revolution. High levels of atmospheric CO increases global temperature as CO absorbs outgoing longwave radiation and re-emits. Though a well-mixed greenhouse gas, CO concentration is not uniform in the atmosphere across different altitudes and latitudes. Here, we uncover a region of high CO concentration (i.e. CO pool) in the middle troposphere (500-300 hPa) over the Indo-Pacific Warm Pool (IPWP, 40° E-140° W, 25° S-25° N), in which the CO concentration is higher than that of other regions in the same latitude band (20° N-20° S), by using CO satellite measurements for the period 2002-2017. This CO pool extends from the western Pacific to the eastern Indian Ocean. Much of the CO pool is over the western Pacific Ocean (74.87%), and the remaining lies over the eastern Indian Ocean (25.13%). The rising branch of Walker circulation acts as a "CO Chimney" that constantly transports CO released from the natural, human-induced and ocean outgassing processes to the middle and upper troposphere. The CO pool evolves throughout the year with an average annual trend of about 2.17 ppm yr, as estimated for the period 2003-2016. Our analysis further reveals that La Niña (El Niño) events strengthen (weaken) the CO pool in the mid-troposphere. The radiative forcing for the CO pool suggests more warming in the region and is a grave concern for global warming and climate change.

摘要

自工业革命以来,人为排放已经在大气中产生了大量的二氧化碳(CO)。大气中 CO 含量的增加会导致全球气温升高,因为 CO 会吸收长波辐射并重新发射。尽管 CO 是一种混合均匀的温室气体,但它在不同的海拔和纬度的大气中浓度并不均匀。在这里,我们在中对流层(500-300 hPa)发现了一个高 CO 浓度区域(即 CO 汇),该区域位于印度-太平洋暖池(IPWP,40°E-140°W,25°S-25°N)上空,其 CO 浓度高于同纬度带(20°N-20°S)的其他地区,这是通过使用 CO 卫星测量在 2002-2017 年期间得出的。这个 CO 汇从西太平洋延伸到东印度洋。大部分 CO 汇位于西太平洋(74.87%),其余部分位于东印度洋(25.13%)。沃克环流的上升支充当了一个“CO 烟囱”,不断地将自然、人为和海洋排放过程中释放的 CO 输送到中高层大气。CO 汇在整个一年中演变,如 2003-2016 年期间的平均年趋势约为 2.17 ppm yr。我们的分析进一步表明,拉尼娜(厄尔尼诺)事件会加强(减弱)中对流层的 CO 汇。CO 汇的辐射强迫表明该地区有更多的变暖,这是对全球变暖与气候变化的严重关切。

https://cdn.ncbi.nlm.nih.gov/pmc/blobs/22e0/10017811/ec30edd053f4/41598_2023_31468_Fig6_HTML.jpg
https://cdn.ncbi.nlm.nih.gov/pmc/blobs/22e0/10017811/24df271a0e4c/41598_2023_31468_Fig1_HTML.jpg
https://cdn.ncbi.nlm.nih.gov/pmc/blobs/22e0/10017811/0b5c401ddd0b/41598_2023_31468_Fig2_HTML.jpg
https://cdn.ncbi.nlm.nih.gov/pmc/blobs/22e0/10017811/d57b8d44e384/41598_2023_31468_Fig3_HTML.jpg
https://cdn.ncbi.nlm.nih.gov/pmc/blobs/22e0/10017811/5a010329d35c/41598_2023_31468_Fig4_HTML.jpg
https://cdn.ncbi.nlm.nih.gov/pmc/blobs/22e0/10017811/6232587a2379/41598_2023_31468_Fig5_HTML.jpg
https://cdn.ncbi.nlm.nih.gov/pmc/blobs/22e0/10017811/ec30edd053f4/41598_2023_31468_Fig6_HTML.jpg

相似文献

1
A high concentration CO pool over the Indo-Pacific Warm Pool.印度洋-太平洋暖池上空的高浓度 CO 集气层。
Sci Rep. 2023 Mar 15;13(1):4314. doi: 10.1038/s41598-023-31468-0.
2
Human-caused Indo-Pacific warm pool expansion.人为引起的印度洋-太平洋暖池扩张。
Sci Adv. 2016 Jul 1;2(7):e1501719. doi: 10.1126/sciadv.1501719. eCollection 2016 Jul.
3
Cenozoic Indo-Pacific warm pool controlled by both atmospheric CO and paleogeography.新生代印度-太平洋暖池受大气二氧化碳和古地理环境共同控制。
Sci Bull (Beijing). 2024 May 15;69(9):1323-1331. doi: 10.1016/j.scib.2024.02.028. Epub 2024 Feb 23.
4
ARCTIC CHANGE AND POSSIBLE INFLUENCE ON MID-LATITUDE CLIMATE AND WEATHER: A US CLIVAR White Paper.北极变化及其对中纬度气候和天气的可能影响:一份美国气候变率和可预报性研究计划(CLIVAR)白皮书
US CLIVAR Rep. 2018 Mar;n/a. doi: 10.5065/D6TH8KGW.
5
Hydroclimate of the western Indo-Pacific Warm Pool during the past 24,000 years.过去 24000 年期间的西印度-太平洋暖池水文气候。
Proc Natl Acad Sci U S A. 2014 Jul 1;111(26):9402-6. doi: 10.1073/pnas.1323585111. Epub 2014 Jun 16.
6
Twofold expansion of the Indo-Pacific warm pool warps the MJO life cycle.印度洋-太平洋暖池的双重扩张扭曲了 MJO 生命周期。
Nature. 2019 Nov;575(7784):647-651. doi: 10.1038/s41586-019-1764-4. Epub 2019 Nov 27.
7
Increased variability of eastern Pacific El Niño under greenhouse warming.温室增暖下东太平洋厄尔尼诺的可变性增加。
Nature. 2018 Dec;564(7735):201-206. doi: 10.1038/s41586-018-0776-9. Epub 2018 Dec 12.
8
Nonlinear response of Northern Hemisphere stratospheric polar vortex to the Indo-Pacific warm pool (IPWP) Niño.北半球平流层极地涡旋对印度洋-太平洋暖池(IPWP)尼诺的非线性响应。
Sci Rep. 2019 Sep 23;9(1):13719. doi: 10.1038/s41598-019-49449-7.
9
Magnitude and timing of temperature change in the Indo-Pacific warm pool during deglaciation.冰消期印度-太平洋暖池温度变化的幅度和时间
Nature. 2003 Jan 9;421(6919):152-5. doi: 10.1038/nature01297.
10
Stable sea surface temperatures in the western Pacific warm pool over the past 1.75 million years.在过去175万年里,西太平洋暖池的海面温度保持稳定。
Nature. 2005 Jan 20;433(7023):294-8. doi: 10.1038/nature03189.

引用本文的文献

1
Enhancing in search of Milankovitch cycles from stratigraphic record using convex optimization algorithm.利用凸优化算法从地层记录中增强对米兰科维奇循环的搜索。
Sci Rep. 2025 Jan 7;15(1):1099. doi: 10.1038/s41598-024-82720-0.

本文引用的文献

1
The increasing atmospheric CO over India: Comparison to global trends.印度上空大气二氧化碳的增加:与全球趋势的比较。
iScience. 2022 Aug 2;25(8):104863. doi: 10.1016/j.isci.2022.104863. eCollection 2022 Aug 19.
2
Amazonia as a carbon source linked to deforestation and climate change.亚马孙地区作为碳源与森林砍伐和气候变化有关。
Nature. 2021 Jul;595(7867):388-393. doi: 10.1038/s41586-021-03629-6. Epub 2021 Jul 14.
3
Global warming will happen faster than we think.全球变暖的速度将比我们想象的更快。
Nature. 2018 Dec;564(7734):30-32. doi: 10.1038/d41586-018-07586-5.
4
Influence of El Niño on atmospheric CO over the tropical Pacific Ocean: Findings from NASA's OCO-2 mission.厄尔尼诺对热带太平洋上空大气二氧化碳的影响:美国国家航空航天局(NASA)的OCO - 2任务的研究结果
Science. 2017 Oct 13;358(6360). doi: 10.1126/science.aam5776.
5
Contrasting carbon cycle responses of the tropical continents to the 2015-2016 El Niño.热带大陆对 2015-2016 年厄尔尼诺现象的碳循环响应对比。
Science. 2017 Oct 13;358(6360). doi: 10.1126/science.aam5690.
6
Formation Mechanism for 2015/16 Super El Niño.2015/16 超强厄尔尼诺事件的形成机制。
Sci Rep. 2017 Jun 7;7(1):2975. doi: 10.1038/s41598-017-02926-3.
7
Human-caused Indo-Pacific warm pool expansion.人为引起的印度洋-太平洋暖池扩张。
Sci Adv. 2016 Jul 1;2(7):e1501719. doi: 10.1126/sciadv.1501719. eCollection 2016 Jul.
8
Global alteration of ocean ecosystem functioning due to increasing human CO2 emissions.由于人类二氧化碳排放量增加导致海洋生态系统功能的全球变化。
Proc Natl Acad Sci U S A. 2015 Oct 27;112(43):13272-7. doi: 10.1073/pnas.1510856112. Epub 2015 Oct 12.
9
Sea Surface Temperature, Surface Wind Divergence, and Convection over Tropical Oceans.海洋表面温度、海面风散度与热带海洋对流
Science. 1987 Oct 30;238(4827):657-9. doi: 10.1126/science.238.4827.657.
10
Physical and biological controls on carbon cycling in the equatorial pacific.赤道太平洋碳循环的物理和生物控制。
Science. 1994 Oct 7;266(5182):58-65. doi: 10.1126/science.266.5182.58.