Division of Health Informatics and Surveillance, Center for Surveillance, Epidemiology, and Laboratory Services, Centers for Disease Control and Prevention, 2500 Century Center, Mailstop V25-3, Atlanta, GA 30345, USA; Epidemic Intelligence Service, Centers for Disease Control and Prevention, 2400 Century Center, Mailstop V24-5, Atlanta, GA 30345, USA.
Division of Health Informatics and Surveillance, Center for Surveillance, Epidemiology, and Laboratory Services, Centers for Disease Control and Prevention, 2500 Century Center, Mailstop V25-3, Atlanta, GA 30345, USA; ICF International, 2635 Century Pkwy NE Suite 1000, Atlanta, GA 30345, USA.
Am J Emerg Med. 2023 Jul;69:121-126. doi: 10.1016/j.ajem.2023.04.005. Epub 2023 Apr 14.
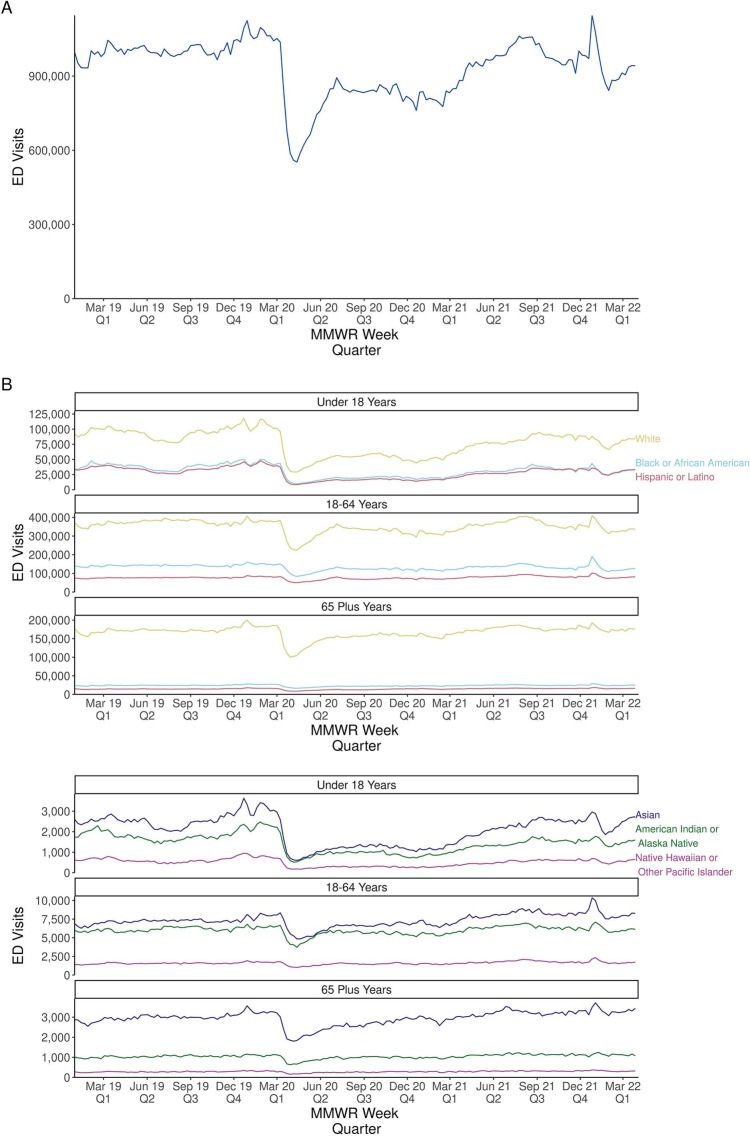
ED data are an important source of surveillance data for monitoring many conditions of public health concern and are especially useful in describing trends related to new, or unusual public health events. The COVID-19 pandemic led to significant changes in emergency care seeking behavior. We described the trends in all-cause emergency department (ED) visit volumes by race, ethnicity, and age using ED data from the National Syndromic Surveillance Program (NSSP) during December 30, 2018-April 2, 2022.
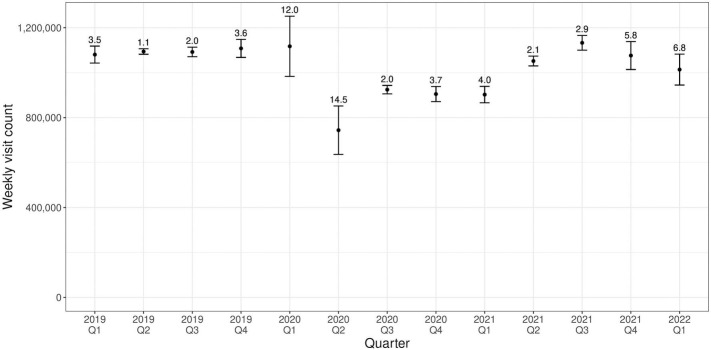
We described total and race, ethnicity, and age group-specific ED visit volumes during the COVID-19 pandemic by comparing quarterly visit volumes during the pandemic period to the relevant quarters in 2019. We quantified the variability of ED visits volumes by calculating the coefficient of variation in mean weekly ED visit volume for each quarter during Q1 2019-Q1 2022.
Overall ED visits dropped by 32% during Q2 2020, when the COVID-19 pandemic began, then rebounded to 2019 baseline by Q2 2021. ED visits for all race, ethnicity, and age groups similarly dropped in Q2 2020 and adults of all race and ethnicity groups rebounded to at or above pre-pandemic levels while children remained at or below the pre-pandemic baseline except during Q3 2021. There was larger variation in mean weekly ED visits compared to the respective quarter in 2019 for 6 of 9 quarters during Q1 2020-Q1 2022.
ED utilization fluctuated considerably during the COVID-19 pandemic. Overall ED visits returned to within 5% of 2019 baseline during Q2 2021, however, ED visits among children did not return to the 2019 baseline until Q3 2021, then again dropped below the 2019 baseline in Q4 2021. Trends in ED visit volumes were similar among race and ethnicity groups but differed by age group. Monitoring ED data stratified by race, ethnicity and age can help understand healthcare utilization trends and overall burden on the healthcare system as well as facilitate rapid identification and response to public health threats that may disproportionately affect certain populations.
ED 数据是监测许多公共卫生关注问题的监测数据的重要来源,尤其有助于描述与新出现或不常见的公共卫生事件相关的趋势。COVID-19 大流行导致急诊就诊行为发生重大变化。我们使用国家综合征监测计划 (NSSP) 的 ED 数据,描述了 2018 年 12 月 30 日至 2022 年 4 月 2 日期间,按种族、族裔和年龄划分的全因急诊就诊量趋势。
我们通过比较大流行期间每季度的就诊量与 2019 年同期的就诊量,描述了 COVID-19 大流行期间的总就诊量以及按种族、族裔和年龄组划分的就诊量。我们通过计算 2019 年第一季度至 2022 年第一季度每个季度平均每周 ED 就诊量的变异系数,量化了 ED 就诊量的变异性。
总体而言,2020 年第二季度 COVID-19 大流行开始时,ED 就诊量下降了 32%,然后在 2021 年第二季度反弹至 2019 年基线水平。所有种族、族裔和年龄组的 ED 就诊量在 2020 年第二季度均下降,而所有种族和族裔的成年人就诊量均反弹至或高于大流行前水平,而儿童就诊量除 2021 年第三季度外,均低于大流行前基线。在 2020 年第一季度至 2022 年第一季度的 9 个季度中,有 6 个季度的平均每周 ED 就诊量与 2019 年同期相比差异较大。
在 COVID-19 大流行期间,ED 的使用情况波动较大。总体而言,ED 就诊量在 2021 年第二季度恢复到 2019 年基线水平的 5%以内,然而,儿童的 ED 就诊量直到 2021 年第三季度才恢复到 2019 年基线水平,然后在 2021 年第四季度再次低于 2019 年基线水平。ED 就诊量趋势在种族和族裔群体中相似,但按年龄组有所不同。按种族、族裔和年龄分层监测 ED 数据有助于了解医疗保健利用趋势和对医疗保健系统的整体负担,并有助于快速识别和应对可能对某些人群产生不成比例影响的公共卫生威胁。