Department of Electrical and Electronics Engineering, Adana Alparslan Türkeş Science and Technology University, Adana, Turkey.
Department of Electrical and Electronics Engineering, Çanakkale Onsekiz Mart University, Çanakkale, Turkey.
Technol Cancer Res Treat. 2023 Jan-Dec;22:15330338231164267. doi: 10.1177/15330338231164267.
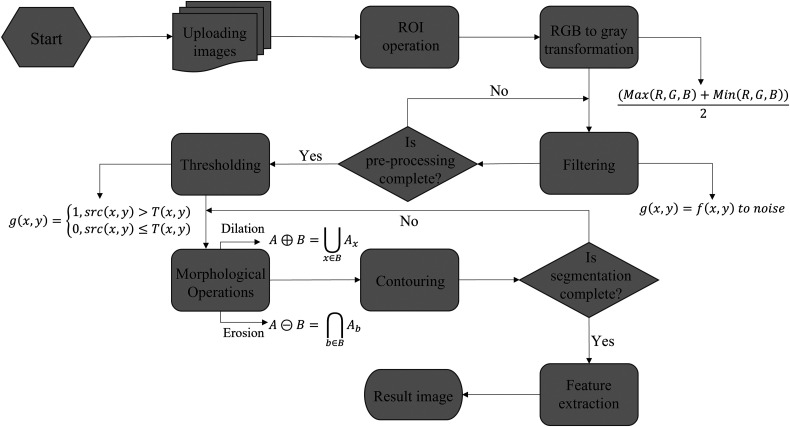
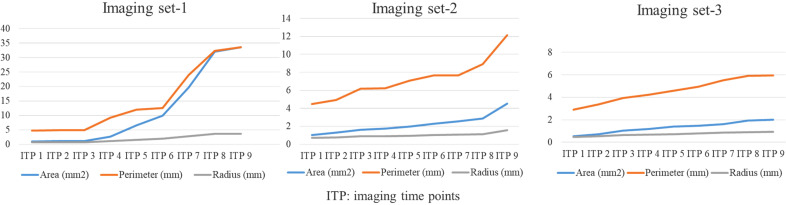
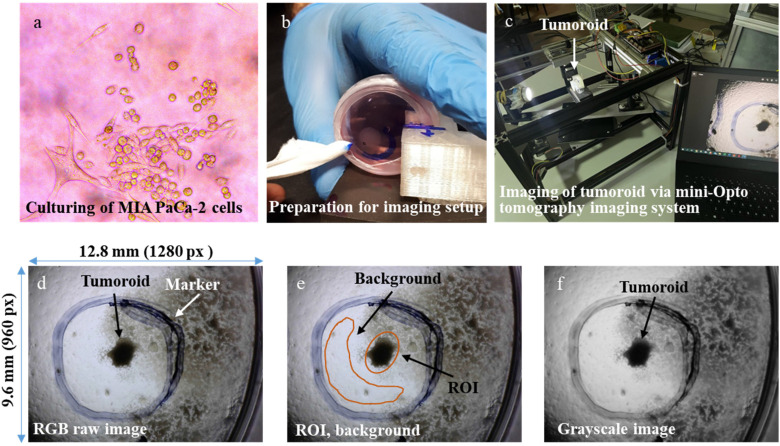
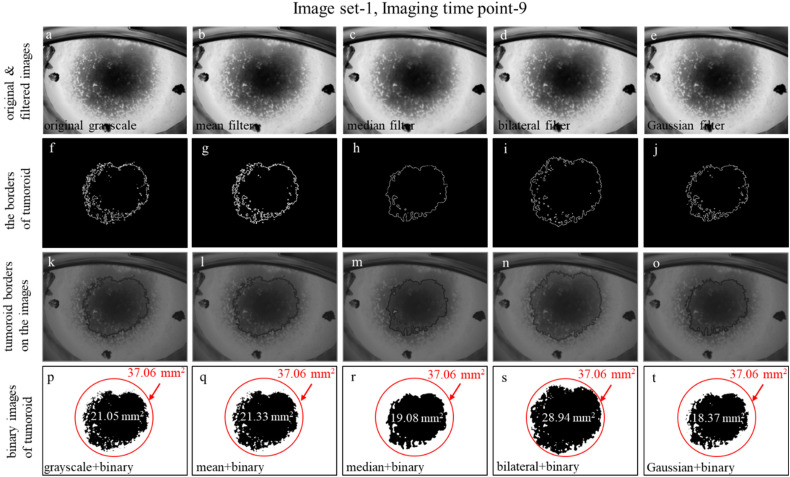
In this study, we aimed to trace the 2D growth development of tumoroids produced with MIA PaCa-2 pancreatic cancer cells at different time points. We cultured 3 different tumoroids with 0.5%, 0.8%, and 1.5% agarose concentrations and calculated the growth rate of the tumoroids with their images acquired at 9 imaging time points by mini-Opto tomography imaging system applying image processing techniques. We used the metrics contrast-to-noise ratio (CNR), peak signal-to-noise ratio (PSNR), and mean squared error (MSE) to analyze the distinguishability of the tumoroid structure from its surroundings, quantitatively. Additionally, we calculated the increase of the radius, the perimeter, and the area of 3 tumoroids over a time period. In the quantitative assessment, the bilateral and Gaussian filters gave the highest CNR values (ie, Gaussian filter: at each of 9 imaging time points in range of 1.715 to 15.142 for image set-1). The median filter gave the highest values in PSNR in the range of 43.108 to 47.904 for image set-2 and gave the lowest values in MSE in the range of 0.604 to 2.599 for image set-3. The areas of tumoroids with 0.5%, 0.8%, and 1.5% agarose concentrations were 1.014 mm, 1.047 mm, and 0.530 mm in the imaging time point-1 and 33.535 mm, 4.538 mm, and 2.017 mm in the imaging time point-9. The tumoroids with 0.5%, 0.8%, and 1.5% agarose concentrations grew up to times of 33.07, 4.33, and 3.80 in area size over this period, respectively. The growth rate and the widest borders of the different tumoroids in a time interval could be detected automatically and successfully. This study that combines the image processing techniques with mini-Opto tomography imaging system ensured significant results in observing the tumoroid's growth rate and enlarging border over time, which is very critical to provide an emerging methodology cancer studies.
在这项研究中,我们旨在追踪不同时间点用 MIA PaCa-2 胰腺癌细胞培养的类器官的 2D 生长发育情况。我们用 0.5%、0.8%和 1.5%琼脂浓度培养了 3 个不同的类器官,并通过迷你光学断层成像系统获得 9 个成像时间点的图像,应用图像处理技术计算类器官的生长速度。我们使用对比度噪声比(CNR)、峰值信噪比(PSNR)和均方误差(MSE)等指标对类器官结构与周围环境的可区分性进行定量分析。此外,我们还计算了 3 个类器官在一段时间内半径、周长和面积的增加。在定量评估中,双边和高斯滤波器给出了最高的 CNR 值(即,高斯滤波器:在 9 个成像时间点的范围内,图像集-1 的范围为 1.715 至 15.142)。中值滤波器在 PSNR 范围内给出了最高值(图像集-2 的范围为 43.108 至 47.904),在 MSE 范围内给出了最低值(图像集-3 的范围为 0.604 至 2.599)。在成像时间点-1 时,0.5%、0.8%和 1.5%琼脂浓度的类器官的面积分别为 1.014 mm、1.047 mm 和 0.530 mm,在成像时间点-9 时,其面积分别为 33.535 mm、4.538 mm 和 2.017 mm。在这段时间内,0.5%、0.8%和 1.5%琼脂浓度的类器官的面积分别增长了 33.07、4.33 和 3.80 倍。不同类器官在时间间隔内的生长速度和最宽边界可以自动且成功地检测到。这项将图像处理技术与迷你光学断层成像系统相结合的研究,确保了在观察类器官随时间的生长速度和边界扩大方面取得了显著的结果,这对癌症研究提供一种新兴的方法非常关键。