• 文献检索
  • 文档翻译
  • 深度研究
  • 学术资讯
  • Suppr Zotero 插件Zotero 插件
  • 邀请有礼
  • 套餐&价格
  • 历史记录
应用&插件
Suppr Zotero 插件Zotero 插件浏览器插件Mac 客户端Windows 客户端微信小程序
定价
高级版会员购买积分包购买API积分包
服务
文献检索文档翻译深度研究API 文档MCP 服务
关于我们
关于 Suppr公司介绍联系我们用户协议隐私条款
关注我们

Suppr 超能文献

核心技术专利:CN118964589B侵权必究
粤ICP备2023148730 号-1Suppr @ 2026

文献检索

告别复杂PubMed语法,用中文像聊天一样搜索,搜遍4000万医学文献。AI智能推荐,让科研检索更轻松。

立即免费搜索

文件翻译

保留排版,准确专业,支持PDF/Word/PPT等文件格式,支持 12+语言互译。

免费翻译文档

深度研究

AI帮你快速写综述,25分钟生成高质量综述,智能提取关键信息,辅助科研写作。

立即免费体验

基于多源数据融合的中国燃煤电厂每日排放模式

Daily Emission Patterns of Coal-Fired Power Plants in China Based on Multisource Data Fusion.

作者信息

Wu Nana, Geng Guannan, Qin Xinying, Tong Dan, Zheng Yixuan, Lei Yu, Zhang Qiang

机构信息

Ministry of Education Key Laboratory for Earth System Modeling, Department of Earth System Science, Tsinghua University, Beijing 100084, China.

State Key Joint Laboratory of Environment Simulation and Pollution Control, School of Environment, Tsinghua University, Beijing 100084, China.

出版信息

ACS Environ Au. 2022 May 17;2(4):363-372. doi: 10.1021/acsenvironau.2c00014. eCollection 2022 Jul 20.

DOI:10.1021/acsenvironau.2c00014
PMID:37101967
原文链接:https://pmc.ncbi.nlm.nih.gov/articles/PMC10125283/
Abstract

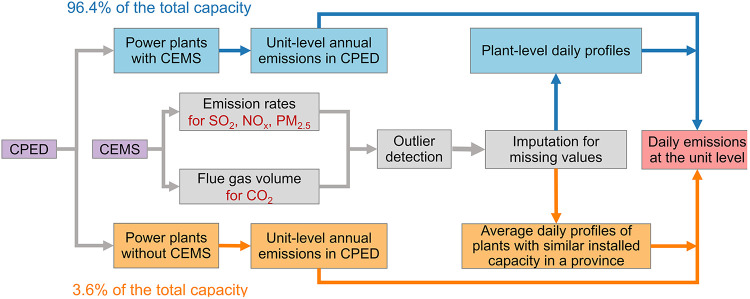
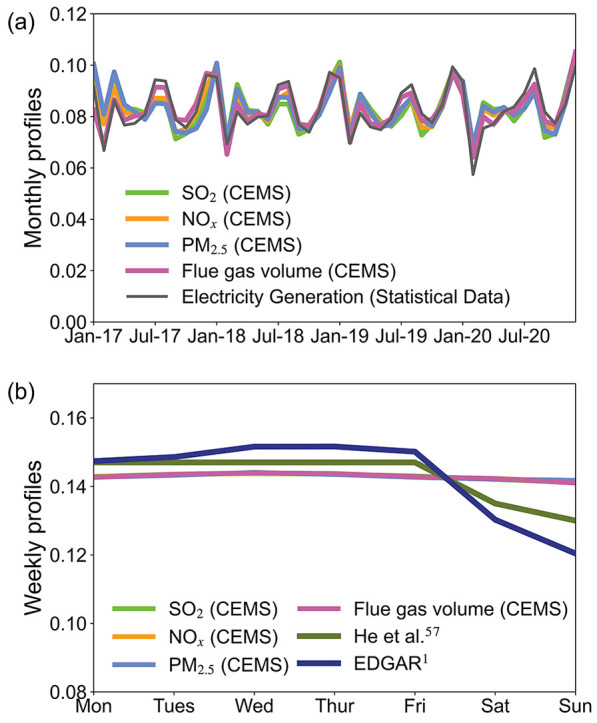
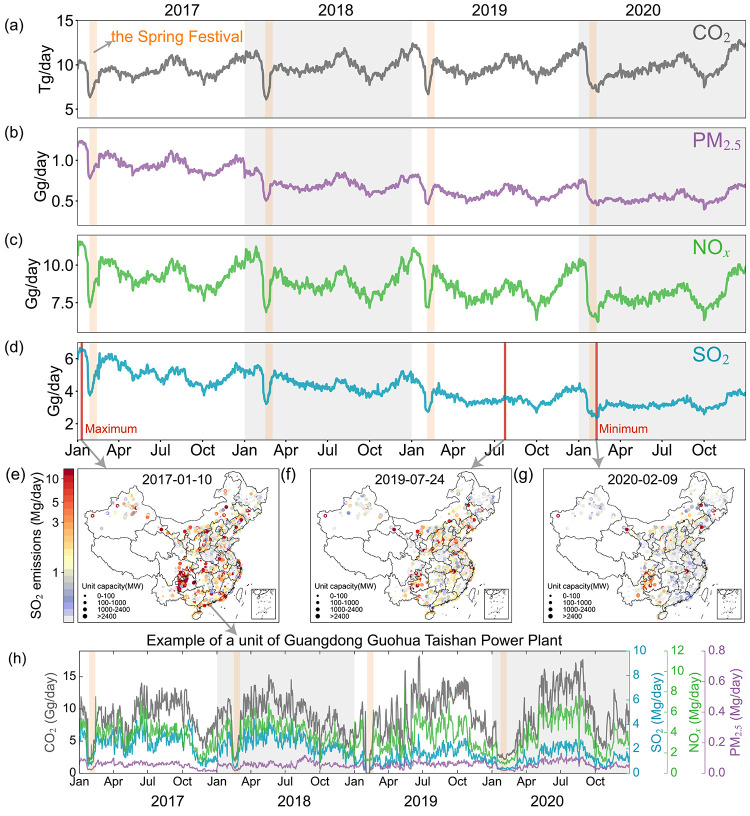
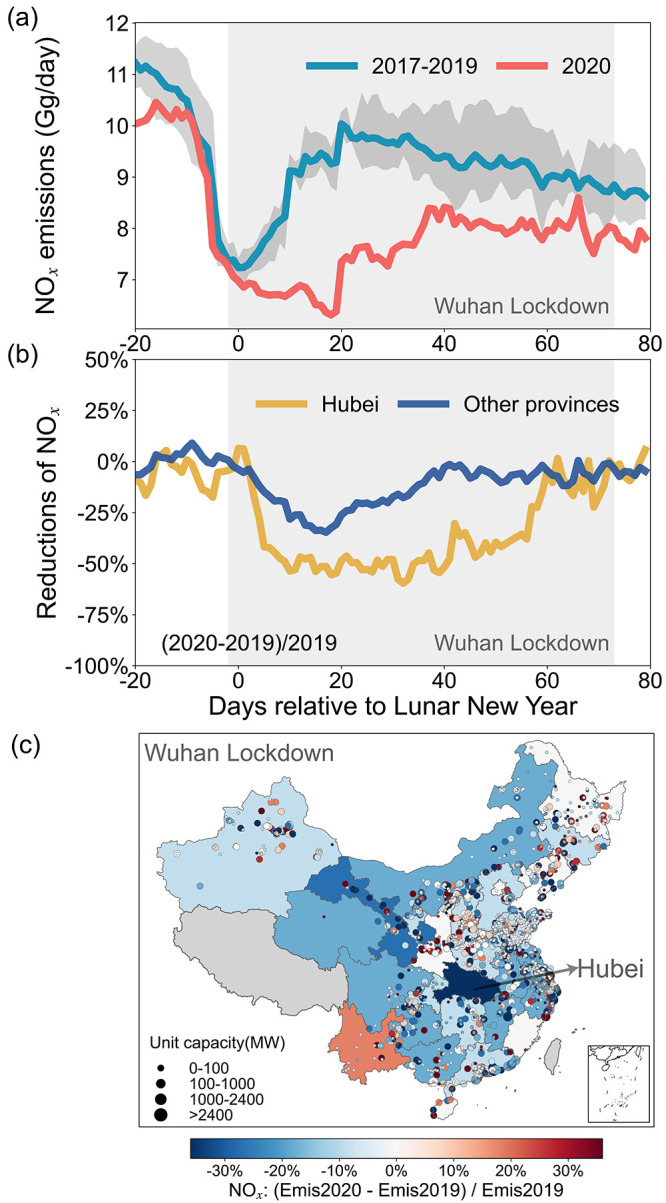
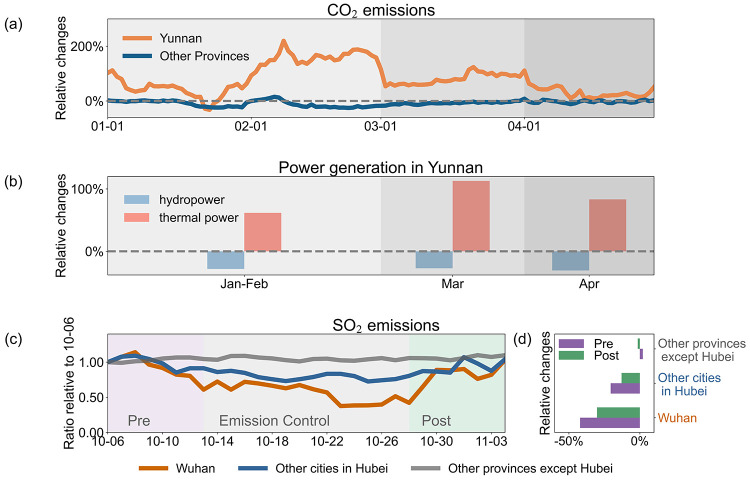
Daily emission estimates are essential for tracking the dynamic changes in emission sources. In this work, we estimate daily emissions of coal-fired power plants in China during 2017-2020 by combining information from the unit-based China coal-fired Power plant Emissions Database (CPED) and real-time measurements from continuous emission monitoring systems (CEMS). We develop a step-by-step method to screen outliers and impute missing values for data from CEMS. Then, plant-level daily profiles of flue gas volume and emissions obtained from CEMS are coupled with annual emissions from CPED to derive daily emissions. Reasonable agreement is found between emission variations and available statistics (i.e., monthly power generation and daily coal consumption). Daily power emissions are in the range of 6267-12,994, 0.4-1.3, 6.5-12.0, and 2.5-6.8 Gg for CO, PM, NO , and SO, respectively, with high emissions in winter and summer caused by heating and cooling demand. Our estimates can capture sudden decreases (e.g., those associated with COVID-19 lockdowns and short-term emission controls) or increases (e.g., those related to a drought) in daily power emissions during typical socioeconomic events. We also find that weekly patterns from CEMS exhibit no obvious weekend effect compared to those in previous studies. The daily power emissions will help to improve chemical transport modeling and facilitate policy formulation.

摘要

每日排放估算对于追踪排放源的动态变化至关重要。在这项工作中,我们通过结合基于机组的中国燃煤电厂排放数据库(CPED)的信息和连续排放监测系统(CEMS)的实时测量数据,估算了2017 - 2020年期间中国燃煤电厂的每日排放量。我们开发了一种逐步方法来筛选异常值并插补CEMS数据中的缺失值。然后,将从CEMS获得的电厂层面的烟气量和排放的每日分布与CPED的年度排放量相结合,以得出每日排放量。在排放变化与可用统计数据(即月度发电量和每日煤炭消耗量)之间发现了合理的一致性。CO、PM、NO 和SO的每日电力排放量分别在6267 - 12994、0.4 - 1.3、6.5 - 12.0和2.5 - 6.8 Gg范围内,冬季和夏季由于供暖和制冷需求导致排放量较高。我们的估算能够捕捉典型社会经济事件期间每日电力排放的突然下降(例如与新冠疫情封锁和短期排放控制相关的下降)或增加(例如与干旱相关的增加)。我们还发现,与之前的研究相比,CEMS的每周模式没有明显的周末效应。每日电力排放将有助于改进化学传输模型并促进政策制定。

https://cdn.ncbi.nlm.nih.gov/pmc/blobs/de7a/10125283/f2e0093ece01/vg2c00014_0006.jpg
https://cdn.ncbi.nlm.nih.gov/pmc/blobs/de7a/10125283/eb4f948359f6/vg2c00014_0002.jpg
https://cdn.ncbi.nlm.nih.gov/pmc/blobs/de7a/10125283/a55d184234cc/vg2c00014_0003.jpg
https://cdn.ncbi.nlm.nih.gov/pmc/blobs/de7a/10125283/ef6e3c21c178/vg2c00014_0004.jpg
https://cdn.ncbi.nlm.nih.gov/pmc/blobs/de7a/10125283/f2e826e79ade/vg2c00014_0005.jpg
https://cdn.ncbi.nlm.nih.gov/pmc/blobs/de7a/10125283/f2e0093ece01/vg2c00014_0006.jpg

相似文献

1
Daily Emission Patterns of Coal-Fired Power Plants in China Based on Multisource Data Fusion.基于多源数据融合的中国燃煤电厂每日排放模式
ACS Environ Au. 2022 May 17;2(4):363-372. doi: 10.1021/acsenvironau.2c00014. eCollection 2022 Jul 20.
2
Benefits of current and future policies on emissions of China's coal-fired power sector indicated by continuous emission monitoring.连续排放监测表明中国燃煤发电行业现行和未来政策的排放效益。
Environ Pollut. 2019 Aug;251:415-424. doi: 10.1016/j.envpol.2019.05.021. Epub 2019 May 8.
3
Carbon dioxide emission tallies for 210 U.S. coal-fired power plants: a comparison of two accounting methods.美国 210 座燃煤电厂的二氧化碳排放量汇总:两种核算方法的比较。
J Air Waste Manag Assoc. 2014 Jan;64(1):73-9. doi: 10.1080/10962247.2013.833146.
4
A high temporal-spatial emission inventory and updated emission factors for coal-fired power plants in Shanghai, China.中国上海燃煤电厂的高时空排放清单及更新后的排放因子。
Sci Total Environ. 2019 Oct 20;688:94-102. doi: 10.1016/j.scitotenv.2019.06.201. Epub 2019 Jun 14.
5
Costs and Benefits of Installing Flue-Gas Desulfurization Units at Coal-Fired Power Plants in India印度燃煤电厂安装烟气脱硫装置的成本与效益
6
Current Emissions and Future Mitigation Pathways of Coal-Fired Power Plants in China from 2010 to 2030.中国 2010 年至 2030 年燃煤电厂的当前排放和未来减排途径。
Environ Sci Technol. 2018 Nov 6;52(21):12905-12914. doi: 10.1021/acs.est.8b02919. Epub 2018 Oct 12.
7
[Emission Concentration and Characteristics of Particulate Matter and Water-Soluble Ions in Exhaust Gas of Typical Combustion Sources with Ultra-Low Emission].[典型超低排放燃烧源废气中颗粒物及水溶性离子的排放浓度与特征]
Huan Jing Ke Xue. 2021 May 8;42(5):2159-2168. doi: 10.13227/j.hjkx.202010137.
8
Investigation of aerosol and gas emissions from a coal-fired power plant under various operating conditions.研究不同运行条件下燃煤电厂的气溶胶和气态排放物。
J Air Waste Manag Assoc. 2019 Jan;69(1):34-46. doi: 10.1080/10962247.2018.1503981. Epub 2018 Nov 7.
9
Construction of a regional inventory to characterize polycyclic aromatic hydrocarbon emissions from coal-fired power plants in Anhui, China from 2010 to 2030.构建区域清单以刻画 2010 年至 2030 年中国安徽燃煤电厂排放的多环芳烃。
Environ Pollut. 2021 Mar 1;272:115972. doi: 10.1016/j.envpol.2020.115972. Epub 2020 Nov 6.
10
Air pollutant emissions from coal-fired power plants in China over the past two decades.中国过去二十年来燃煤电厂的空气污染物排放。
Sci Total Environ. 2020 Nov 1;741:140326. doi: 10.1016/j.scitotenv.2020.140326. Epub 2020 Jun 20.

引用本文的文献

1
Silver-Doped Porous Copper Catalysts for Efficient Resource Utilization of CO-Containing Flue Gases.用于含CO烟道气高效资源利用的银掺杂多孔铜催化剂
ACS Environ Au. 2025 Mar 3;5(3):287-297. doi: 10.1021/acsenvironau.4c00121. eCollection 2025 May 21.
2
Satellite reveals a steep decline in China's CO emissions in early 2022.卫星显示中国 2022 年初的二氧化碳排放量急剧下降。
Sci Adv. 2023 Jul 21;9(29):eadg7429. doi: 10.1126/sciadv.adg7429.
3
Drought impacts on the electricity system, emissions, and air quality in the western United States.

本文引用的文献

1
A high-resolution typical pollution source emission inventory and pollution source changes during the COVID-19 lockdown in a megacity, China.中国一座特大城市在新冠疫情封锁期间的高分辨率典型污染源排放清单及污染源变化情况。
Environ Sci Pollut Res Int. 2021 Sep;28(33):45344-45352. doi: 10.1007/s11356-020-11858-x. Epub 2021 Apr 16.
2
An updated model-ready emission inventory for Guangdong Province by incorporating big data and mapping onto multiple chemical mechanisms.利用大数据并将其映射到多种化学机制,为广东省建立了一个更新的、适用于模型的排放清单。
Sci Total Environ. 2021 May 15;769:144535. doi: 10.1016/j.scitotenv.2020.144535. Epub 2021 Jan 7.
3
干旱对美国西部的电力系统、排放及空气质量产生影响。
Proc Natl Acad Sci U S A. 2023 Jul 11;120(28):e2300395120. doi: 10.1073/pnas.2300395120. Epub 2023 Jul 6.
Satellite-based estimates of decline and rebound in China's CO emissions during COVID-19 pandemic.
基于卫星的中国 COVID-19 大流行期间 CO 排放量下降和反弹的估算。
Sci Adv. 2020 Dec 2;6(49). doi: 10.1126/sciadv.abd4998. Print 2020 Dec.
4
Carbon Monitor, a near-real-time daily dataset of global CO emission from fossil fuel and cement production.碳监测仪,一个近乎实时的全球化石燃料和水泥生产二氧化碳排放逐日数据集。
Sci Data. 2020 Nov 9;7(1):392. doi: 10.1038/s41597-020-00708-7.
5
Electricity demand during pandemic times: The case of the COVID-19 in Spain.疫情期间的电力需求:以西班牙的新冠疫情为例。
Energy Policy. 2021 Jan;148:111964. doi: 10.1016/j.enpol.2020.111964. Epub 2020 Oct 13.
6
Near-real-time monitoring of global CO emissions reveals the effects of the COVID-19 pandemic.近实时全球 CO 排放监测揭示了 COVID-19 大流行的影响。
Nat Commun. 2020 Oct 14;11(1):5172. doi: 10.1038/s41467-020-18922-7.
7
Air pollution emissions from Chinese power plants based on the continuous emission monitoring systems network.基于连续排放监测系统网络的中国电厂的空气污染排放。
Sci Data. 2020 Oct 5;7(1):325. doi: 10.1038/s41597-020-00665-1.
8
Abrupt decline in tropospheric nitrogen dioxide over China after the outbreak of COVID-19.新冠疫情爆发后中国对流层二氧化氮的急剧下降。
Sci Adv. 2020 Jul 10;6(28):eabc2992. doi: 10.1126/sciadv.abc2992. eCollection 2020 Jul.
9
Coronavirus pandemic reduced China's CO emissions in short-term, while stimulus packages may lead to emissions growth in medium- and long-term.新冠疫情在短期内减少了中国的二氧化碳排放,而经济刺激计划可能会在中长期导致排放增长。
Appl Energy. 2020 Nov 15;278:115735. doi: 10.1016/j.apenergy.2020.115735. Epub 2020 Aug 21.
10
Satellite evidence for changes in the NO weekly cycle over large cities.卫星证据表明大城市中 NO 周循环的变化。
Sci Rep. 2020 Jun 22;10(1):10066. doi: 10.1038/s41598-020-66891-0.