Royal Belgian Institute for Space Aeronomy, Avenue Circulaire 3, 1180, Brussels, Belgium.
Royal Netherlands Meteorological Institute, Satellite Observations, De Bilt, The Netherlands.
Sci Rep. 2020 Jun 22;10(1):10066. doi: 10.1038/s41598-020-66891-0.
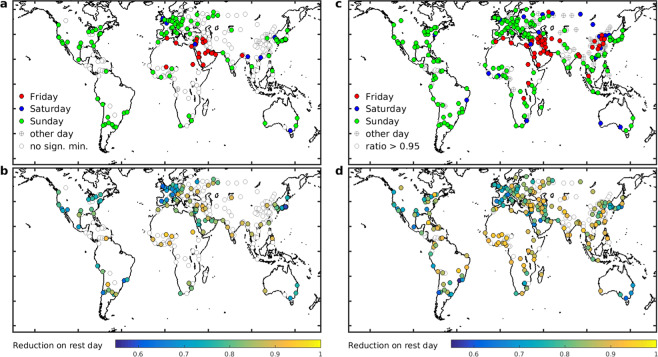
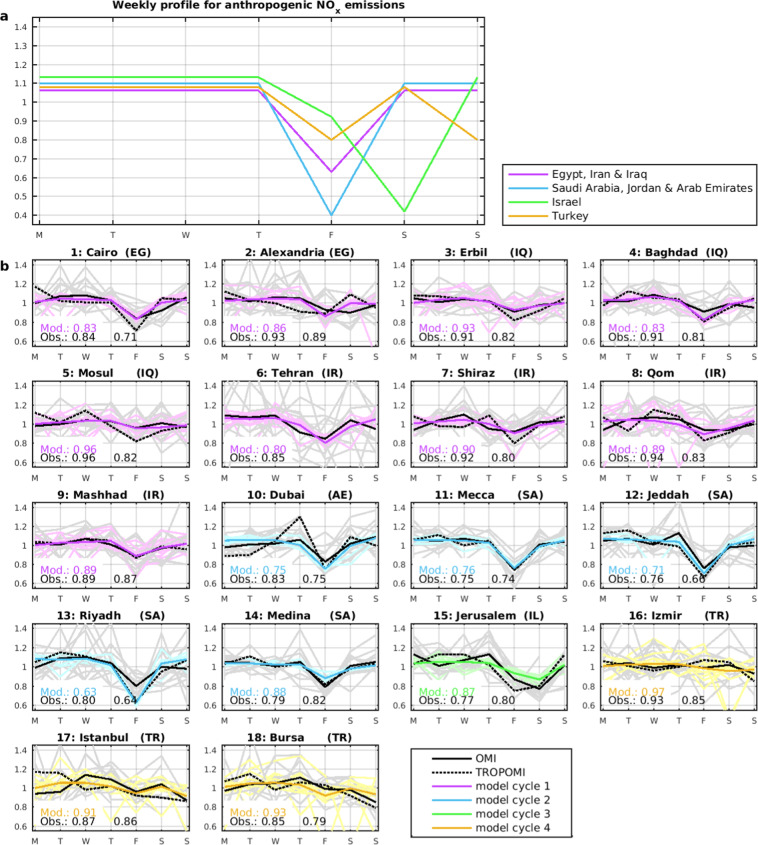
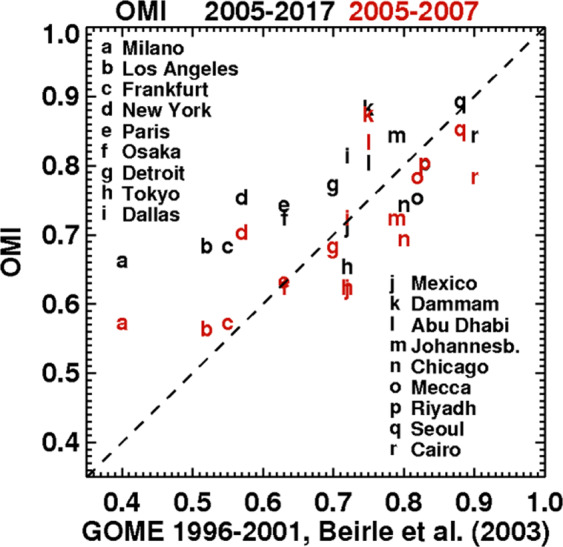
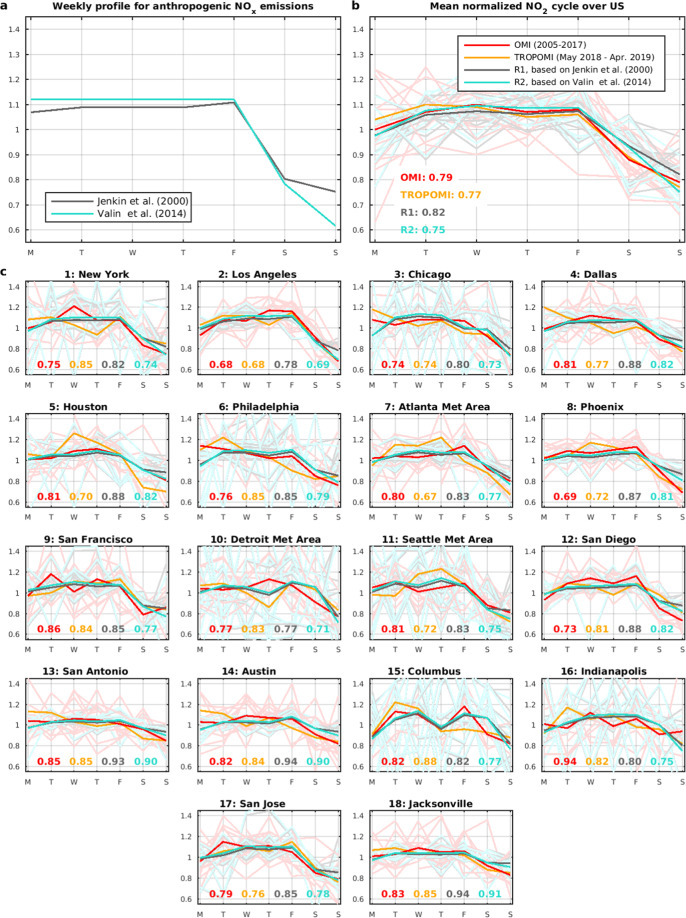
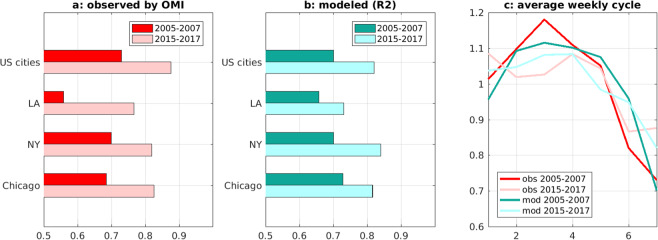
Anthropogenic activities, by far the largest source of NOx into the atmosphere, induce a weekly cycle of NO abundances in cities. Comprehensive analysis of the 2005-2017 OMI NO dataset reveals significant weekly cycles in 115 of the 274 cities considered. These results are corroborated by a full year of high-resolution TROPOMI NO observations. The OMI dataset permits us to identify trends in the weekly cycle resulting from NOx emissions changes. The data show a clear weakening of the weekly cycle over European and U.S. cities, an evolution attributed to the decline in anthropogenic emissions and the resulting growing importance of background NO, whereas NO lifetime changes also play a minor role. In particular, the Sunday NO columns averaged over all U.S. cities are found to increase, relative to the weekly average, from 0.72 during 2005-2007 to 0.88 in 2015-2017. The opposite tendency is recorded in regions undergoing rapid emission growth. Multiyear simulations over the U.S. and the Middle East using the chemistry-transport model MAGRITTEv1.1 succeed in capturing the observed weekly cycles over the largest cities, as well as the observed long-term trends in the weekly cycle.
人为活动是大气中氮氧化物(NOx)的最大来源,导致城市中 NO 的丰度呈现每周循环变化。对 2005-2017 年 OMI NO 数据集的综合分析表明,在考虑的 274 个城市中有 115 个城市存在显著的每周循环。这一结果得到了一整年 TROPOMI NO 高分辨率观测的支持。OMI 数据集使我们能够识别由于 NOx 排放变化而导致的每周循环趋势。数据表明,欧洲和美国城市的每周循环明显减弱,这一演变归因于人为排放的减少以及背景 NO 的重要性不断增加,而 NO 寿命变化也起到了次要作用。特别是,相对于每周平均值,所有美国城市的周日 NO 柱平均值从 2005-2007 年的 0.72 增加到 2015-2017 年的 0.88。在排放快速增长的地区,记录到了相反的趋势。使用化学传输模型 MAGRITTEv1.1 对美国和中东进行的多年模拟成功地捕捉到了最大城市的观测到的每周循环,以及每周循环的观测到的长期趋势。