Morgeson Forrest V, Hult G Tomas M, Sharma Udit, Fornell Claes
Michigan State University, Broad College of Business, East Lansing, MI 48824, USA.
American Customer Satisfaction Index LLC, 3916 Ranchero Dr, Ann Arbor, MI 48108, USA.
Data Brief. 2023 Apr 11;48:109123. doi: 10.1016/j.dib.2023.109123. eCollection 2023 Jun.
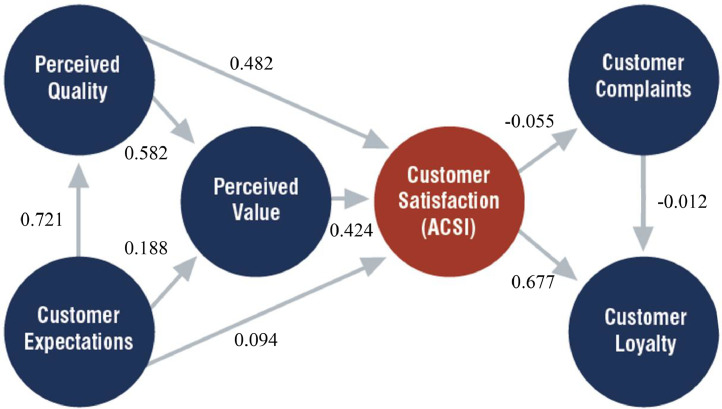
This article provides a sample of survey data collected by the American Customer Satisfaction Index (ACSI). Using online sampling and stratified interviewing techniques of actual customers of predominantly large market-share ("large cap") companies, the ACSI annually collects data from some 400,000 consumers residing across the United States for more than 400 companies within about 50 consumer industries. For this article and the data depository, consumers' perceptions of their experiences with individual companies included within four consumer industries as defined and measured by ACSI - processed food, commercial airlines, Internet service providers, and commercial banks - are included in the dataset. These industries were chosen to represent and illustrate a cross-section of data from differentiated sectors, not because they are representative of the larger economy or larger ACSI dataset per se. The survey items reflect a diverse array of customers' perceptions regarding prior expectations, perceived quality, perceived value, customer satisfaction, complaint behavior, and customer loyalty. These are also the core latent factors modeled in the so-called ACSI model since 1994. The ACSI model is continuously analyzed using a proprietary and patented Partial Least Squares structural equation modeling approach (PLS-SEM). Detailed firm- or brand-level results from the ACSI data are used by individual companies for strategic organizational decision-making and in the aggregate to forecast trends in the U.S. national economy. ACSI data have been analyzed in thousands of peer-reviewed academic and practitioner journal articles.
本文提供了美国客户满意度指数(ACSI)收集的调查数据样本。ACSI采用在线抽样和对主要是市场份额较大(“大盘股”)公司的实际客户进行分层访谈的技术,每年从美国各地约50个消费行业的400多家公司的约40万名消费者那里收集数据。对于本文和数据存放库,数据集中包含了消费者对ACSI定义和衡量的四个消费行业内各公司体验的看法,这四个行业分别是加工食品、商业航空公司、互联网服务提供商和商业银行。选择这些行业是为了代表和说明来自不同部门的数据横截面,并非因为它们本身代表更大的经济体或更大的ACSI数据集。调查项目反映了客户对先前期望、感知质量、感知价值、客户满意度、投诉行为和客户忠诚度的各种看法。自1994年以来,这些也是所谓ACSI模型中建模的核心潜在因素。ACSI模型使用专有的专利偏最小二乘结构方程建模方法(PLS-SEM)进行持续分析。各公司利用ACSI数据中详细的公司或品牌层面结果进行战略组织决策,并汇总起来预测美国国民经济趋势。ACSI数据已在数千篇经过同行评审的学术和行业期刊文章中得到分析。