Wang Qi, Zhang Biyuan, Wang Haiji, Hu Mingming, Feng Hui, Gao Wen, Lu Haijun, Tan Ye, Dong Yinying, Xu Mingjin, Guo Tianhui, Ji Xiaomeng
Department of Radiation Oncology, The Affiliated Hospital of Qingdao University, Qingdao, Shandong, China.
Front Oncol. 2023 Jun 19;13:1210994. doi: 10.3389/fonc.2023.1210994. eCollection 2023.
Gastric cancer (GC) ranks as the fifth most prevalent malignancy and the second leading cause of oncologic mortality globally. Despite staging guidelines and standard treatment protocols, significant heterogeneity exists in patient survival and response to therapy for GC. Thus, an increasing number of research have examined prognostic models recently for screening high-risk GC patients.
We studied DEGs between GC tissues and adjacent non-tumor tissues in GEO and TCGA datasets. Then the candidate DEGs were further screened in TCGA cohort through univariate Cox regression analyses. Following this, LASSO regression was utilized to generate prognostic model of DEGs. We used the ROC curve, Kaplan-Meier curve, and risk score plot to evaluate the signature's performance and prognostic power. ESTIMATE, xCell, and TIDE algorithm were used to explore the relationship between the risk score and immune landscape relationship. As a final step, nomogram was developed in this study, utilizing both clinical characteristics and a prognostic model.
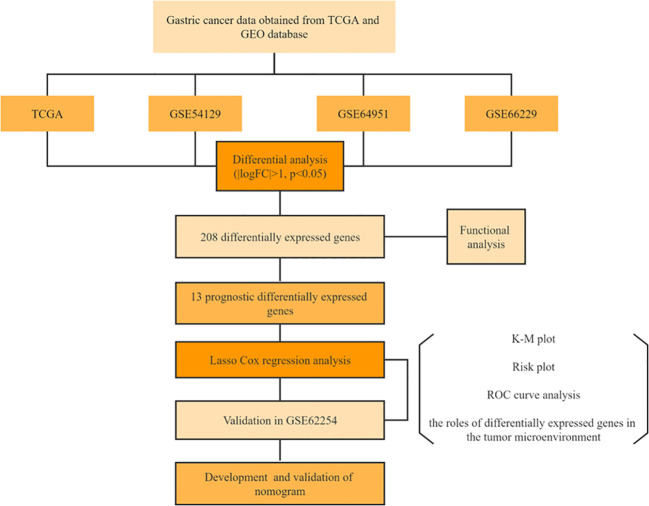
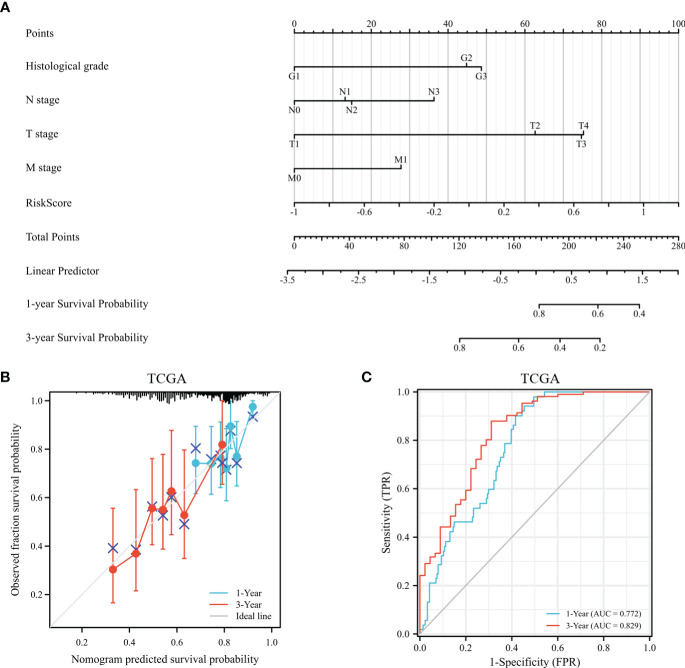
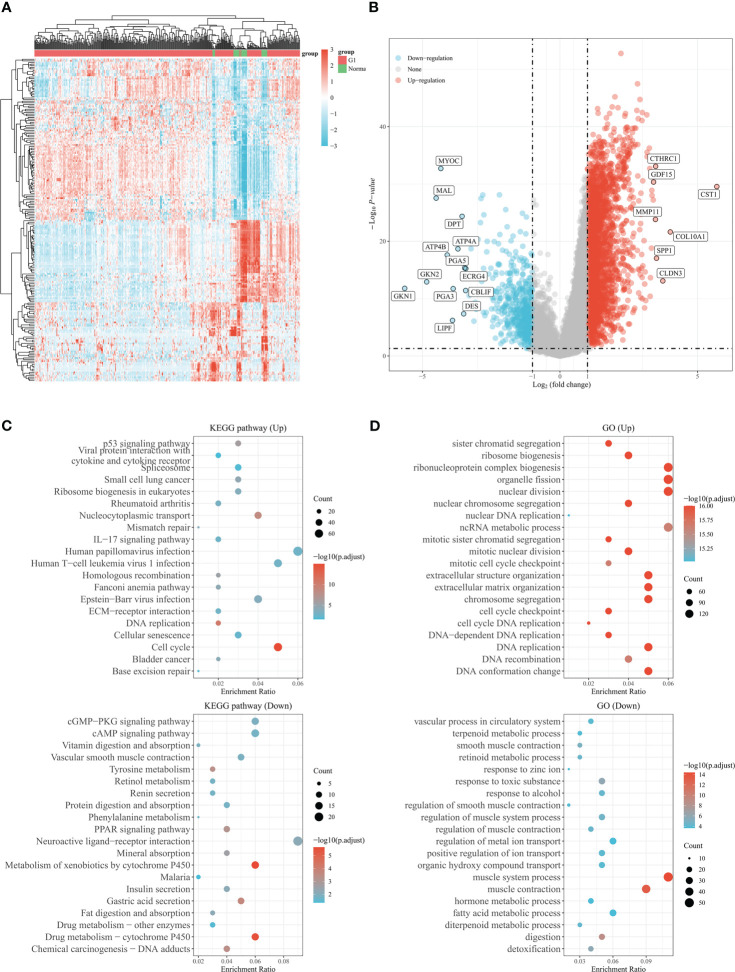
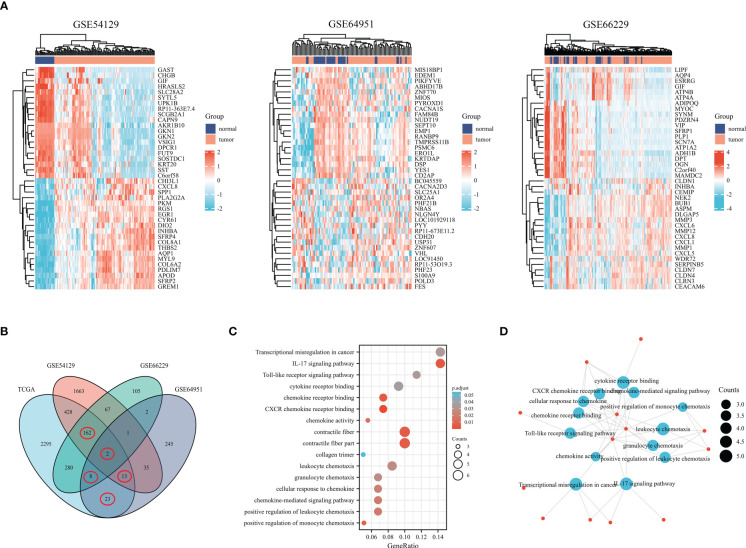
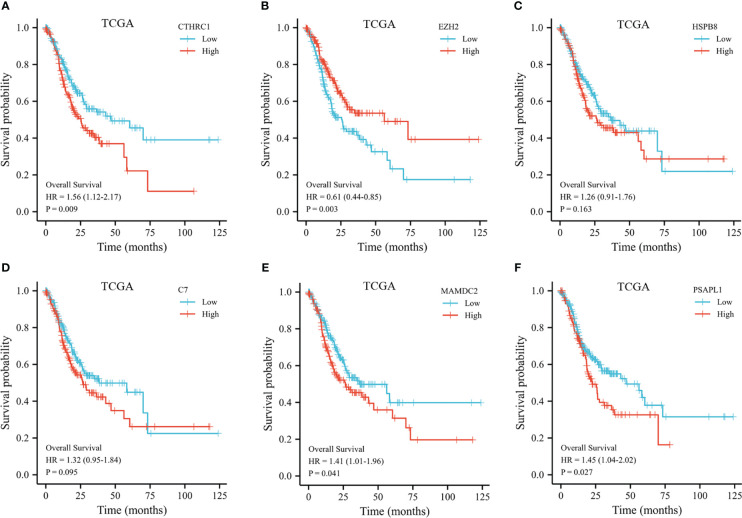
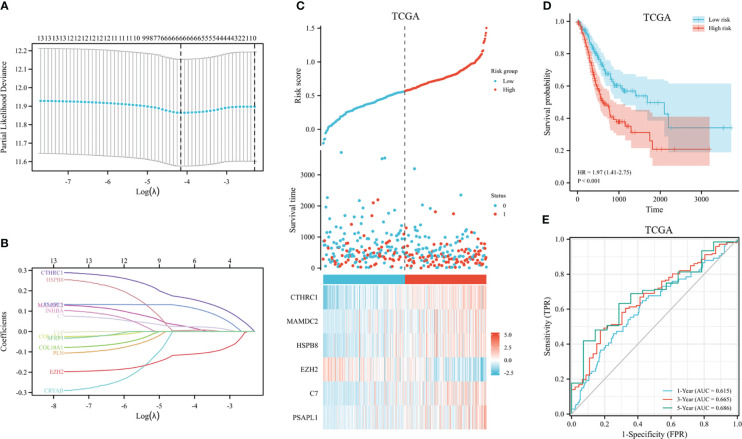
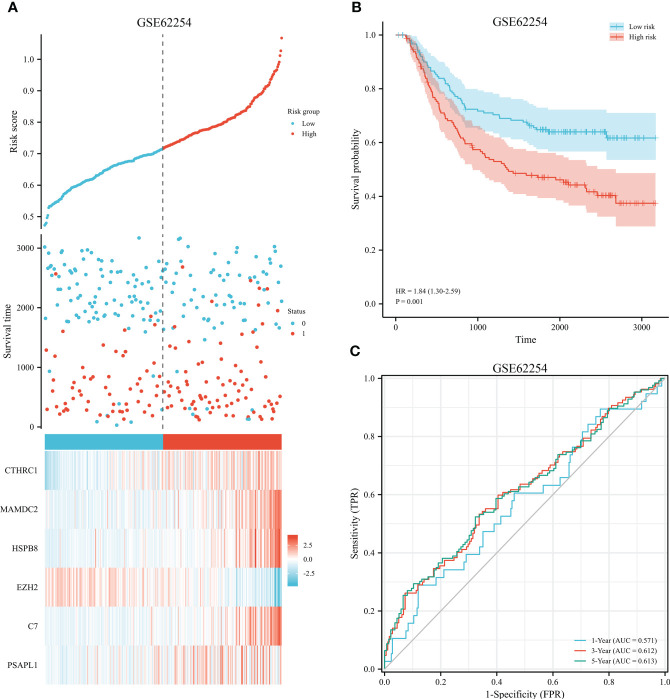
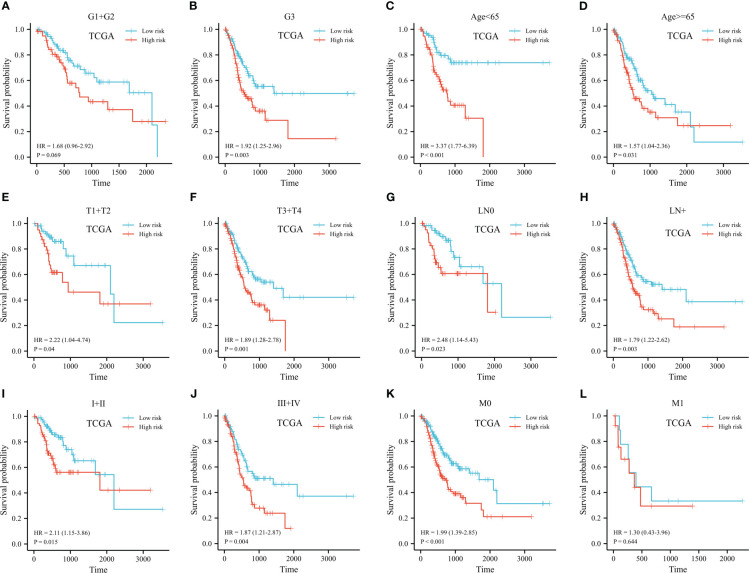
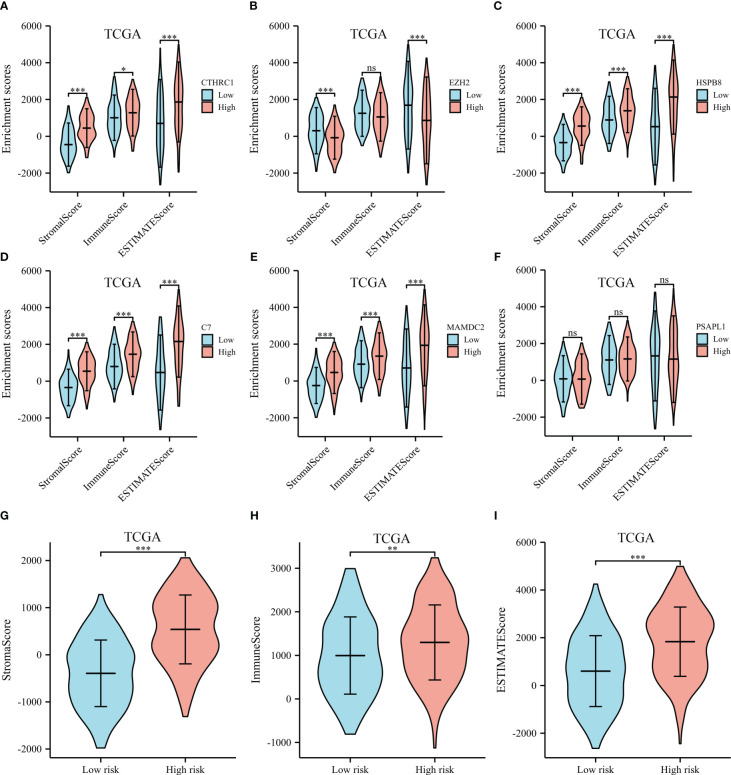
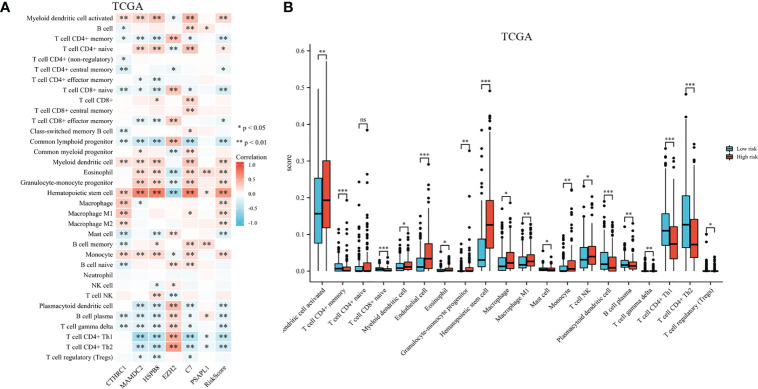
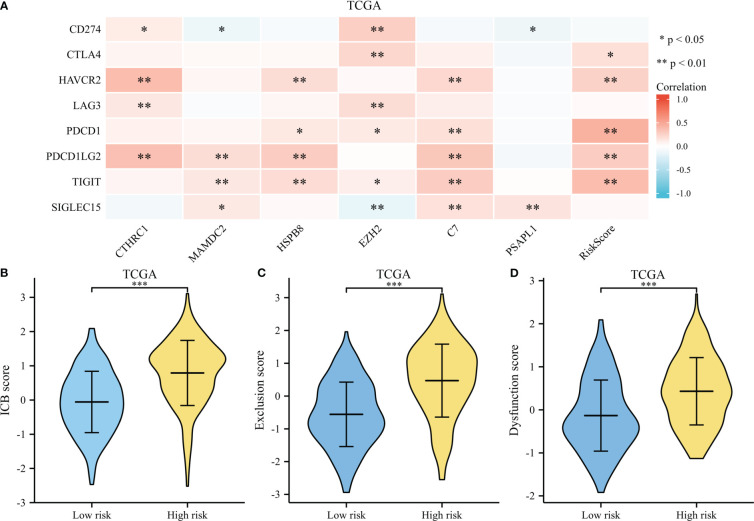
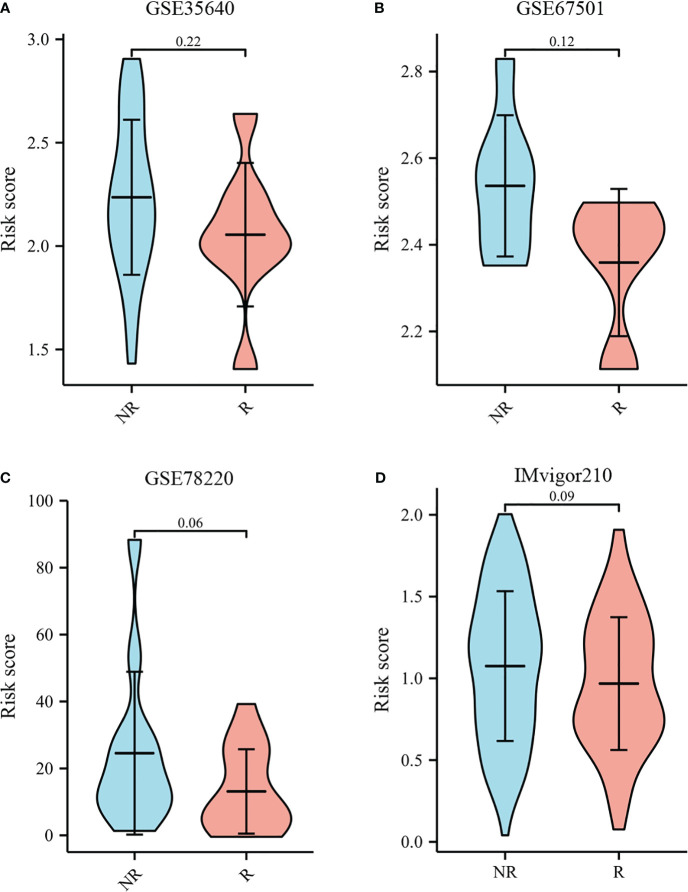
There were 3211 DEGs in TCGA, 2371 DEGs in GSE54129, 627 DEGs in GSE66229, and 329 DEGs in GSE64951 selected as candidate genes and intersected with to obtain DEGs. In total, the 208 DEGs were further screened in TCGA cohort through univariate Cox regression analyses. Following this, LASSO regression was utilized to generate prognostic model of 6 DEGs. External validation showed favorable predictive efficacy. We studied interaction between risk models, immunoscores, and immune cell infiltrate based on six-gene signature. The high-risk group exhibited significantly elevated ESTIMATE score, immunescore, and stromal score relative to low-risk group. The proportions of CD4 memory T cells, CD8 naive T cells, common lymphoid progenitor, plasmacytoid dentritic cell, gamma delta T cell, and B cell plasma were significantly enriched in low-risk group. According to TIDE, the TIDE scores, exclusion scores and dysfunction scores for low-risk group were lower than those for high-risk group. As a final step, nomogram was developed in this study, utilizing both clinical characteristics and a prognostic model.
In conclusion, we discovered a 6 gene signature to forecast GC patients' OS. This risk signature proves to be a valuable clinical predictive tool for guiding clinical practice.
胃癌(GC)是全球第五大常见恶性肿瘤,也是肿瘤学死亡的第二大主要原因。尽管有分期指南和标准治疗方案,但GC患者的生存情况和对治疗的反应仍存在显著异质性。因此,最近越来越多的研究对预后模型进行了研究,以筛选高危GC患者。
我们研究了GEO和TCGA数据集中GC组织与相邻非肿瘤组织之间的差异表达基因(DEGs)。然后,通过单变量Cox回归分析在TCGA队列中进一步筛选候选DEGs。在此之后,利用LASSO回归生成DEGs的预后模型。我们使用ROC曲线、Kaplan-Meier曲线和风险评分图来评估该特征的性能和预后能力。使用ESTIMATE、xCell和TIDE算法来探索风险评分与免疫景观之间的关系。作为最后一步,本研究开发了列线图,同时利用临床特征和预后模型。
在TCGA中有3211个DEGs,在GSE54129中有2371个DEGs,在GSE66229中有627个DEGs,在GSE64951中有329个DEGs被选为候选基因并进行交集以获得DEGs。总共,通过单变量Cox回归分析在TCGA队列中进一步筛选出208个DEGs。在此之后,利用LASSO回归生成6个DEGs的预后模型。外部验证显示出良好的预测效果。我们基于六基因特征研究了风险模型、免疫评分和免疫细胞浸润之间的相互作用。与低风险组相比,高风险组的ESTIMATE评分、免疫评分和基质评分显著升高。低风险组中CD4记忆T细胞、CD8幼稚T细胞、常见淋巴祖细胞、浆细胞样树突状细胞、γδT细胞和B细胞浆的比例显著富集。根据TIDE,低风险组的TIDE评分、排除评分和功能障碍评分低于高风险组。作为最后一步,本研究开发了列线图,同时利用临床特征和预后模型。
总之,我们发现了一个6基因特征来预测GC患者的总生存期。这种风险特征被证明是指导临床实践的有价值的临床预测工具。