• 文献检索
  • 文档翻译
  • 深度研究
  • 学术资讯
  • Suppr Zotero 插件Zotero 插件
  • 邀请有礼
  • 套餐&价格
  • 历史记录
应用&插件
Suppr Zotero 插件Zotero 插件浏览器插件Mac 客户端Windows 客户端微信小程序
定价
高级版会员购买积分包购买API积分包
服务
文献检索文档翻译深度研究API 文档MCP 服务
关于我们
关于 Suppr公司介绍联系我们用户协议隐私条款
关注我们

Suppr 超能文献

核心技术专利:CN118964589B侵权必究
粤ICP备2023148730 号-1Suppr @ 2026

文献检索

告别复杂PubMed语法,用中文像聊天一样搜索,搜遍4000万医学文献。AI智能推荐,让科研检索更轻松。

立即免费搜索

文件翻译

保留排版,准确专业,支持PDF/Word/PPT等文件格式,支持 12+语言互译。

免费翻译文档

深度研究

AI帮你快速写综述,25分钟生成高质量综述,智能提取关键信息,辅助科研写作。

立即免费体验

美国东北部癌症流行病学(2013-2017 年)。

Cancer Epidemiology in the Northeastern United States (2013-2017).

机构信息

Department of Epidemiology, Geisel School of Medicine at Dartmouth, Hanover, New Hampshire.

Dartmouth Cancer Center, Lebanon, New Hampshire.

出版信息

Cancer Res Commun. 2023 Aug 14;3(8):1538-1550. doi: 10.1158/2767-9764.CRC-23-0152. eCollection 2023 Aug.

DOI:10.1158/2767-9764.CRC-23-0152
PMID:37583435
原文链接:https://pmc.ncbi.nlm.nih.gov/articles/PMC10424700/
Abstract

UNLABELLED

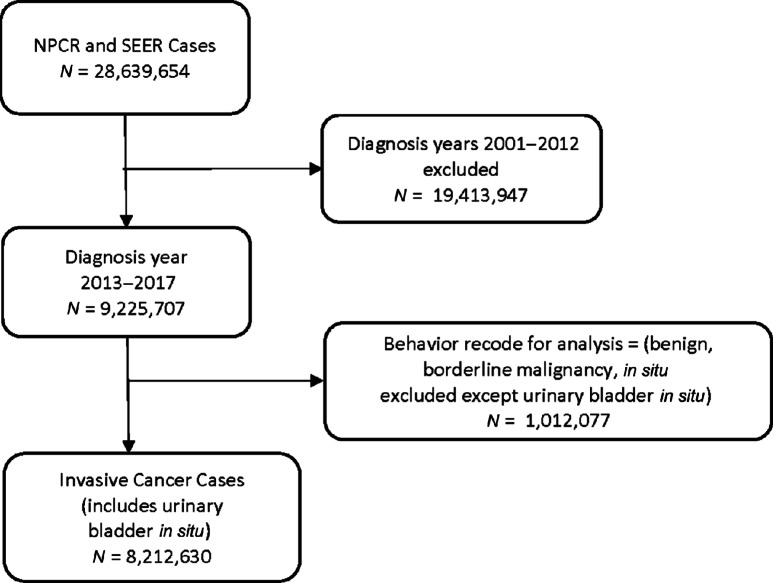
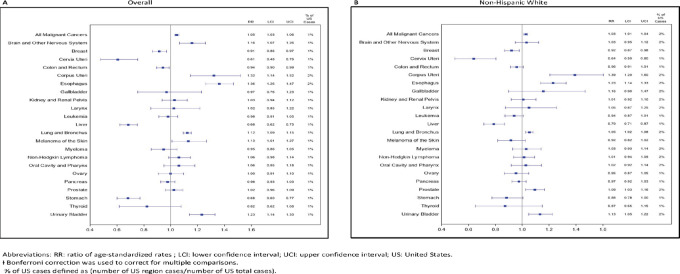
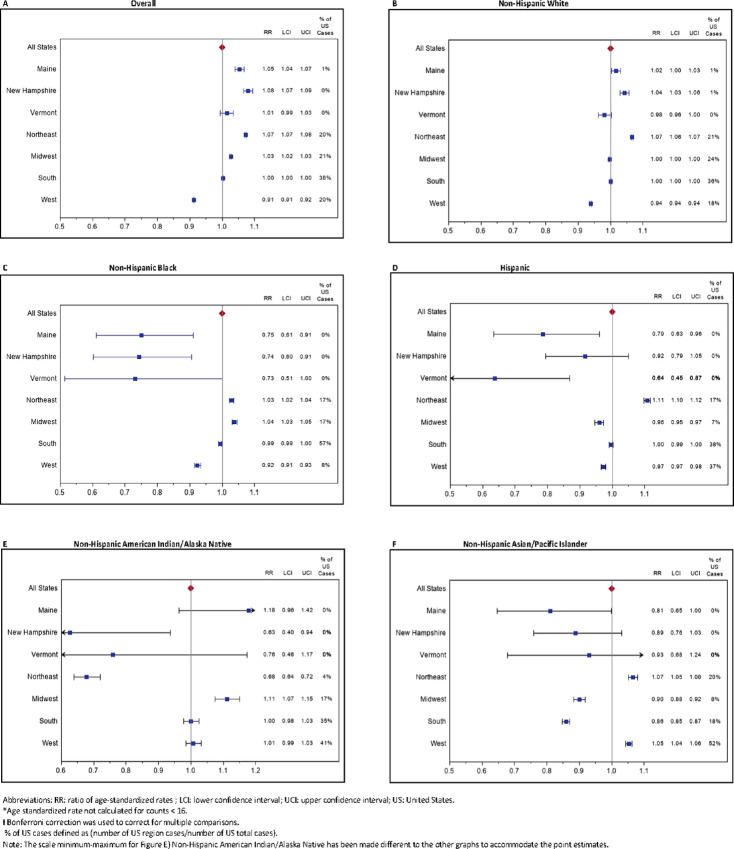
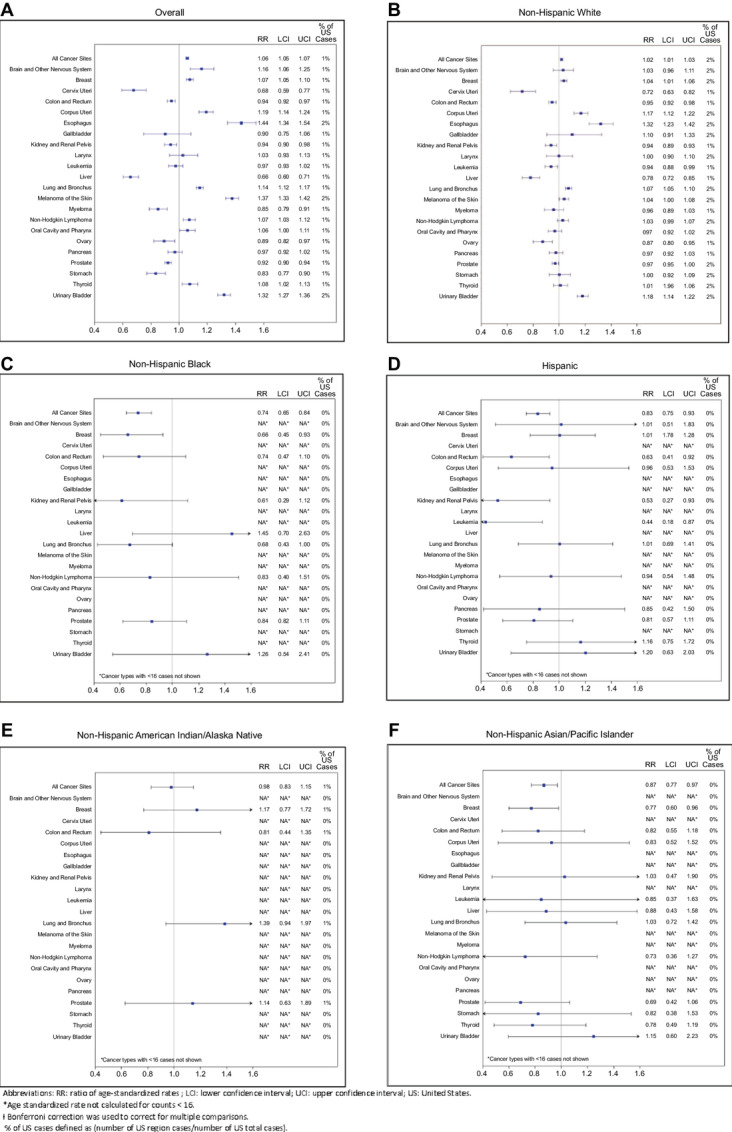
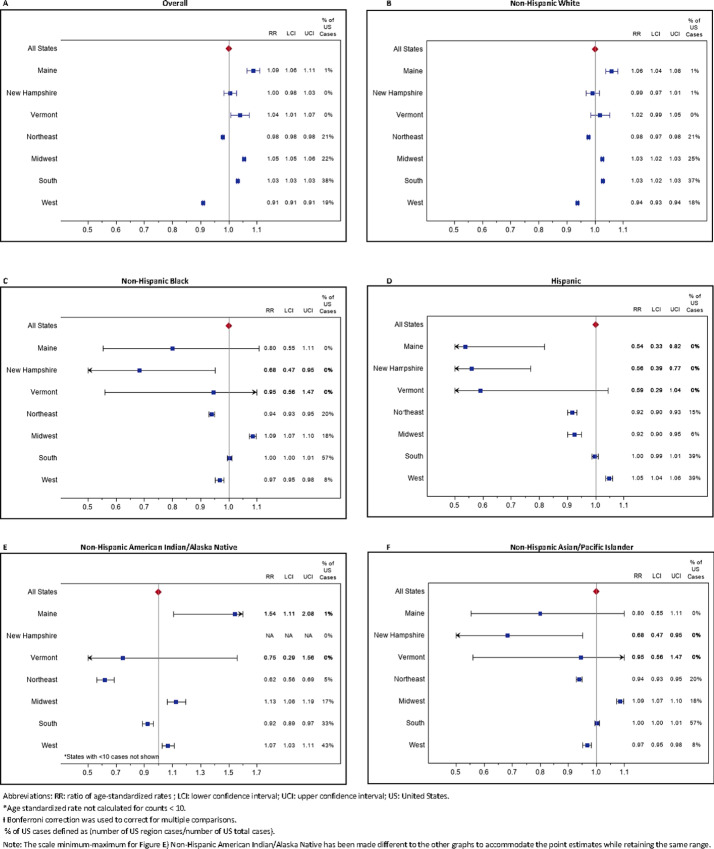
We tested the hypotheses that adult cancer incidence and mortality in the Northeast region and in Northern New England (NNE) were different than the rest of the United States, and described other related cancer metrics and risk factor prevalence. Using national, publicly available cancer registry data, we compared cancer incidence and mortality in the Northeast region with the United States and NNE with the United States overall and by race/ethnicity, using age-standardized cancer incidence and rate ratios (RR). Compared with the United States, age-adjusted cancer incidence in adults of all races combined was higher in the Northeast (RR, 1.07; 95% confidence interval [CI] 1.07-1.08) and in NNE (RR 1.06; CI 1.05-1.07). However compared with the United States, mortality was lower in the Northeast (RR, 0.98; CI 0.98-0.98) but higher in NNE (RR, 1.05; CI 1.03-1.06). Mortality in NNE was higher than the United States for cancers of the brain (RR, 1.16; CI 1.07-1.26), uterus (RR, 1.32; CI 1.14-1.52), esophagus (RR, 1.36; CI 1.26-1.47), lung (RR, 1.12; CI 1.09-1.15), bladder (RR, 1.23; CI 1.14-1.33), and melanoma (RR, 1.13; CI 1.01-1.27). Significantly higher overall cancer incidence was seen in the Northeast than the United States in all race/ethnicity subgroups except Native American/Alaska Natives (RR, 0.68; CI 0.64-0.72). In conclusion, NNE has higher cancer incidence and mortality than the United States, a pattern that contrasts with the Northeast region, which has lower cancer mortality overall than the United States despite higher incidence.

SIGNIFICANCE

These findings highlight the need to identify the causes of higher cancer incidence in the Northeast and the excess cancer mortality in NNE.

摘要

未加标签

我们检验了以下假设,即美国东北部和新英格兰北部(NNE)的成人癌症发病率和死亡率与美国其他地区不同,并且描述了其他相关的癌症指标和风险因素流行率。使用国家公开的癌症登记数据,我们比较了美国东北部和美国的癌症发病率和死亡率,以及 NNE 与美国整体的癌症发病率和死亡率,使用年龄标准化癌症发病率和率比(RR)。与美国相比,所有种族成年人的年龄调整癌症发病率在东北部(RR,1.07;95%置信区间[CI] 1.07-1.08)和 NNE(RR 1.06;CI 1.05-1.07)更高。然而,与美国相比,东北部的死亡率较低(RR,0.98;CI 0.98-0.98),但 NNE 较高(RR,1.05;CI 1.03-1.06)。NNE 的癌症死亡率高于美国的脑癌(RR,1.16;CI 1.07-1.26)、子宫癌(RR,1.32;CI 1.14-1.52)、食道癌(RR,1.36;CI 1.26-1.47)、肺癌(RR,1.12;CI 1.09-1.15)、膀胱癌(RR,1.23;CI 1.14-1.33)和黑色素瘤(RR,1.13;CI 1.01-1.27)。除了美国原住民/阿拉斯加原住民(RR,0.68;CI 0.64-0.72)外,所有种族/族裔亚组的东北部的总体癌症发病率均高于美国。总之,与美国东北部相比,NNE 的癌症发病率和死亡率更高,这一模式与东北部地区形成鲜明对比,尽管东北部地区的癌症死亡率总体上低于美国,但癌症死亡率却更高。

意义

这些发现强调了需要确定东北部地区癌症发病率上升的原因以及 NNE 地区癌症死亡率过高的原因。

https://cdn.ncbi.nlm.nih.gov/pmc/blobs/74d2/10424700/b0a476c98d9a/crc-23-0152_fig5.jpg
https://cdn.ncbi.nlm.nih.gov/pmc/blobs/74d2/10424700/3837b226f982/crc-23-0152_fig1.jpg
https://cdn.ncbi.nlm.nih.gov/pmc/blobs/74d2/10424700/a30b57e02261/crc-23-0152_fig2.jpg
https://cdn.ncbi.nlm.nih.gov/pmc/blobs/74d2/10424700/67e111b22f45/crc-23-0152_fig3.jpg
https://cdn.ncbi.nlm.nih.gov/pmc/blobs/74d2/10424700/0a145f1b3c83/crc-23-0152_fig4.jpg
https://cdn.ncbi.nlm.nih.gov/pmc/blobs/74d2/10424700/b0a476c98d9a/crc-23-0152_fig5.jpg

相似文献

1
Cancer Epidemiology in the Northeastern United States (2013-2017).美国东北部癌症流行病学(2013-2017 年)。
Cancer Res Commun. 2023 Aug 14;3(8):1538-1550. doi: 10.1158/2767-9764.CRC-23-0152. eCollection 2023 Aug.
2
Pediatric Cancer By Race, Ethnicity and Region in the United States.美国儿童癌症的种族、族裔和地区差异。
Cancer Epidemiol Biomarkers Prev. 2022 Oct 4;31(10):1896-1906. doi: 10.1158/1055-9965.EPI-22-0317.
3
Childhood cancer among Alaska Natives.阿拉斯加原住民中的儿童癌症。
Pediatrics. 2003 Nov;112(5):e396. doi: 10.1542/peds.112.5.e396.
4
The burden of sepsis-associated mortality in the United States from 1999 to 2005: an analysis of multiple-cause-of-death data.1999 年至 2005 年美国脓毒症相关死亡率负担:多死因数据分析。
Crit Care. 2009;13(1):R28. doi: 10.1186/cc7733. Epub 2009 Feb 27.
5
Racial/Ethnic Disparities in Prostate Cancer Incidence, Distant Stage Diagnosis, and Mortality by U.S. Census Region and Age Group, 2012-2015.2012-2015 年按美国人口普查区域和年龄组划分的前列腺癌发病率、远处诊断和死亡率的种族/民族差异。
Cancer Epidemiol Biomarkers Prev. 2020 Jul;29(7):1357-1364. doi: 10.1158/1055-9965.EPI-19-1344. Epub 2020 Apr 17.
6
Rates of Influenza-Associated Hospitalization, Intensive Care Unit Admission, and In-Hospital Death by Race and Ethnicity in the United States From 2009 to 2019.2009 年至 2019 年美国按种族和族裔划分的流感相关住院率、重症监护病房入院率和住院死亡率。
JAMA Netw Open. 2021 Aug 2;4(8):e2121880. doi: 10.1001/jamanetworkopen.2021.21880.
7
Risk of bladder cancer by geographic region in a U.S. cohort of male health professionals.美国男性健康专业人员队列中按地理区域划分的膀胱癌风险
Epidemiology. 2001 Nov;12(6):719-26. doi: 10.1097/00001648-200111000-00022.
8
Colorectal cancer incidence and survival among Alaska Natives, 1969-1993.1969 - 1993年阿拉斯加原住民的结直肠癌发病率与生存率
Int J Epidemiol. 1998 Jun;27(3):388-96. doi: 10.1093/ije/27.3.388.
9
Incidence of Death From Unintentional Injury Among Patients With Cancer in the United States.美国癌症患者非故意伤害致死的发生率。
JAMA Netw Open. 2020 Feb 5;3(2):e1921647. doi: 10.1001/jamanetworkopen.2019.21647.
10
Disparities in cancer mortality among Alaska Native people, 1994-2003.1994 - 2003年阿拉斯加原住民的癌症死亡率差异
Alaska Med. 2008 Jan-Mar;49(4):120-5.

本文引用的文献

1
Geographic Patterns in U.S. Lung Cancer Mortality and Cigarette Smoking.美国肺癌死亡率与吸烟的地理分布模式。
Cancer Epidemiol Biomarkers Prev. 2023 Feb 6;32(2):193-201. doi: 10.1158/1055-9965.EPI-22-0253.
2
Pediatric Cancer By Race, Ethnicity and Region in the United States.美国儿童癌症的种族、族裔和地区差异。
Cancer Epidemiol Biomarkers Prev. 2022 Oct 4;31(10):1896-1906. doi: 10.1158/1055-9965.EPI-22-0317.
3
Racial and socioeconomic inequities in breast cancer screening before and during the COVID-19 pandemic: analysis of two cohorts of women 50 years + .
新冠疫情前后乳腺癌筛查中的种族和社会经济不平等:对两个 50 岁及以上女性队列的分析。
Breast Cancer. 2022 Jul;29(4):740-746. doi: 10.1007/s12282-022-01352-2. Epub 2022 Apr 2.
4
Examining Rural-Urban Differences in Fatalism and Information Overload: Data from 12 NCI-Designated Cancer Centers.审视宿命论和信息过载城乡差异:来自 12 个 NCI 指定癌症中心的数据。
Cancer Epidemiol Biomarkers Prev. 2022 Feb;31(2):393-403. doi: 10.1158/1055-9965.EPI-21-0355. Epub 2022 Jan 28.
5
County-level characteristics associated with incidence, late-stage incidence, and mortality from screenable cancers.与可筛查癌症的发病率、晚期发病率和死亡率相关的县级特征。
Cancer Epidemiol. 2021 Dec;75:102033. doi: 10.1016/j.canep.2021.102033. Epub 2021 Sep 21.
6
Rural disparities in adolescent smoking prevalence.农村青少年吸烟率的差异。
J Rural Health. 2022 Mar;38(2):360-363. doi: 10.1111/jrh.12610. Epub 2021 Aug 2.
7
Variability in Collection and Use of Race/Ethnicity and Language Data in 93 Pediatric Hospitals.93 家儿童医院种族/民族和语言数据的收集和使用存在差异。
J Racial Ethn Health Disparities. 2020 Oct;7(5):928-936. doi: 10.1007/s40615-020-00716-8. Epub 2020 Feb 13.
8
Geographic disparities in cancer screening and fatalism among a nationally representative sample of US adults.美国成年人全国代表性样本中癌症筛查和宿命论的地理差异。
J Epidemiol Community Health. 2019 Dec;73(12):1128-1135. doi: 10.1136/jech-2019-212425. Epub 2019 Oct 14.
9
Ingested Nitrate and Nitrite and Bladder Cancer in Northern New England.新英格兰北部摄入的硝酸盐和亚硝酸盐与膀胱癌。
Epidemiology. 2020 Jan;31(1):136-144. doi: 10.1097/EDE.0000000000001112.
10
Making the invisible visible: results of a community-led health survey following PFAS contamination of drinking water in Merrimack, New Hampshire.使无形可见:新罕布什尔州梅里马克市饮用水中全氟和多氟烷基物质污染后,社区主导的健康调查结果。
Environ Health. 2019 Aug 30;18(1):79. doi: 10.1186/s12940-019-0513-3.