Department of Ecology, Evolution and Environmental Biology, Columbia University, New York, New York, United States of America.
Department of Integrative Biology, University of Texas Austin, Austin, Texas, United States of America.
PLoS One. 2023 Aug 21;18(8):e0289679. doi: 10.1371/journal.pone.0289679. eCollection 2023.
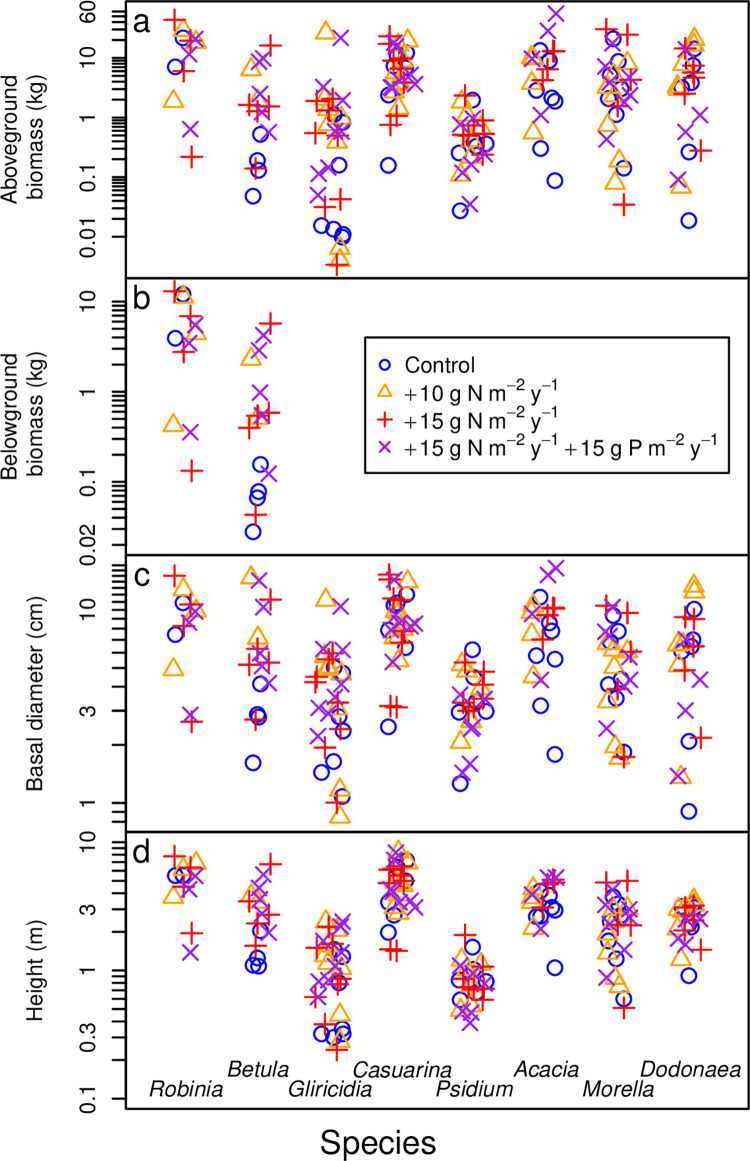
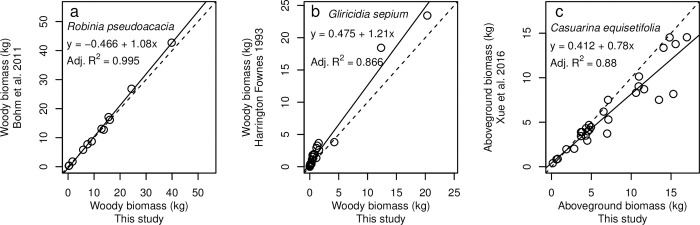
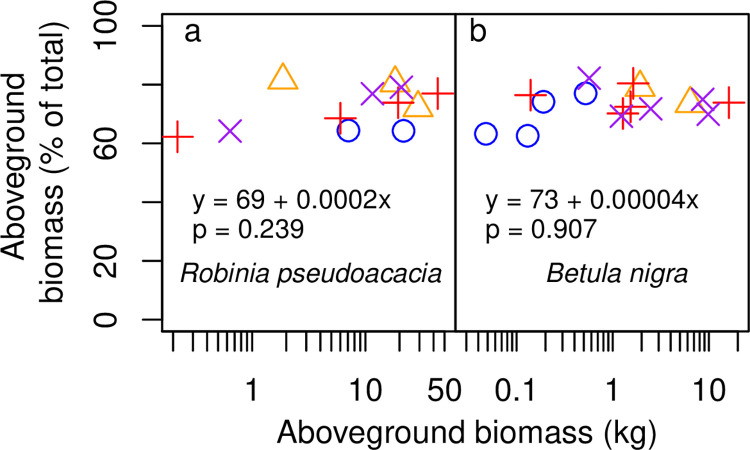
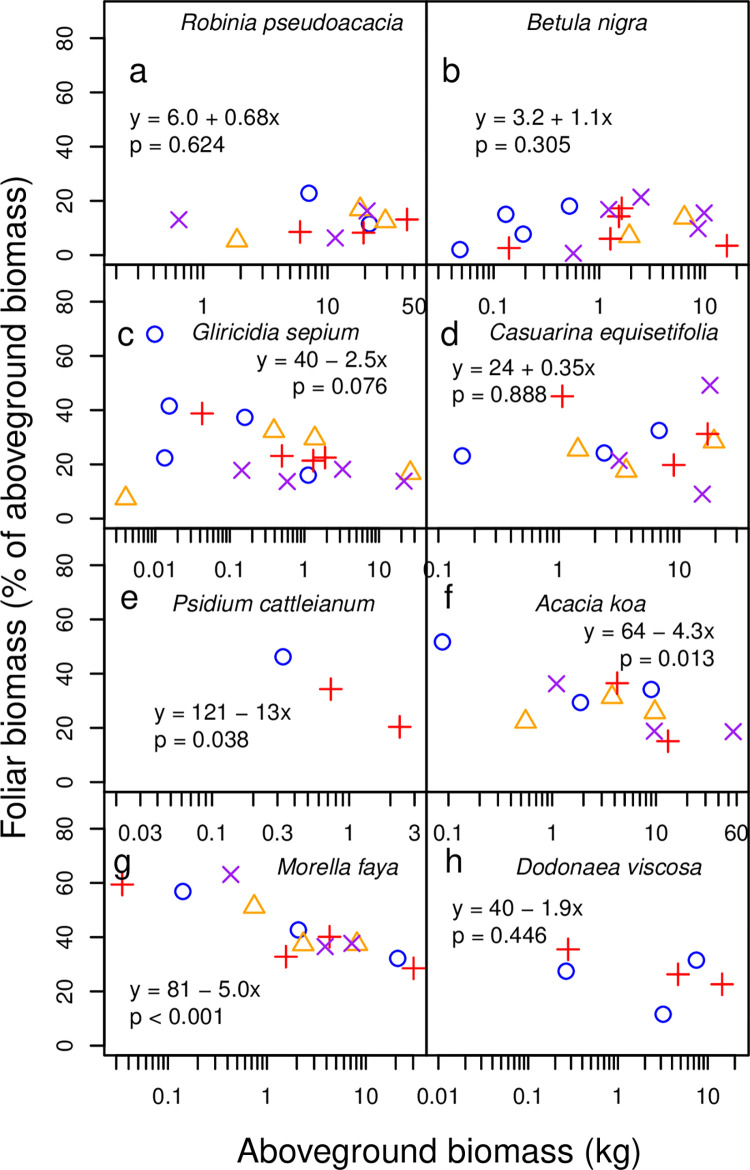
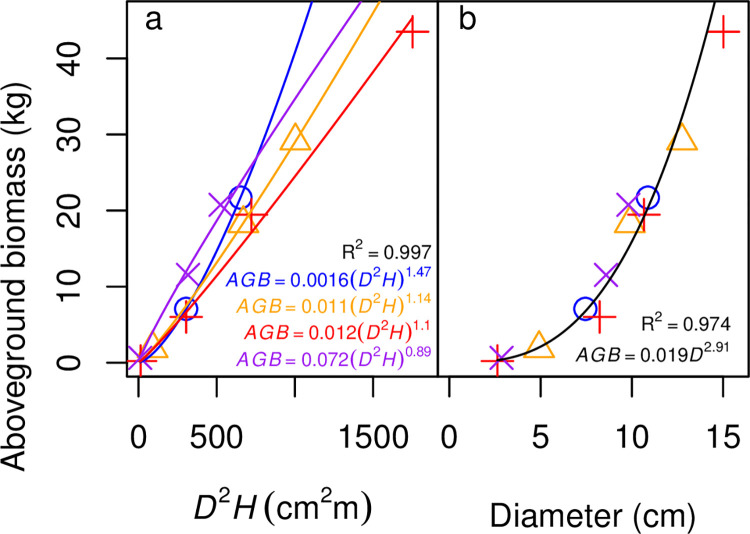
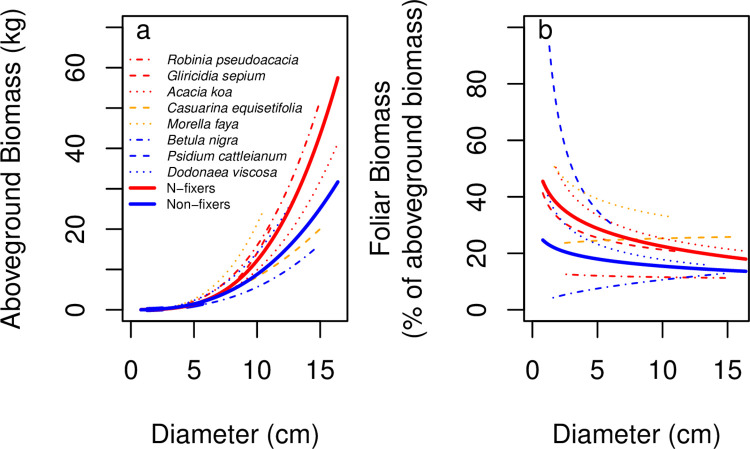
Allometric equations are often used to estimate plant biomass allocation to different tissue types from easier-to-measure quantities. Biomass allocation, and thus allometric equations, often differs by species and sometimes varies with nutrient availability. We measured biomass components for five nitrogen-fixing tree species (Robinia pseudoacacia, Gliricidia sepium, Casuarina equisetifolia, Acacia koa, Morella faya) and three non-fixing tree species (Betula nigra, Psidium cattleianum, Dodonaea viscosa) grown in field sites in New York and Hawaii for 4-5 years and subjected to four fertilization treatments. We measured total aboveground, foliar, main stem, secondary stem, and twig biomass in all species, and belowground biomass in Robinia pseudoacacia and Betula nigra, along with basal diameter, height, and canopy dimensions. The individuals spanned a wide size range (<1-16 cm basal diameter; 0.24-8.8 m height). For each biomass component, aboveground biomass, belowground biomass, and total biomass, we determined the following four allometric equations: the most parsimonious (lowest AIC) overall, the most parsimonious without a fertilization effect, the most parsimonious without canopy dimensions, and an equation with basal diameter only. For some species, the most parsimonious overall equation included fertilization effects, but fertilization effects were inconsistent across fertilization treatments. We therefore concluded that fertilization does not clearly affect allometric relationships in these species, size classes, and growth conditions. Our best-fit allometric equations without fertilization effects had the following R2 values: 0.91-0.99 for aboveground biomass (the range is across species), 0.95 for belowground biomass, 0.80-0.96 for foliar biomass, 0.94-0.99 for main stem biomass, 0.77-0.98 for secondary stem biomass, and 0.88-0.99 for twig biomass. Our equations can be used to estimate overall biomass and biomass of tissue components for these size classes in these species, and our results indicate that soil fertility does not need to be considered when using allometric relationships for these size classes in these species.
种间差异和养分可利用性有时会导致生物量分配和因此而产生的异速生长方程发生变化。我们在纽约和夏威夷的野外试验点测量了经过 4-5 年生长的 5 种固氮树种(刺槐、银合欢、木麻黄、南洋金合欢、杨梅)和 3 种非固氮树种(黑桦、番石榴、黄麻)的生物量组分,这 8 个树种接受了 4 种施肥处理。所有树种的地上总生物量、叶片生物量、主茎生物量、二级茎生物量和嫩枝生物量都进行了测量,而刺槐和黑桦的地下生物量以及基径、高度和冠幅也进行了测量。这些个体的大小范围很广(基径 1-16cm;高 0.24-8.8m)。对于每个生物量组分(地上生物量、地下生物量和总生物量),我们确定了以下四种异速生长方程:最简约(AIC 值最低)的总体方程、不包含施肥效应的最简约方程、不包含冠幅维度的最简约方程以及仅包含基径的方程。对于某些树种,最简约的总体方程包含施肥效应,但施肥效应在不同施肥处理之间并不一致。因此,我们得出结论,施肥并没有明显影响这些物种、大小类群和生长条件下的异速生长关系。我们的最佳拟合无施肥效应的异速生长方程的 R2 值如下:地上生物量为 0.91-0.99(范围是跨物种的),地下生物量为 0.95,叶片生物量为 0.80-0.96,主茎生物量为 0.94-0.99,二级茎生物量为 0.77-0.98,嫩枝生物量为 0.88-0.99。我们的方程可用于估计这些大小类群中这些物种的总体生物量和组织成分的生物量,我们的结果表明,在这些物种的这些大小类群中使用异速生长关系时,不需要考虑土壤肥力。