Gu Xiaojin, Strijbis Victor I J, Slotman Ben J, Dahele Max R, Verbakel Wilko F A R
Department of Radiation Oncology, Amsterdam UMC Location Vrije Universiteit Amsterdam, Amsterdam, Netherlands.
Cancer Center Amsterdam, Cancer Treatment and Quality of Life, Amsterdam, Netherlands.
Front Oncol. 2023 Sep 26;13:1251132. doi: 10.3389/fonc.2023.1251132. eCollection 2023.
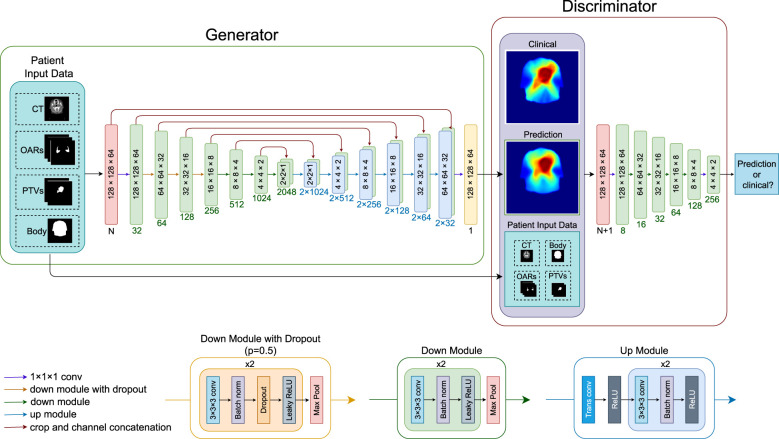
A three-dimensional deep generative adversarial network (GAN) was used to predict dose distributions for locally advanced head and neck cancer radiotherapy. Given the labor- and time-intensive nature of manual planning target volume (PTV) and organ-at-risk (OAR) segmentation, we investigated whether dose distributions could be predicted without the need for fully segmented datasets.
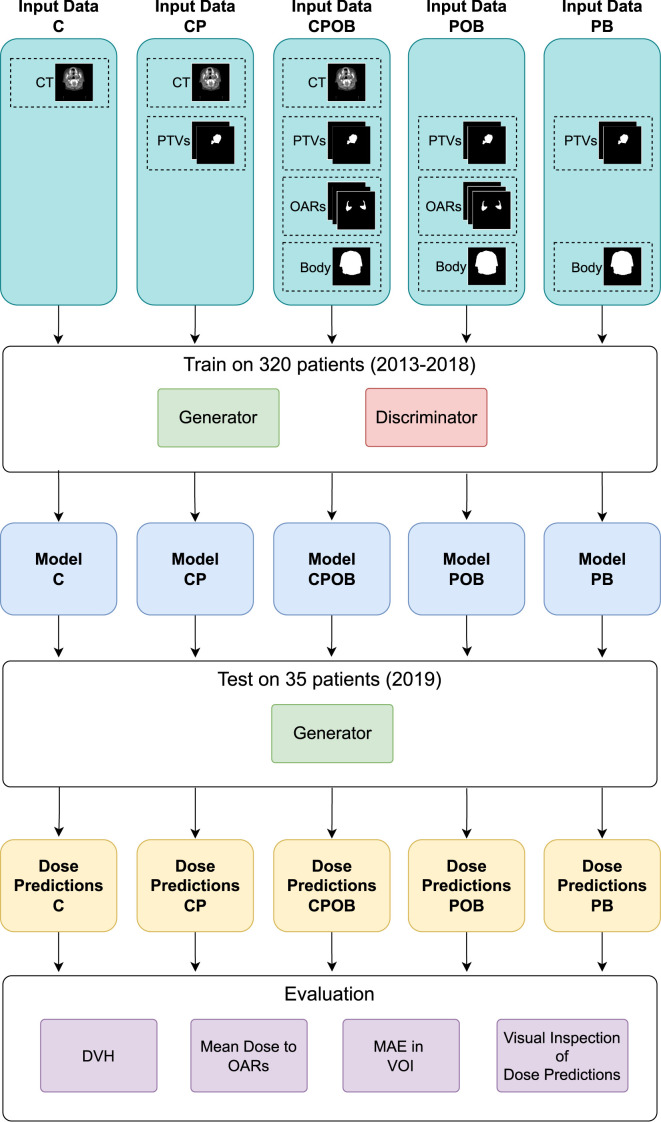
GANs were trained/validated/tested using 320/30/35 previously segmented CT datasets and treatment plans. The following input combinations were used to train and test the models: CT-scan only (C); CT+PTVboost/elective (CP); CT+PTVs+OARs+body structure (CPOB); PTVs+OARs+body structure (POB); PTVs+body structure (PB). Mean absolute errors (MAEs) for the predicted dose distribution and mean doses to individual OARs (individual salivary glands, individual swallowing structures) were analyzed.
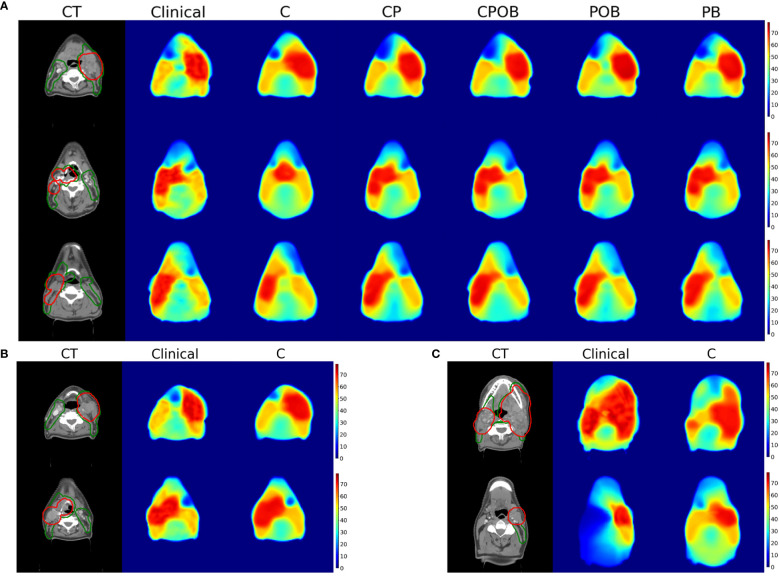
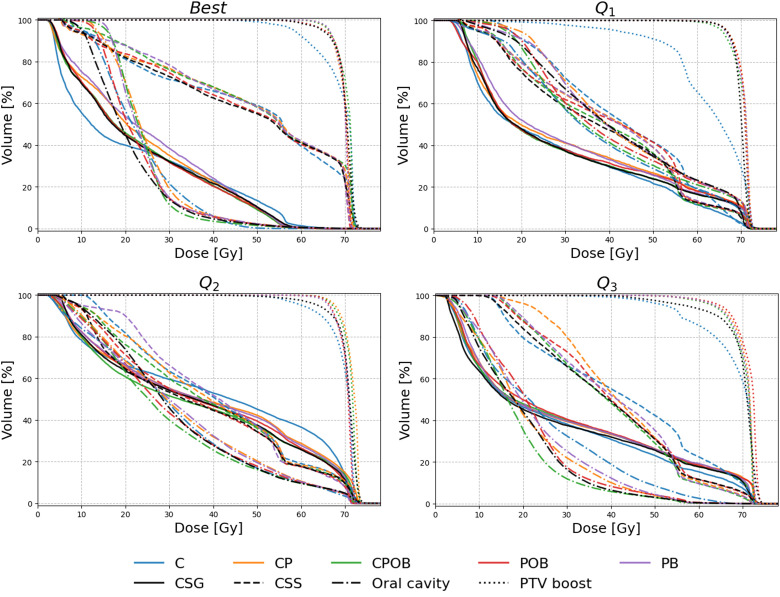
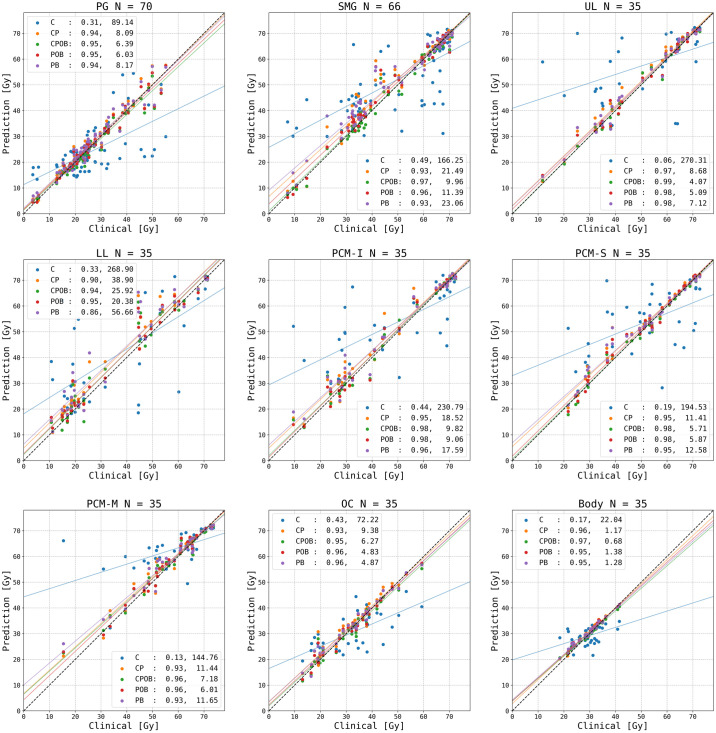
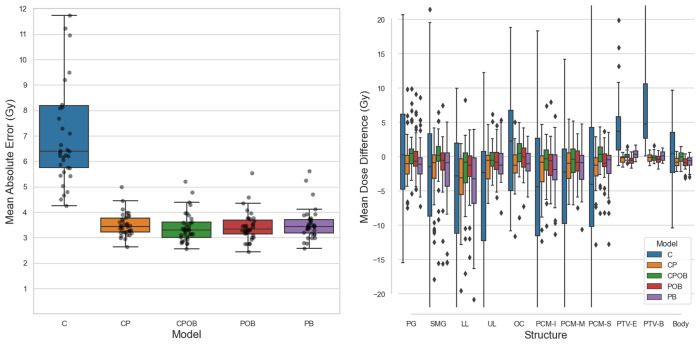
For the five models listed, MAEs were 7.3 Gy, 3.5 Gy, 3.4 Gy, 3.4 Gy, and 3.5 Gy, respectively, without significant differences among CP-CPOB, CP-POB, CP-PB, among CPOB-POB. Dose volume histograms showed that all four models that included PTV contours predicted dose distributions that had a high level of agreement with clinical treatment plans. The best model CPOB and the worst model PB (except model C) predicted mean dose to within ±3 Gy of the clinical dose, for 82.6%/88.6%/82.9% and 71.4%/67.1%/72.2% of all OARs, parotid glands (PG), and submandibular glands (SMG), respectively. The R values (0.17/0.96/0.97/0.95/0.95) of OAR mean doses for each model also indicated that except for model C, the predictions correlated highly with the clinical dose distributions. Interestingly model C could reasonably predict the dose in eight patients, but on average, it performed inadequately.
We demonstrated the influence of the CT scan, and PTV and OAR contours on dose prediction. Model CP was not statistically different from model CPOB and represents the minimum data statistically required to adequately predict the clinical dose distribution in a group of patients.
使用三维深度生成对抗网络(GAN)预测局部晚期头颈癌放疗的剂量分布。鉴于手动勾画计划靶区(PTV)和危及器官(OAR)的分割工作强度大且耗时,我们研究了是否无需完整分割数据集就能预测剂量分布。
使用320/30/35个先前分割的CT数据集和治疗计划对GAN进行训练/验证/测试。使用以下输入组合来训练和测试模型:仅CT扫描(C);CT + PTV增强/选择性靶区(CP);CT + PTVs + OARs + 身体结构(CPOB);PTVs + OARs + 身体结构(POB);PTVs + 身体结构(PB)。分析预测剂量分布的平均绝对误差(MAE)以及各个OAR(单个唾液腺、单个吞咽结构)的平均剂量。
对于列出的五个模型,MAE分别为7.3 Gy、3.5 Gy、3.4 Gy、3.4 Gy和3.5 Gy,CP - CPOB、CP - POB、CP - PB以及CPOB - POB之间无显著差异。剂量体积直方图显示,所有包含PTV轮廓的四个模型预测的剂量分布与临床治疗计划高度一致。最佳模型CPOB和最差模型PB(模型C除外)预测的平均剂量在临床剂量的±3 Gy范围内,分别占所有OAR、腮腺(PG)和下颌下腺(SMG)的82.6%/88.6%/82.9%和71.4%/67.1%/72.2%。每个模型的OAR平均剂量的R值(0.17/0.96/0.97/0.95/0.95)也表明,除模型C外,预测结果与临床剂量分布高度相关。有趣的是,模型C可以合理预测8名患者的剂量,但总体而言,其表现欠佳。
我们证明了CT扫描以及PTV和OAR轮廓对剂量预测的影响。模型CP与模型CPOB在统计学上无差异,代表了在一组患者中充分预测临床剂量分布所需的最少统计数据。