• 文献检索
  • 文档翻译
  • 深度研究
  • 学术资讯
  • Suppr Zotero 插件Zotero 插件
  • 邀请有礼
  • 套餐&价格
  • 历史记录
应用&插件
Suppr Zotero 插件Zotero 插件浏览器插件Mac 客户端Windows 客户端微信小程序
定价
高级版会员购买积分包购买API积分包
服务
文献检索文档翻译深度研究API 文档MCP 服务
关于我们
关于 Suppr公司介绍联系我们用户协议隐私条款
关注我们

Suppr 超能文献

核心技术专利:CN118964589B侵权必究
粤ICP备2023148730 号-1Suppr @ 2026

文献检索

告别复杂PubMed语法,用中文像聊天一样搜索,搜遍4000万医学文献。AI智能推荐,让科研检索更轻松。

立即免费搜索

文件翻译

保留排版,准确专业,支持PDF/Word/PPT等文件格式,支持 12+语言互译。

免费翻译文档

深度研究

AI帮你快速写综述,25分钟生成高质量综述,智能提取关键信息,辅助科研写作。

立即免费体验

存在偏差放大时 E 值的评估:一项模拟研究。

Assessment of the E-value in the presence of bias amplification: a simulation study.

机构信息

Medtronic, Plc, Minneapolis, MN, USA.

出版信息

BMC Med Res Methodol. 2024 Mar 28;24(1):79. doi: 10.1186/s12874-024-02196-4.

DOI:10.1186/s12874-024-02196-4
PMID:38539082
原文链接:https://pmc.ncbi.nlm.nih.gov/articles/PMC10976722/
Abstract

BACKGROUND

The E-value, a measure that has received recent attention in the comparative effectiveness literature, reports the minimum strength of association between an unmeasured confounder and the treatment and outcome that would explain away the estimated treatment effect. This study contributes to the literature on the applications and interpretations of E-values by examining how the E-value is impacted by data with varying levels of association of unobserved covariates with the treatment and outcome measure when covariate adjustment is applied. We calculate the E-value after using regression and propensity score methods (PSMs) to adjust for differences in observed covariates. Propensity score methods are a common observational research method used to balance observed covariates between treatment groups. In practice, researchers may assume propensity score methods that balance treatment groups across observed characteristics will extend to balance of unobserved characteristics. However, that assumption is not testable and has been shown to not hold in realistic data settings. We assess the E-value when covariate adjustment affects the imbalance in unobserved covariates.

METHODS

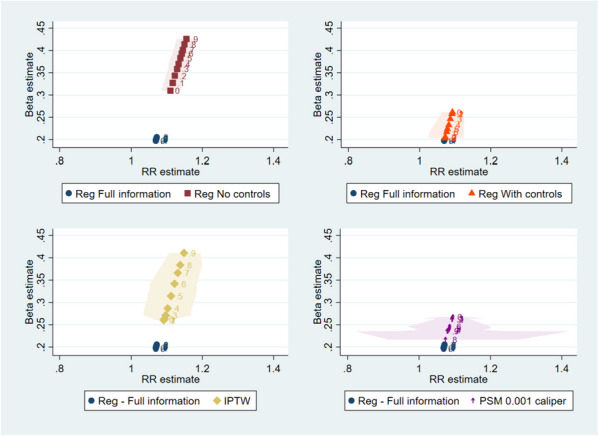
Our study uses Monte Carlo simulations to evaluate the impact of unobserved confounders on the treatment effect estimates and to evaluate the performance of the E-Value sensitivity test with the application of regression and propensity score methods under varying levels of unobserved confounding. Specifically, we compare observed and unobserved confounder balance, odds ratios of treatment vs. control, and E-Value sensitivity test statistics from generalized linear model (GLM) regression models, inverse-probability weighted models, and propensity score matching models, over correlations of increasing strength between observed and unobserved confounders.

RESULTS

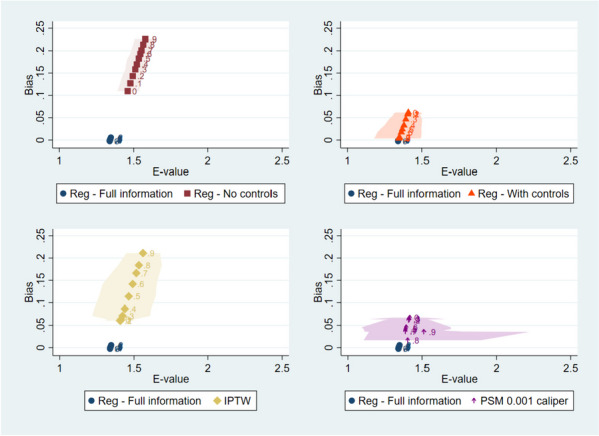
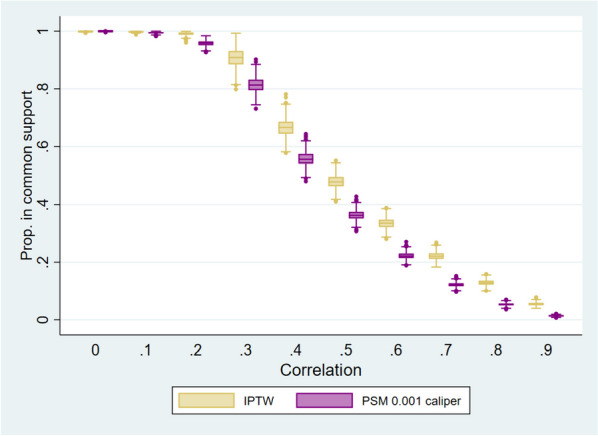
We confirm previous findings that propensity score methods - matching or weighting - may increase the imbalance in unobserved confounders. The magnitude of the effect depends on the strength of correlation between the confounder, treatment, and outcomes. We find that E-values calculated after applying propensity score methods tend to be larger when unobserved confounders result in more biased treatment effect estimates.

CONCLUSIONS

The E-Value may misrepresent the size of the unobserved effect needed to change the magnitude of the association between treatment and outcome when propensity score methods are used. Thus, caution is warranted when interpreting the E-Value in the context of propensity score methods.

摘要

背景

E 值是一种最近在比较效果文献中受到关注的衡量标准,它报告了未测量混杂因素与治疗和结局之间的关联强度的最小值,这种关联强度足以说明估计的治疗效果。本研究通过检查在应用协变量调整时,当未观察到的协变量与治疗和结局测量值的关联程度不同时,E 值如何受到数据的影响,为 E 值的应用和解释文献做出了贡献。我们使用回归和倾向评分方法(PSM)来调整观察到的协变量的差异后,计算 E 值。倾向评分方法是一种常用的观察性研究方法,用于在治疗组之间平衡观察到的协变量。在实践中,研究人员可能假设,平衡治疗组在观察到的特征上的倾向评分方法将扩展到平衡未观察到的特征。然而,该假设是不可检验的,并且在现实数据设置中并不成立。我们评估了当协变量调整影响未观察到的协变量不平衡时的 E 值。

方法

我们的研究使用蒙特卡罗模拟来评估未观察到的混杂因素对治疗效果估计的影响,并评估在不同程度的未观察到的混杂情况下,应用回归和倾向评分方法对 E 值敏感性测试的性能。具体来说,我们比较了观察到的和未观察到的混杂因素平衡、治疗与对照的比值比,以及来自广义线性模型(GLM)回归模型、逆概率加权模型和倾向评分匹配模型的 E 值敏感性测试统计量,这些模型在观察到的和未观察到的混杂因素之间的相关性逐渐增强的情况下。

结果

我们证实了以前的发现,即倾向评分方法(匹配或加权)可能会增加未观察到的混杂因素的不平衡。这种影响的大小取决于混杂因素、治疗和结局之间的相关性强度。我们发现,当未观察到的混杂因素导致治疗效果估计更偏倚时,应用倾向评分方法后计算的 E 值往往更大。

结论

当使用倾向评分方法时,E 值可能无法准确反映改变治疗与结局之间关联强度所需的未观察到的效应大小。因此,在解释倾向评分方法背景下的 E 值时,需要谨慎。

https://cdn.ncbi.nlm.nih.gov/pmc/blobs/3e36/10976722/53584a1d3442/12874_2024_2196_Fig4_HTML.jpg
https://cdn.ncbi.nlm.nih.gov/pmc/blobs/3e36/10976722/087c0d9cb73e/12874_2024_2196_Fig1_HTML.jpg
https://cdn.ncbi.nlm.nih.gov/pmc/blobs/3e36/10976722/04a7ab5da550/12874_2024_2196_Fig2_HTML.jpg
https://cdn.ncbi.nlm.nih.gov/pmc/blobs/3e36/10976722/5dd2857cc5d8/12874_2024_2196_Fig3_HTML.jpg
https://cdn.ncbi.nlm.nih.gov/pmc/blobs/3e36/10976722/53584a1d3442/12874_2024_2196_Fig4_HTML.jpg

相似文献

1
Assessment of the E-value in the presence of bias amplification: a simulation study.存在偏差放大时 E 值的评估:一项模拟研究。
BMC Med Res Methodol. 2024 Mar 28;24(1):79. doi: 10.1186/s12874-024-02196-4.
2
Folic acid supplementation and malaria susceptibility and severity among people taking antifolate antimalarial drugs in endemic areas.在流行地区,服用抗叶酸抗疟药物的人群中,叶酸补充剂与疟疾易感性和严重程度的关系。
Cochrane Database Syst Rev. 2022 Feb 1;2(2022):CD014217. doi: 10.1002/14651858.CD014217.
3
The impact of moderator by confounder interactions in the assessment of treatment effect modification: a simulation study.调节变量与混杂因素交互作用对治疗效果修饰评估的影响:一项模拟研究。
BMC Med Res Methodol. 2022 Apr 3;22(1):88. doi: 10.1186/s12874-022-01519-7.
4
Genetic matching for time-dependent treatments: a longitudinal extension and simulation study.基于时间的治疗方法的遗传匹配:纵向扩展与模拟研究。
BMC Med Res Methodol. 2023 Aug 9;23(1):181. doi: 10.1186/s12874-023-01995-5.
5
The performance of different propensity score methods for estimating marginal hazard ratios.不同倾向评分方法估计边缘风险比的性能。
Stat Med. 2013 Jul 20;32(16):2837-49. doi: 10.1002/sim.5705. Epub 2012 Dec 12.
6
Bias associated with using the estimated propensity score as a regression covariate.与将估计的倾向得分用作回归协变量相关的偏差。
Stat Med. 2014 Jan 15;33(1):74-87. doi: 10.1002/sim.5884. Epub 2013 Jun 21.
7
Propensity Score Weighting and Trimming Strategies for Reducing Variance and Bias of Treatment Effect Estimates: A Simulation Study.倾向评分加权和修剪策略可减少治疗效果估计的方差和偏差:一项模拟研究。
Am J Epidemiol. 2021 Aug 1;190(8):1659-1670. doi: 10.1093/aje/kwab041.
8
Comparison of the ability of double-robust estimators to correct bias in propensity score matching analysis. A Monte Carlo simulation study.双重稳健估计在倾向评分匹配分析中校正偏差的能力比较。一项蒙特卡罗模拟研究。
Pharmacoepidemiol Drug Saf. 2017 Dec;26(12):1513-1519. doi: 10.1002/pds.4325. Epub 2017 Oct 6.
9
Double-adjustment in propensity score matching analysis: choosing a threshold for considering residual imbalance.倾向得分匹配分析中的双重调整:选择一个用于考虑残余不平衡的阈值。
BMC Med Res Methodol. 2017 Apr 28;17(1):78. doi: 10.1186/s12874-017-0338-0.
10
Squeezing the balloon: propensity scores and unmeasured covariate balance.挤压气球:倾向评分与未测量协变量平衡。
Health Serv Res. 2013 Aug;48(4):1487-507. doi: 10.1111/1475-6773.12020. Epub 2012 Dec 6.

本文引用的文献

1
Sensitivity analyses informed by tests for bias in observational studies.基于观察性研究偏倚检验的敏感性分析。
Biometrics. 2023 Mar;79(1):475-487. doi: 10.1111/biom.13558. Epub 2021 Sep 21.
2
Assessing the impact of unmeasured confounders for credible and reliable real-world evidence.评估未测量混杂因素对可信可靠真实世界证据的影响。
Pharmacoepidemiol Drug Saf. 2020 Oct;29(10):1219-1227. doi: 10.1002/pds.5117. Epub 2020 Sep 14.
3
Commentary: Developing best-practice guidelines for the reporting of E-values.评论:制定E值报告的最佳实践指南。
Int J Epidemiol. 2020 Oct 1;49(5):1495-1497. doi: 10.1093/ije/dyaa094.
4
Use of E-values for addressing confounding in observational studies-an empirical assessment of the literature.使用 E 值解决观察性研究中的混杂问题——文献的实证评估。
Int J Epidemiol. 2020 Oct 1;49(5):1482-1494. doi: 10.1093/ije/dyz261.
5
Limitations and Misinterpretations of E-Values for Sensitivity Analyses of Observational Studies.观察性研究敏感性分析中 E 值的局限性和误解。
Ann Intern Med. 2019 Jan 15;170(2):108-111. doi: 10.7326/M18-2159. Epub 2019 Jan 1.
6
Matching and Regression to the Mean in Difference-in-Differences Analysis.双重差分分析中的匹配与均值回归
Health Serv Res. 2018 Dec;53(6):4138-4156. doi: 10.1111/1475-6773.12993. Epub 2018 Jun 29.
7
Instrumental variables as bias amplifiers with general outcome and confounding.作为具有一般结果和混杂因素的偏差放大器的工具变量。
Biometrika. 2017 Jun 1;104(2):291-302. doi: 10.1093/biomet/asx009. Epub 2017 Apr 17.
8
Sensitivity Analysis in Observational Research: Introducing the E-Value.观察性研究中的敏感性分析:引入 E 值。
Ann Intern Med. 2017 Aug 15;167(4):268-274. doi: 10.7326/M16-2607. Epub 2017 Jul 11.
9
Sensitivity Analysis for Unmeasured Confounding: E-Values for Observational Studies.未测量混杂因素的敏感性分析:观察性研究的E值
Ann Intern Med. 2017 Aug 15;167(4):285-286. doi: 10.7326/M17-1485. Epub 2017 Jul 11.
10
Bias Analysis for Uncontrolled Confounding in the Health Sciences.健康科学中未控制混杂的偏倚分析。
Annu Rev Public Health. 2017 Mar 20;38:23-38. doi: 10.1146/annurev-publhealth-032315-021644. Epub 2017 Jan 6.