• 文献检索
  • 文档翻译
  • 深度研究
  • 学术资讯
  • Suppr Zotero 插件Zotero 插件
  • 邀请有礼
  • 套餐&价格
  • 历史记录
应用&插件
Suppr Zotero 插件Zotero 插件浏览器插件Mac 客户端Windows 客户端微信小程序
定价
高级版会员购买积分包购买API积分包
服务
文献检索文档翻译深度研究API 文档MCP 服务
关于我们
关于 Suppr公司介绍联系我们用户协议隐私条款
关注我们

Suppr 超能文献

核心技术专利:CN118964589B侵权必究
粤ICP备2023148730 号-1Suppr @ 2026

文献检索

告别复杂PubMed语法,用中文像聊天一样搜索,搜遍4000万医学文献。AI智能推荐,让科研检索更轻松。

立即免费搜索

文件翻译

保留排版,准确专业,支持PDF/Word/PPT等文件格式,支持 12+语言互译。

免费翻译文档

深度研究

AI帮你快速写综述,25分钟生成高质量综述,智能提取关键信息,辅助科研写作。

立即免费体验

波兰的强降雨及其雨型。

Heavy rainfalls in Poland and their hyetographs.

机构信息

RETENCJAPL Sp. Z o.o., Marynarki Polskiej 163, 80-868, Gdańsk, Poland.

Faculty of Natural Sciences, University of Silesia in Katowice, Będzińska 60, 41-200, Sosnowiec, Poland.

出版信息

Ambio. 2025 Jan;54(1):86-104. doi: 10.1007/s13280-024-02069-6. Epub 2024 Sep 16.

DOI:10.1007/s13280-024-02069-6
PMID:39283542
原文链接:https://pmc.ncbi.nlm.nih.gov/articles/PMC11607261/
Abstract

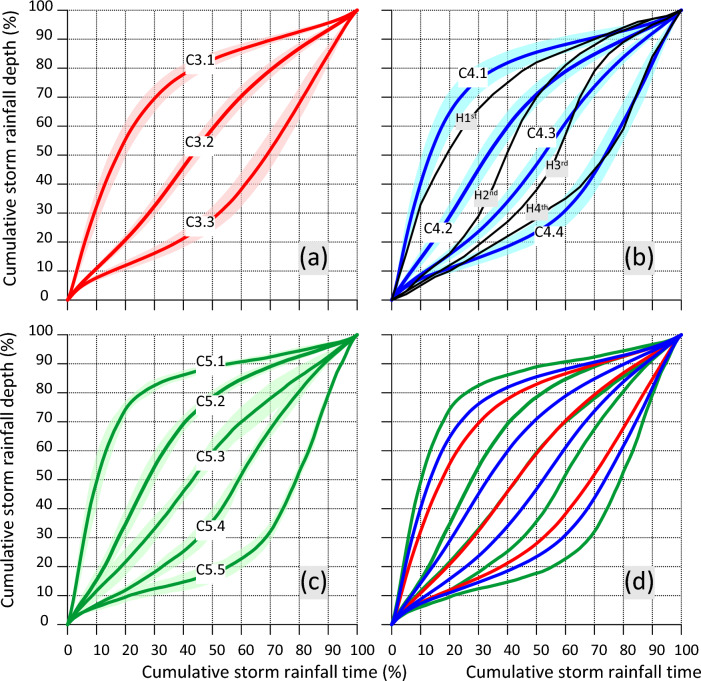
In the light of observed variability in precipitation patterns, there is a growing need for comprehensive data mining of regularly updated rainfall recording databases. Therefore, an analysis of heavy rainfall and hyetographs was conducted using a 30-year high-resolution dataset from 100 rain gauges across Poland, covering 31 646 rainfall events. Distributions of rainfall depths, durations, and intensities were explored, and maxima were compared to global records. Spatial analysis revealed significant variations in the frequency, depths, and durations of extreme rainfall across different regions. Cluster analysis determined model hyetographs for each station. The likelihood of regions belonging to clusters with three to five model hyetographs was assessed using Indicator Kriging. Findings underscore the importance of using local, characteristics rainfalls in hydrodynamic modelling of drainage systems and future rainfall scenarios. These results provide a foundational step towards understanding and monitoring the impacts of climate change on rainfall characteristics, especially extremes, in future decades.

摘要

鉴于降水模式的可变性,人们越来越需要对定期更新的降雨记录数据库进行全面的数据挖掘。因此,使用波兰 100 个雨量计的 30 年高分辨率数据集,对大雨和降雨强度图进行了分析,涵盖了 31646 次降雨事件。探讨了降雨深度、持续时间和强度的分布,并将最大值与全球记录进行了比较。空间分析显示,不同地区极端降雨的频率、深度和持续时间存在显著差异。聚类分析确定了每个站点的模型降雨强度图。使用指示克里金法评估了区域属于具有三到五个模型降雨强度图的聚类的可能性。研究结果强调了在排水系统的水动力模型中使用当地特征降雨和未来降雨情景的重要性。这些结果为了解和监测未来几十年气候变化对降雨特征(尤其是极端情况)的影响提供了一个基础步骤。

https://cdn.ncbi.nlm.nih.gov/pmc/blobs/2a92/11607261/86cab8090394/13280_2024_2069_Fig6_HTML.jpg
https://cdn.ncbi.nlm.nih.gov/pmc/blobs/2a92/11607261/85ee38542a55/13280_2024_2069_Fig1_HTML.jpg
https://cdn.ncbi.nlm.nih.gov/pmc/blobs/2a92/11607261/c425c6eabb04/13280_2024_2069_Fig2_HTML.jpg
https://cdn.ncbi.nlm.nih.gov/pmc/blobs/2a92/11607261/92d47ccf9d68/13280_2024_2069_Fig3_HTML.jpg
https://cdn.ncbi.nlm.nih.gov/pmc/blobs/2a92/11607261/2ebcf9e16c04/13280_2024_2069_Fig4_HTML.jpg
https://cdn.ncbi.nlm.nih.gov/pmc/blobs/2a92/11607261/c4bfee268e0e/13280_2024_2069_Fig5_HTML.jpg
https://cdn.ncbi.nlm.nih.gov/pmc/blobs/2a92/11607261/86cab8090394/13280_2024_2069_Fig6_HTML.jpg

相似文献

1
Heavy rainfalls in Poland and their hyetographs.波兰的强降雨及其雨型。
Ambio. 2025 Jan;54(1):86-104. doi: 10.1007/s13280-024-02069-6. Epub 2024 Sep 16.
2
Development of cluster analysis methodology for identification of model rainfall hyetographs and its application at an urban precipitation field scale.聚类分析方法的发展及其在城市降水场尺度模型雨型识别中的应用。
Sci Total Environ. 2022 Jul 10;829:154588. doi: 10.1016/j.scitotenv.2022.154588. Epub 2022 Mar 16.
3
Trend analysis of extreme rainfall indices from CHIRPS precipitation estimates over the Lake Tana sub-basin, Abbay Basin of Ethiopia.埃塞俄比亚塔纳湖子流域、阿巴亚流域 CHIRPS 降水估算极端降水指数的趋势分析。
Environ Monit Assess. 2024 May 24;196(6):575. doi: 10.1007/s10661-024-12722-y.
4
Assessing the impact of climate change on Combined Sewer Overflows based on small time step future rainfall timeseries and long-term continuous sewer network modelling.基于小时间步长未来降雨时间序列和长期连续污水管网模型评估气候变化对合流制溢流的影响。
Water Res. 2023 Feb 15;230:119504. doi: 10.1016/j.watres.2022.119504. Epub 2022 Dec 18.
5
Regional frequency analysis of short duration rainfall extremes using gridded daily rainfall data as co-variate.使用网格化日降雨数据作为协变量对短历时极端降雨进行区域频率分析。
Water Sci Technol. 2017 Apr;75(7-8):1971-1981. doi: 10.2166/wst.2017.089.
6
Regional frequency analysis of extreme rainfalls.极端降雨的区域频率分析
Water Sci Technol. 2002;45(2):75-81.
7
The effect of climate change on urban drainage: an evaluation based on regional climate model simulation.气候变化对城市排水的影响:基于区域气候模型模拟的评估
Water Sci Technol. 2006;54(6-7):9-15. doi: 10.2166/wst.2006.592.
8
Recent and future changes in extreme rainfall in the Catskills region of New York.纽约卡茨基尔地区极端降雨的近期及未来变化
Ann N Y Acad Sci. 2013 Sep;1298:43-51. doi: 10.1111/nyas.12245. Epub 2013 Aug 22.
9
Impacts of rainfall variability and expected rainfall changes on cost-effective adaptation of water systems to climate change.降雨变率和预期降雨变化对水系统适应气候变化的成本效益的影响。
J Environ Manage. 2015 May 1;154:40-7. doi: 10.1016/j.jenvman.2015.02.016. Epub 2015 Feb 18.
10
Quality-control of an hourly rainfall dataset and climatology of extremes for the UK.英国每小时降雨数据集的质量控制与极端气候学
Int J Climatol. 2017 Feb;37(2):722-740. doi: 10.1002/joc.4735. Epub 2016 Apr 24.

本文引用的文献

1
Development of cluster analysis methodology for identification of model rainfall hyetographs and its application at an urban precipitation field scale.聚类分析方法的发展及其在城市降水场尺度模型雨型识别中的应用。
Sci Total Environ. 2022 Jul 10;829:154588. doi: 10.1016/j.scitotenv.2022.154588. Epub 2022 Mar 16.
2
Global, Regional, and Megacity Trends in the Highest Temperature of the Year: Diagnostics and Evidence for Accelerating Trends.全球、区域及特大城市年度最高气温趋势:加速趋势的诊断与证据
Earths Future. 2018 Jan;6(1):71-79. doi: 10.1002/2017EF000709. Epub 2018 Jan 22.
3
Anthropogenic greenhouse gas contribution to flood risk in England and Wales in autumn 2000.
人为温室气体对 2000 年秋英格兰和威尔士洪水风险的贡献。
Nature. 2011 Feb 17;470(7334):382-5. doi: 10.1038/nature09762.