Heald Adrian H, Stedman Mike, Warner-Levy John, Belston Lleyton, Paisley Angela, Jotic Aleksandra, Lalic Nebojsa, Gibson Martin, Habte-Asres Hellena H, Whyte Martin, Forbes Angus
The School of Medicine and Manchester Academic Health Sciences Centre, Manchester University, Manchester, UK.
Department of Endocrinology and Diabetes, Salford Royal Hospital, Salford, UK.
Diabetes Ther. 2024 Dec;15(12):2475-2487. doi: 10.1007/s13300-024-01647-x. Epub 2024 Oct 23.
Since the introduction of insulin therapy, it has become apparent that type 1 diabetes (T1D) is accompanied by long-term microvascular and macrovascular complications. In the context of the many benefits of continuous glucose monitoring (CGM), there remain opportunities to study the large amount of data now available in order to maximise its potential in the endeavour to reduce the occurrence of diabetes tissue complications in the longer term.
Continuous glucose monitoring values were downloaded for 89 type 1 diabetes mellitus (T1D) individuals for up to 18 months from 2021 to 2023. Data for patient demographics was also taken from the patient record which included Sex, Date of Birth, and Date of Diagnosis. The recorded laboratory glycated haemoglobin (HbA1c) test results were also recorded. The glucose management index (GMI) was calculated from average glucose readings for 18 months using the formula GMI (%) = (0.82 - (Average glucose/100)). This was then adjusted to give GMI (mmol/mol) = 10.929 * (GMI (%) - 2.15). Average Glucose Fluctuation (AGF) was calculated by adding up the total absolute change value between all recorded results over 18 months and dividing by the number of results minus one. The % Above Critical Threshold (ACT) was calculated by summing the total number of occurrences for each result value. A cumulative 95% limit was then applied to identify the glucose value that only 5% of results exceeded in the overall population. Using this value, we estimated the percentage of total tests that were above the Critical Threshold (ACT).
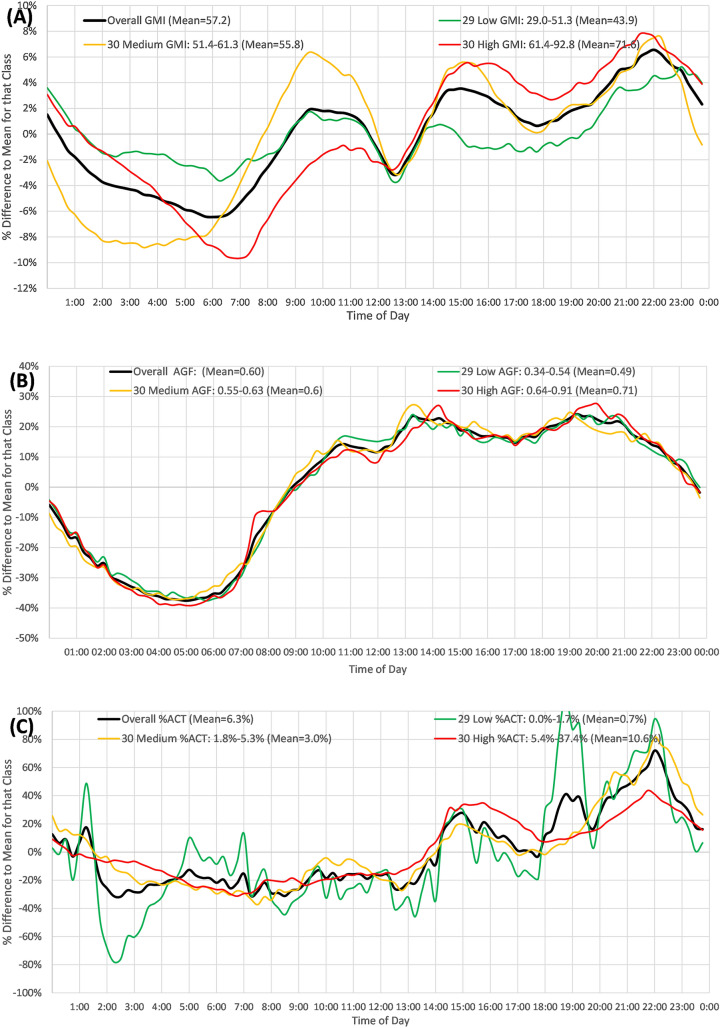
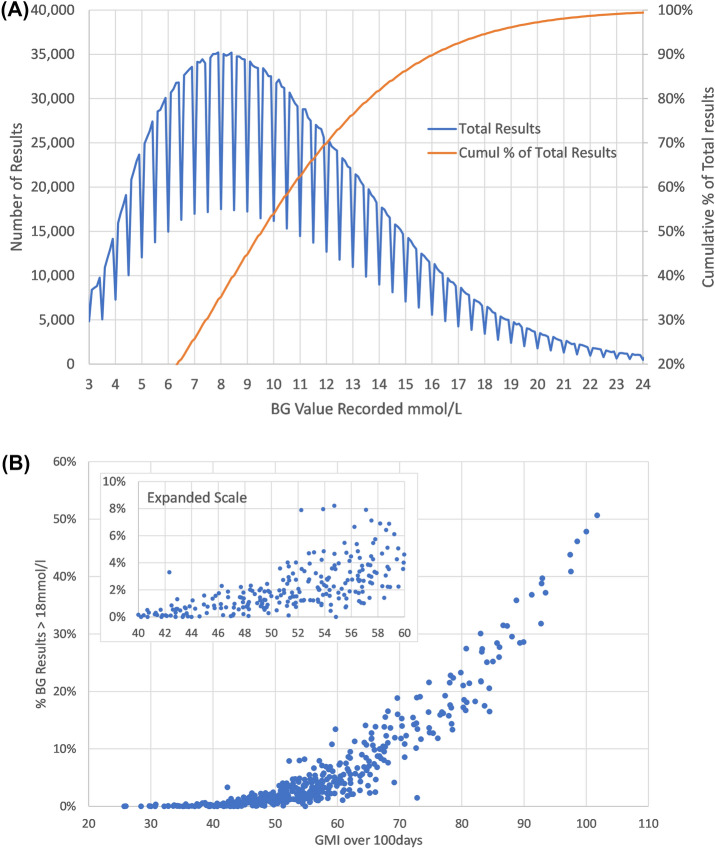
The mean age of the participants was 42.6 years, and the mean duration of T1D was 18.4 years. A total of 3.22 million readings were analysed, yielding an average blood glucose level of 10.3 mmol/l and a GMI of 57.2 mmol/mol. There was a strong correlation between GMI and measured HbA1c (r = 0.82). However, there were patients who had an above-critical threshold (ACT) of 4-10% at a GMI of 60 mmol/mol or less. The percentage average value at the time of day (%AVTD) was applied to all blood glucose readings at each 15-min interval throughout the day, averaged over 18 months. The %AVTD of GMI (overall average 57.2 mmol/mol) increased after midday, dipped at 18:00, and peaked at 22:00. The %AVTD of AGF (overall average 0.60 mmol/l) showed higher change rates after 09:00 declining at the end of the day. The %AVTD of ACT peaked at 22:00, with those having the highest %ACT showing an additional peak at 15:00.
We have shown here that the percentage glucose results above 18 mmol/l (top 5% of distribution) increased exponentially above 54 mmol/mol HbA1c. The %AVTD is introduced as a useful measure. Our data indicate that over the 24-h period, improvement in metabolic control could be focussed on the afternoon and evening, when there are higher-than-average levels of GMI, a higher-than-average degree of glucose change, and higher-than-average risks of being above the critical threshold. In conclusion, a measure of glycaemic variation based on the amplitude of glucose change to a population mean could be used to provide valuable clinical insights into glucose change over a 24-h period.
自胰岛素疗法问世以来,1型糖尿病(T1D)会伴随长期微血管和大血管并发症这一点已变得很明显。在连续血糖监测(CGM)有诸多益处的背景下,仍有机会研究现有的大量数据,以便在长期努力降低糖尿病组织并发症发生率方面最大限度地发挥其潜力。
从2021年到2023年,下载了89名1型糖尿病(T1D)患者长达18个月的连续血糖监测值。患者人口统计学数据也取自患者记录,包括性别、出生日期和诊断日期。还记录了实验室糖化血红蛋白(HbA1c)检测结果。血糖管理指数(GMI)根据18个月的平均血糖读数,使用公式GMI(%)=(0.82 - (平均血糖/100))计算得出。然后进行调整,得出GMI(mmol/mol)= 10.929×(GMI(%) - 2.15)。平均血糖波动(AGF)通过将18个月内所有记录结果之间的总绝对变化值相加,再除以结果数量减1来计算。高于临界阈值的百分比(ACT)通过对每个结果值的出现总数求和来计算。然后应用累积95%限值来确定总体中仅5%的结果超过的血糖值。利用该值,我们估计了高于临界阈值(ACT)的总检测的百分比。
参与者的平均年龄为42.6岁,T1D的平均病程为18.4年。共分析了322万个读数,得出平均血糖水平为10.3 mmol/l,GMI为57.2 mmol/mol。GMI与测得的HbA1c之间存在强相关性(r = 0.82)。然而,有患者在GMI为60 mmol/mol或更低时,高于临界阈值(ACT)为4% - 10%。将一天中各时间点的百分比平均值(%AVTD)应用于全天每个15分钟间隔的所有血糖读数,并在18个月内进行平均。GMI的%AVTD(总体平均值57.2 mmol/mol)在中午过后升高,18:00下降,22:00达到峰值。AGF的%AVTD(总体平均值0.60 mmol/l)在09:00后显示出更高的变化率,在一天结束时下降。ACT的%AVTD在22:00达到峰值,ACT最高的那些人在15:00还出现一个额外峰值。
我们在此表明,血糖结果高于18 mmol/l(分布的前5%)的百分比在HbA1c高于54 mmol/mol时呈指数增长。引入%AVTD作为一种有用的测量方法。我们的数据表明,在24小时期间,代谢控制的改善可以集中在下午和晚上,此时GMI水平高于平均水平,血糖变化程度高于平均水平,且高于临界阈值的风险高于平均水平。总之,基于血糖变化幅度相对于总体均值的血糖变异性测量方法可用于提供有关24小时期间血糖变化的有价值的临床见解。