Lee Hannah, Otero-Leon Daniel, Dong Huiru, Stringfellow Erin J, Jalali Mohammad S
MGH Institute for Technology Assessment, Harvard Medical School, Boston, MA, USA.
Sloan School of Management, Massachusetts Institute of Technology, Cambridge, MA, USA.
Public Health Rep. 2024 Dec 24:333549241299613. doi: 10.1177/00333549241299613.
Yearly rolling aggregate trends or rates are commonly used to analyze trends in overdose deaths, but focusing on long-term trends can obscure short-term fluctuations (eg, daily spikes). We analyzed data on spikes in daily fatal overdoses and how various spike detection thresholds influence the identification of spikes.
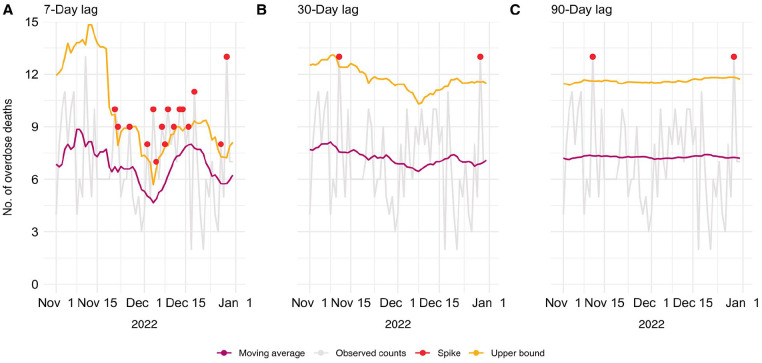
We used a spike detection algorithm to identify spikes among 16 660 drug-related overdose deaths (from any drug) reported in Massachusetts' vital statistics from 2017 through 2023. We adjusted the parameters of the algorithm to define spikes in 3 distinct scenarios: deaths exceeding 2 adjusted moving SDs above the 7-, 30-, and 90-day adjusted moving average.
Our results confirmed the on-the-ground observation that there are days when many more people die of overdoses than would be expected based on fluctuations due to differences among people alone. We identified spikes on 5.8% to 20.6% of the days across the 3 scenarios, annually, constituting 11.1% to 31.6% of all overdose deaths. The absolute difference in percentage points of days identified as spikes varied from 5.2 to 11.5 between 7- and 30-day lags and from 0 to 4.6 between 30- and 90-day lags across years. When compared with the adjusted moving average across the 3 scenarios, in 2017 an average of 3.9 to 5.5 additional deaths occurred on spike days, while in 2023 the range was 3.7 to 6.0.
A substantial percentage of deaths occurred annually on spike days, highlighting the need for effectively monitoring short-term overdose trends. Moreover, our study serves as a foundational analysis for future research into exogenous events that may contribute to spikes in overdose deaths, aiming to prevent future deaths.
年度滚动汇总趋势或比率通常用于分析过量用药死亡趋势,但关注长期趋势可能会掩盖短期波动(如每日峰值)。我们分析了每日致命过量用药峰值的数据,以及各种峰值检测阈值如何影响峰值的识别。
我们使用一种峰值检测算法,在2017年至2023年马萨诸塞州生命统计报告的16660例与药物相关的过量用药死亡(来自任何药物)中识别峰值。我们调整了算法参数,以在3种不同情况下定义峰值:死亡人数超过7天、30天和90天调整移动平均值之上2个调整移动标准差。
我们的结果证实了实地观察结果,即存在这样的日子,死于过量用药的人数比仅因个体差异导致的波动所预期的要多得多。我们在3种情况下每年分别有5.8%至20.6%的日子识别出峰值,占所有过量用药死亡人数的11.1%至31.6%。各年份中,被识别为峰值的天数百分比的绝对差值在7天和30天滞后之间为5.2至11.5个百分点,在30天和90天滞后之间为0至4.6个百分点。与3种情况下的调整移动平均值相比,2017年峰值日平均额外死亡3.9至5.5人,而2023年这一范围为3.7至6.