• 文献检索
  • 文档翻译
  • 深度研究
  • 学术资讯
  • Suppr Zotero 插件Zotero 插件
  • 邀请有礼
  • 套餐&价格
  • 历史记录
应用&插件
Suppr Zotero 插件Zotero 插件浏览器插件Mac 客户端Windows 客户端微信小程序
定价
高级版会员购买积分包购买API积分包
服务
文献检索文档翻译深度研究API 文档MCP 服务
关于我们
关于 Suppr公司介绍联系我们用户协议隐私条款
关注我们

Suppr 超能文献

核心技术专利:CN118964589B侵权必究
粤ICP备2023148730 号-1Suppr @ 2026

文献检索

告别复杂PubMed语法,用中文像聊天一样搜索,搜遍4000万医学文献。AI智能推荐,让科研检索更轻松。

立即免费搜索

文件翻译

保留排版,准确专业,支持PDF/Word/PPT等文件格式,支持 12+语言互译。

免费翻译文档

深度研究

AI帮你快速写综述,25分钟生成高质量综述,智能提取关键信息,辅助科研写作。

立即免费体验

城市地表温度的时空变化及影响因素的相关性研究

Temporal and spatial variations of urban surface temperature and correlation study of influencing factors.

作者信息

Ding Lei, Xiao Xiao, Wang Haitao

机构信息

Tianjin Chengjian University, Tianjin, China.

出版信息

Sci Rep. 2025 Jan 6;15(1):914. doi: 10.1038/s41598-025-85146-4.

DOI:10.1038/s41598-025-85146-4
PMID:39762347
原文链接:https://pmc.ncbi.nlm.nih.gov/articles/PMC11704134/
Abstract

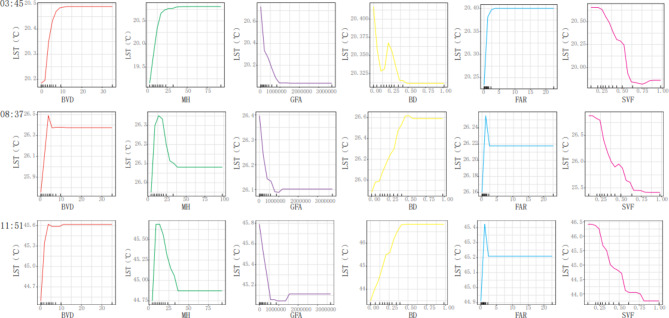
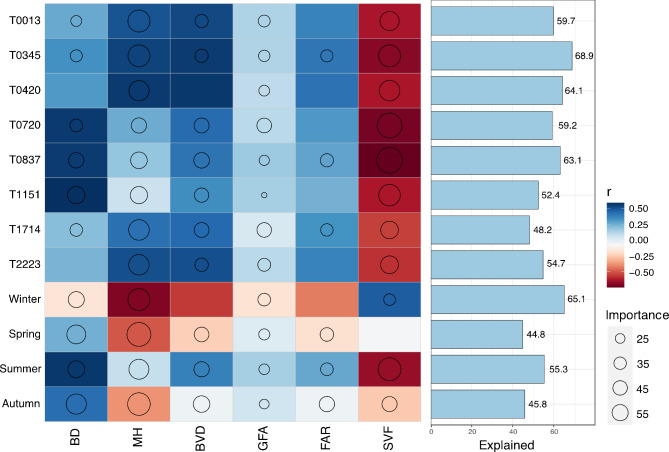
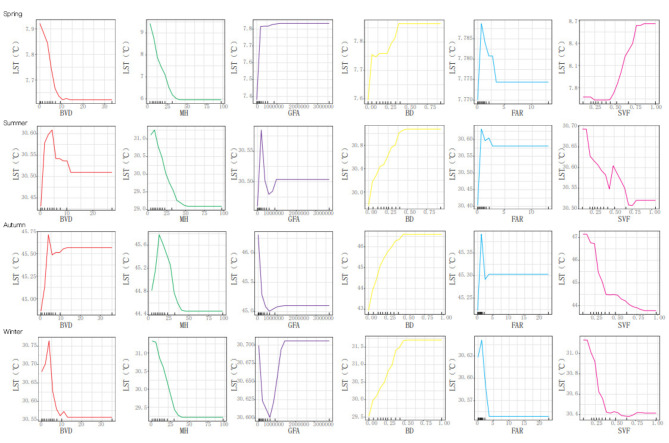
Urban overheating significantly affects thermal comfort and livability, making it essential to understand the relationship between urban form and land surface temperature (LST). While the horizontal dimensions of urban form have been widely studied, the vertical structures and their impact on LST remain underexplored. This study investigates the influence of three-dimensional urban form characteristics on LST, using ECOSTRESS sensor data and four machine learning models. Six urban morphology variables-building density (BD), mean building height (MH), building volume (BVD), gross floor area (GFA), floor area ratio (FAR), and sky view factor (SVF)-are analyzed across different seasons and times of day. The results reveal that MH, BD, and FAR are season-stable factors, with higher MH correlated with lower LST ((e.g., an observed reduction of approximately 3 °C in spring), while higher BD is associated with higher LST (e.g., an increase of about 3.5 °C in autumn). In contrast, BVD, GFA, and SVF are season-varying factors with variable impacts depending on the time of year. Higher BVD is generally associated with elevated LST, while GFA and SVF are linked to lower LST. These associations reflect absolute changes in LST, measured directly from ECOSTRESS data. These findings offer valuable insights into the complex interactions between urban morphology and LST, helping to inform strategies for urban heat mitigation and sustainable planning.

摘要

城市热岛效应显著影响热舒适度和宜居性,因此了解城市形态与地表温度(LST)之间的关系至关重要。虽然城市形态的水平维度已得到广泛研究,但垂直结构及其对地表温度的影响仍未得到充分探索。本研究利用ECOSTRESS传感器数据和四种机器学习模型,调查三维城市形态特征对地表温度的影响。分析了六个城市形态变量——建筑密度(BD)、平均建筑高度(MH)、建筑体积(BVD)、总建筑面积(GFA)、容积率(FAR)和天空开阔度因子(SVF)——在不同季节和一天中的不同时间的情况。结果表明,平均建筑高度、建筑密度和容积率是季节稳定因素,平均建筑高度越高,地表温度越低(例如,春季观测到约3°C的降幅),而建筑密度越高,地表温度越高(例如,秋季升高约3.5°C)。相比之下,建筑体积、总建筑面积和天空开阔度因子是随季节变化的因素,其影响因年份不同而变化。建筑体积越大,通常与地表温度升高相关,而总建筑面积和天空开阔度因子则与较低的地表温度相关。这些关联反映了直接从ECOSTRESS数据测量得到的地表温度的绝对变化。这些发现为城市形态与地表温度之间的复杂相互作用提供了有价值的见解,有助于为城市热缓解和可持续规划策略提供信息。

https://cdn.ncbi.nlm.nih.gov/pmc/blobs/ed8b/11704134/d8f00b644d71/41598_2025_85146_Fig7_HTML.jpg
https://cdn.ncbi.nlm.nih.gov/pmc/blobs/ed8b/11704134/874b6c509848/41598_2025_85146_Fig1_HTML.jpg
https://cdn.ncbi.nlm.nih.gov/pmc/blobs/ed8b/11704134/f5bed98a4741/41598_2025_85146_Fig2_HTML.jpg
https://cdn.ncbi.nlm.nih.gov/pmc/blobs/ed8b/11704134/f2a05b3b0fd9/41598_2025_85146_Fig3_HTML.jpg
https://cdn.ncbi.nlm.nih.gov/pmc/blobs/ed8b/11704134/569025166226/41598_2025_85146_Fig4_HTML.jpg
https://cdn.ncbi.nlm.nih.gov/pmc/blobs/ed8b/11704134/bcd2da65c7a7/41598_2025_85146_Fig5_HTML.jpg
https://cdn.ncbi.nlm.nih.gov/pmc/blobs/ed8b/11704134/0c4780e1716a/41598_2025_85146_Fig6_HTML.jpg
https://cdn.ncbi.nlm.nih.gov/pmc/blobs/ed8b/11704134/d8f00b644d71/41598_2025_85146_Fig7_HTML.jpg

相似文献

1
Temporal and spatial variations of urban surface temperature and correlation study of influencing factors.城市地表温度的时空变化及影响因素的相关性研究
Sci Rep. 2025 Jan 6;15(1):914. doi: 10.1038/s41598-025-85146-4.
2
The Diversified Impacts of Urban Morphology on Land Surface Temperature among Urban Functional Zones.城市形态对城市功能区地表温度的多方面影响。
Int J Environ Res Public Health. 2020 Dec 21;17(24):9578. doi: 10.3390/ijerph17249578.
3
Analyzing the scale dependent effect of urban building morphology on land surface temperature using random forest algorithm.利用随机森林算法分析城市建筑形态对地表温度的尺度依赖效应。
Sci Rep. 2023 Nov 7;13(1):19312. doi: 10.1038/s41598-023-46437-w.
4
Combining GOES-R and ECOSTRESS land surface temperature data to investigate diurnal variations of surface urban heat island.结合GOES-R和ECOSTRESS地表温度数据研究地表城市热岛的日变化。
Sci Total Environ. 2022 Jun 1;823:153652. doi: 10.1016/j.scitotenv.2022.153652. Epub 2022 Feb 4.
5
How does 2D and 3D of urban morphology affect the seasonal land surface temperature in Island City? A block-scale perspective.城市形态的二维和三维如何影响岛屿城市的季节性地表温度?基于街区尺度的视角。
Ecol Indic. 2023 Jun;150:110221. doi: 10.1016/j.ecolind.2023.110221.
6
Modeling the impact of 2D/3D urban indicators on the urban heat island over different seasons: A boosted regression tree approach.基于增强回归树模型探究不同季节二维/三维城市指标对城市热岛的影响。
J Environ Manage. 2020 Jul 15;266:110424. doi: 10.1016/j.jenvman.2020.110424. Epub 2020 Apr 29.
7
Exploring seasonal diurnal surface temperature variation in cities based on ECOSTRESS data: A local climate zone perspective.基于 ECOSTRESS 数据探究城市季节性日变化表面温度:局部气候区视角。
Front Public Health. 2022 Sep 6;10:1001344. doi: 10.3389/fpubh.2022.1001344. eCollection 2022.
8
Exploring the relationship between seasonal variations of land surface temperature and urban morphological factors in complex urban areas.探索复杂城市地区地表温度季节变化与城市形态因素之间的关系。
Environ Sci Pollut Res Int. 2023 May;30(21):59861-59876. doi: 10.1007/s11356-023-26781-0. Epub 2023 Apr 4.
9
Complexity of the relationship between 2D/3D urban morphology and the land surface temperature: a multiscale perspective.二维/三维城市形态与地表温度之间关系的复杂性:多尺度视角。
Environ Sci Pollut Res Int. 2021 Dec;28(47):66804-66818. doi: 10.1007/s11356-021-15177-7. Epub 2021 Jul 8.
10
Analyzing the effect of view factors on surface heat flux, surface temperature, and vegetation cover.分析视角系数对表面热通量、表面温度和植被覆盖的影响。
Environ Sci Pollut Res Int. 2023 Mar;30(15):43843-43859. doi: 10.1007/s11356-023-25261-9. Epub 2023 Jan 21.

引用本文的文献

1
Exploring the influence of urban green space and urban morphology on urban heat Islands using street view and satellite imagery.利用街景和卫星图像探索城市绿地和城市形态对城市热岛的影响。
Sci Rep. 2025 Jul 3;15(1):23759. doi: 10.1038/s41598-025-07904-8.

本文引用的文献

1
Can improving the spatial equity of urban green space mitigate the effect of urban heat islands? An empirical study.改善城市绿地的空间公平性能否缓解城市热岛效应?一项实证研究。
Sci Total Environ. 2022 Oct 1;841:156687. doi: 10.1016/j.scitotenv.2022.156687. Epub 2022 Jun 15.
2
Effects of different types of heat wave days on ozone pollution over Beijing-Tianjin-Hebei and its future projection.不同类型热浪日对京津冀臭氧污染的影响及其未来预测。
Sci Total Environ. 2022 Sep 1;837:155762. doi: 10.1016/j.scitotenv.2022.155762. Epub 2022 May 6.
3
Fine-scale modeling of the urban heat island: A comparison of multiple linear regression and random forest approaches.
城市热岛的精细模拟:多元线性回归和随机森林方法的比较。
Sci Total Environ. 2022 Apr 1;815:152836. doi: 10.1016/j.scitotenv.2021.152836. Epub 2022 Jan 4.
4
Complexity of the relationship between 2D/3D urban morphology and the land surface temperature: a multiscale perspective.二维/三维城市形态与地表温度之间关系的复杂性:多尺度视角。
Environ Sci Pollut Res Int. 2021 Dec;28(47):66804-66818. doi: 10.1007/s11356-021-15177-7. Epub 2021 Jul 8.
5
Modeling the impact of 2D/3D urban indicators on the urban heat island over different seasons: A boosted regression tree approach.基于增强回归树模型探究不同季节二维/三维城市指标对城市热岛的影响。
J Environ Manage. 2020 Jul 15;266:110424. doi: 10.1016/j.jenvman.2020.110424. Epub 2020 Apr 29.
6
Multicollinearity and misleading statistical results.多重共线性和误导性的统计结果。
Korean J Anesthesiol. 2019 Dec;72(6):558-569. doi: 10.4097/kja.19087. Epub 2019 Jul 15.
7
Remote sensing of the urban heat island effect in a highly populated urban agglomeration area in East China.华东人口密集城市群城市热岛效应的遥感研究。
Sci Total Environ. 2018 Jul 1;628-629:415-429. doi: 10.1016/j.scitotenv.2018.02.074. Epub 2018 Feb 13.
8
Utilising green and bluespace to mitigate urban heat island intensity.利用绿色和蓝色空间缓解城市热岛强度。
Sci Total Environ. 2017 Apr 15;584-585:1040-1055. doi: 10.1016/j.scitotenv.2017.01.158. Epub 2017 Feb 1.
9
Heat waves in the United States: mortality risk during heat waves and effect modification by heat wave characteristics in 43 U.S. communities.美国的热浪:43 个美国社区热浪期间的死亡风险和热浪特征的影响修饰
Environ Health Perspect. 2011 Feb;119(2):210-8. doi: 10.1289/ehp.1002313. Epub 2010 Oct 7.
10
Global optimization with multivariate adaptive regression splines.
IEEE Trans Syst Man Cybern B Cybern. 2007 Apr;37(2):333-40. doi: 10.1109/tsmcb.2006.883430.