Chanda Stephen Longa, Imamura Tadatsugu, Malambo Warren, Bain Rommel, Musuka Chisenga, Sinyange Nyambe, Hines Jonas Z
Zambia Field Epidemiology Training Program, Lusaka, Zambia.
Zambia National Public Health Institute, Lusaka, Zambia.
BMC Public Health. 2025 Jan 10;25(1):123. doi: 10.1186/s12889-025-21347-w.
Geographical factors can affect infectious disease transmission, including SARS-CoV-2, a virus that is spread through respiratory secretions. Prioritization of surveillance and response activities during a pandemic can be informed by a pathogen's geographical transmission patterns. We assessed the relationship between geographical factors and SARS-CoV-2 prevalence in Zambia.
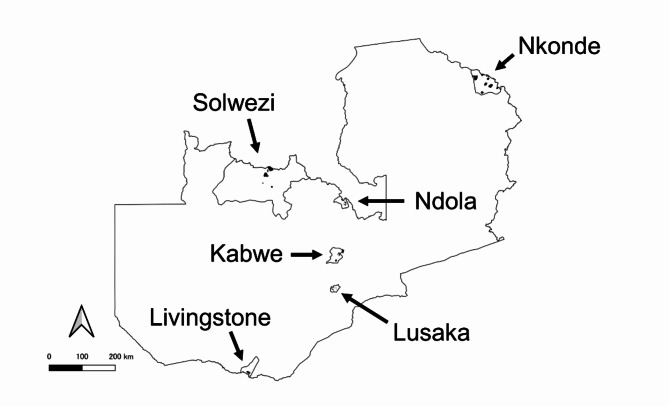
We did a cross-sectional study of SARS-CoV-2 prevalence in six districts in July 2020, which was during the upslope of the first wave in Zambia. In each district, 16 Standard Enumeration Areas (SEAs) were randomly selected and 20 households from each SEA were sampled. The SEA PCR prevalence was calculated as the number of persons testing PCR positive for SARS-CoV-2 in the SEA times the individual sampling weight for the SEA divided by the SEA population. We analysed SEA geographical data for population density, socioeconomic status (SES) (with lower scores indicating reduced vulnerability), literacy, access to water, and sanitation, and hygiene (WASH) factors. Gaussian conditional autoregressive (CAR) models and Generalised estimating equations (GEE) were used to measure adjusted prevalence Ratios (aPRs) and 95% confidence intervals (CIs) for SARS-CoV-2 prevalence with geographical factors, after adjusting for clustering by district, in R.
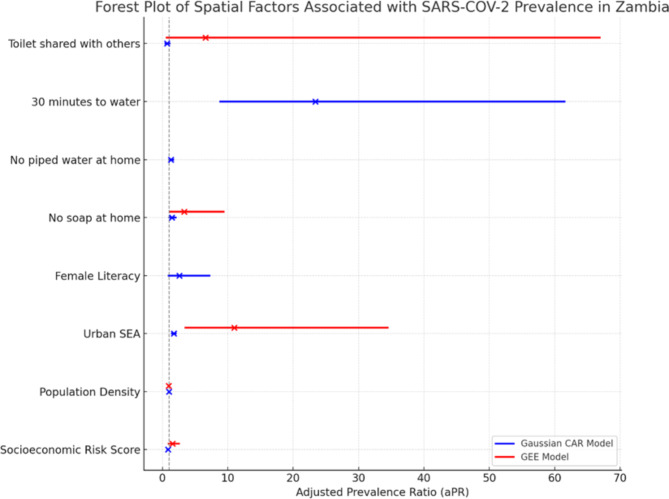
Overall, the median SARS-CoV-2 prevalence in the 96 SEAs was 41.7 (Interquartile range (IQR), 0.0-96.2) infections per 1000 persons. In the multivariable CAR analysis, increasing SES vulnerability was associated with lower SARS-CoV-2 prevalence (aPR) = 0.85, 95% CI: 0.78-0.94). Conversely, urban SEAs and poor access to WASH were associated with a higher SARS-CoV-2 prevalence (aPR = 1.73, 95% CI: 1.46-2.03, No soap: aPR = 1.47, 95% CI: 1.05-2.05, households without piped water: aPR = 1.32, 95% CI: 1.05-1.65, 30 min to fetch water: aPR = 23.39, 95% CI: 8.89-61.52). Findings were similar in the multivariable GEE analysis.
SARS-CoV-2 prevalence was higher in wealthier, urban EAs, with poor access to WASH. As this study was conducted early in the first wave could have impacted our findings. Additional analyses from subsequent waves could confirm if these findings persist. During the beginning of a COVID-19 wave in Zambia, surveillance and response activities should be focused on urban population centres and improving access to WASH.
地理因素会影响传染病传播,包括通过呼吸道分泌物传播的严重急性呼吸综合征冠状病毒2(SARS-CoV-2)。大流行期间监测和应对活动的优先级可依据病原体的地理传播模式来确定。我们评估了赞比亚地理因素与SARS-CoV-2流行率之间的关系。
我们于2020年7月在赞比亚六个地区开展了一项关于SARS-CoV-2流行率的横断面研究,当时正值赞比亚第一波疫情上升期。在每个地区,随机选取16个标准普查区(SEA),并从每个SEA中抽取20户家庭。SEA聚合酶链反应(PCR)流行率的计算方法为:SEA中SARS-CoV-2 PCR检测呈阳性的人数乘以SEA的个体抽样权重,再除以SEA人口数。我们分析了SEA的地理数据,包括人口密度、社会经济地位(SES)(得分越低表明脆弱性越低)、识字率、用水情况、卫生设施以及卫生(WASH)因素。在R软件中,使用高斯条件自回归(CAR)模型和广义估计方程(GEE),在对地区聚类进行校正后,测量地理因素与SARS-CoV-2流行率的校正流行率比值(aPR)及95%置信区间(CI)。
总体而言,96个SEA中SARS-CoV-2流行率的中位数为每1000人41.7例(四分位间距(IQR),0.0 - 96.2)。在多变量CAR分析中,SES脆弱性增加与较低的SARS-CoV-2流行率相关(aPR = 0.85,95% CI:0.78 - 0.94)。相反,城市SEA以及WASH条件差与较高的SARS-CoV-2流行率相关(aPR = 1.73,95% CI:1.46 - 2.03,无肥皂:aPR = 1.47,95% CI:1.05 - 2.05,无自来水家庭:aPR = 1.32,95% CI:1.05 - 1.65,取水需30分钟:aPR = 23.39,95% CI:8.89 - 61.52)。多变量GEE分析的结果相似。
在富裕的城市地区,SARS-CoV-2流行率较高,且WASH条件较差。由于本研究是在第一波疫情早期进行的,可能影响了我们的研究结果。后续疫情波次的进一步分析可以确认这些结果是否持续存在。在赞比亚COVID-19疫情波次开始时,监测和应对活动应集中于城市人口中心,并改善WASH条件。