Ruden Douglas M
C. S. Mott Center for Human Growth and Development, Institute for Environmental Health Sciences, Department of Obstetrics and Gynecology, Wayne State University, Detroit, MI 48201, USA.
Genes (Basel). 2025 Apr 5;16(4):432. doi: 10.3390/genes16040432.
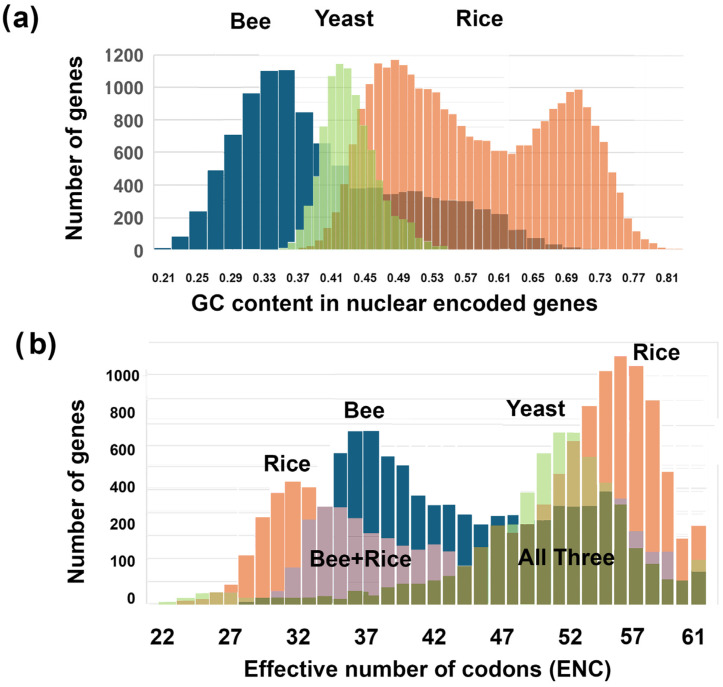
BACKGROUND/OBJECTIVES: Codon usage bias affects gene expression and translation efficiency across species. The effective number of codons (ENC) and GC content influence codon preference, often displaying unimodal or bimodal distributions. This study investigates the correlation between ENC and GC rankings across species and how their relationship affects codon usage distributions.
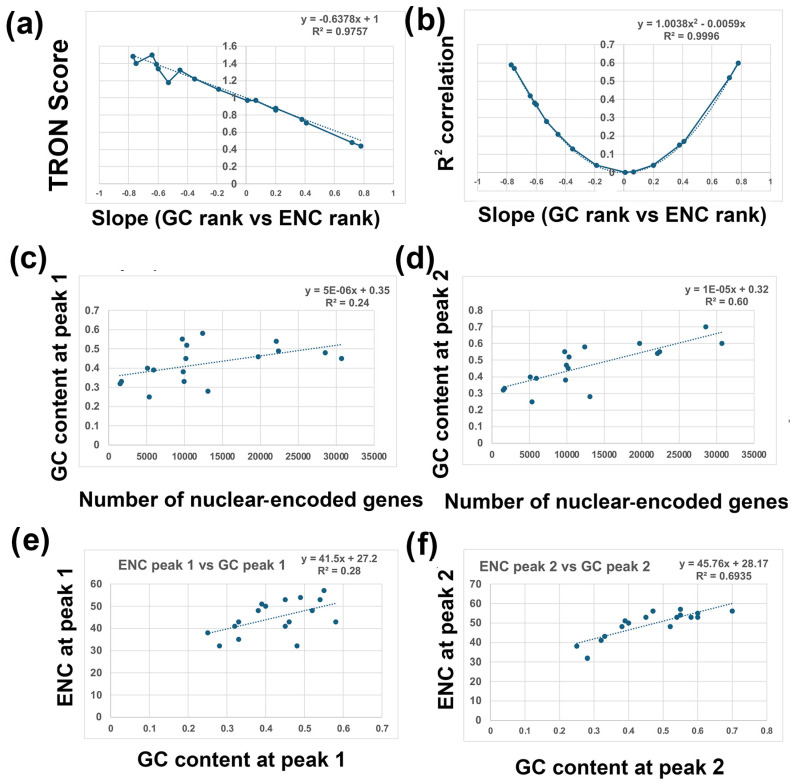
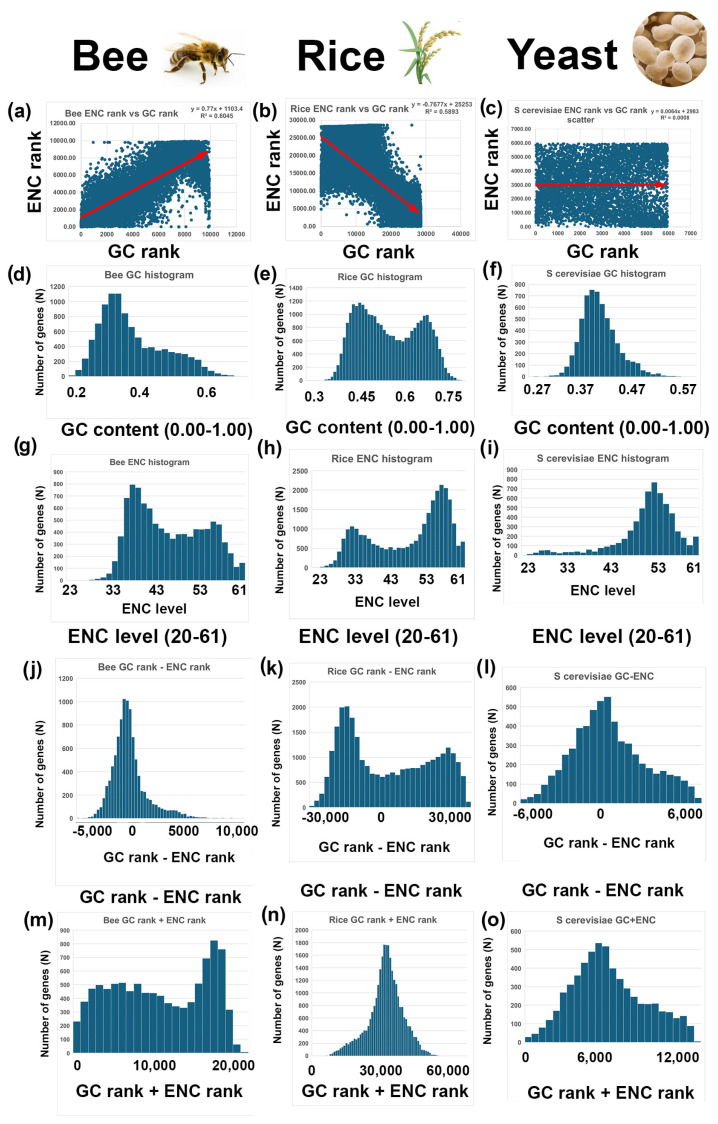
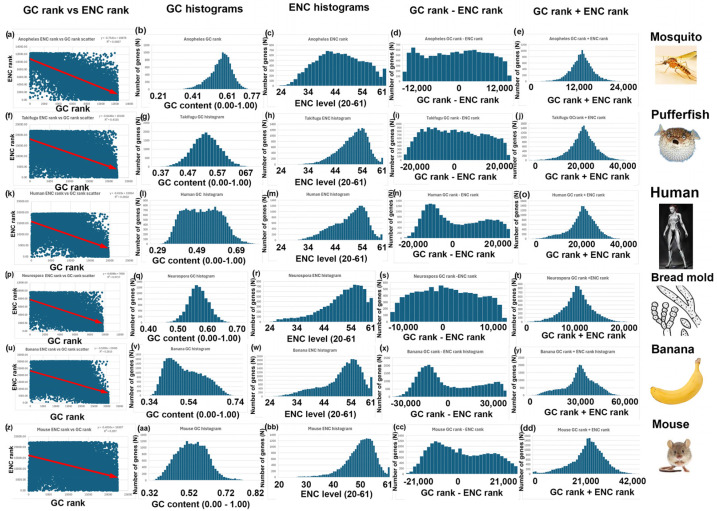
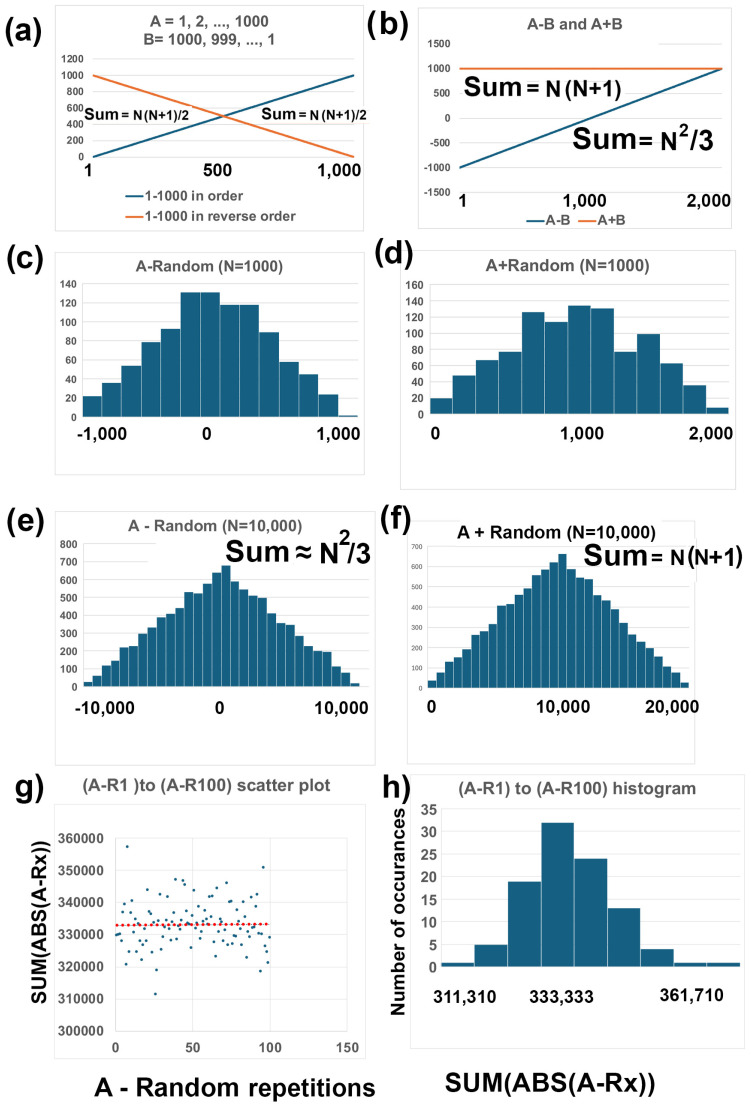
I analyzed nuclear-encoded genes from 17 species representing six kingdoms: one bacteria (), three fungi (, , and ), one archaea (), three protists (, , and ),), three plants (, , and ), and six animals (, , , , , and ). Genes in all 17 species were ranked by GC content and ENC, and correlations were assessed. I examined how adding or subtracting these rankings influenced their overall distribution in a new method that I call Two-Rank Order Normalization or TRON. The equation, TRON = SUM(ABS((GC rank:GC rank) - (ENC rank:ENC rank))/(N/3), where (GC rank:GC rank) is a rank-order series of GC rank, (ENC rank:ENC rank) is a rank-order series ENC rank, sorted by the rank-order series GC rank. The denominator of TRON, N/3, is the normalization factor because it is the expected value of the sum of the absolute value of GC rank-ENC rank for all genes if GC rank and ENC rank are not correlated.
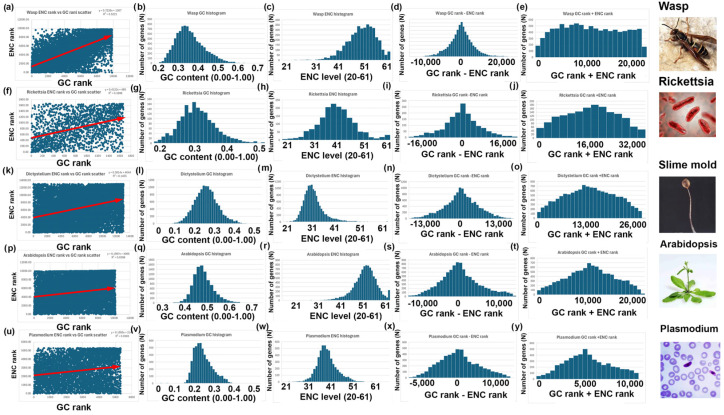
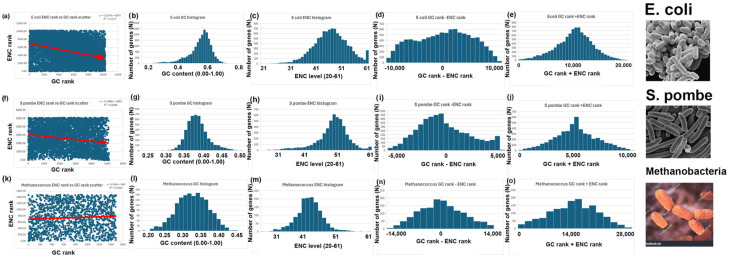
ENC and GC rankings are positively correlated (i.e., ENC increases as GC increases) in AT-rich species such as honeybees (R = 0.60, slope = 0.78) and wasps (R = 0.52, slope = 0.72) and negatively correlated (i.e., ENC decreases as GC increases) in GC-rich species such as humans (R = 0.38, slope = -0.61) and rice (R = 0.59, slope = -0.77). Second, the GC rank-ENC rank distributions change from unimodal to bimodal as GC content increases in the 17 species. Third, the GC rank+ENC rank distributions change from bimodal to unimodal as GC content increases in the 17 species. Fourth, the slopes of the correlations (GC versus ENC) in all 17 species are negatively correlated with TRON (R = 0.98) (see Graphic Abstract).
The correlation between ENC rank and GC rank differs among species, shaping codon usage distributions in opposite ways depending on whether a species' nuclear-encoded genes are AT-rich or GC-rich. Understanding these patterns might provide insights into translation efficiency, epigenetics mediated by CpG DNA methylation, epitranscriptomics of RNA modifications, RNA secondary structures, evolutionary pressures, and potential applications in genetic engineering and biotechnology.
背景/目的:密码子使用偏好影响着跨物种的基因表达和翻译效率。有效密码子数(ENC)和GC含量会影响密码子偏好,通常呈现单峰或双峰分布。本研究调查了跨物种的ENC和GC排名之间的相关性,以及它们之间的关系如何影响密码子使用分布。
我分析了代表六个界的17个物种的核编码基因:一种细菌(),三种真菌(,,和),一种古菌(),三种原生生物(,,和),三种植物(,,和),以及六种动物(,,,,,和)。对所有17个物种的基因按GC含量和ENC进行排名,并评估相关性。我研究了通过一种我称为双排名顺序归一化(TRON)的新方法增加或减去这些排名如何影响它们的总体分布。公式为TRON = SUM(ABS((GC排名:GC排名) - (ENC排名:ENC排名))/(N/3),其中(GC排名:GC排名)是GC排名的排序系列,(ENC排名:ENC排名)是ENC排名的排序系列,按GC排名的排序系列排序。TRON的分母N/3是归一化因子,因为如果GC排名和ENC排名不相关,它是所有基因的GC排名-ENC排名绝对值之和的期望值。
在富含AT的物种如蜜蜂(R = 0.60,斜率 = 0.78)和黄蜂(R = 0.52,斜率 = 0.72)中,ENC和GC排名呈正相关(即ENC随GC增加而增加),而在富含GC的物种如人类(R = 0.38,斜率 = -0.61)和水稻(R = 0.59,斜率 = -0.77)中呈负相关(即ENC随GC增加而减少)。其次,在这17个物种中,随着GC含量的增加,GC排名 - ENC排名分布从单峰变为双峰。第三,在这17个物种中,随着GC含量的增加,GC排名 + ENC排名分布从双峰变为单峰。第四,所有17个物种中相关性的斜率(GC与ENC)与TRON呈负相关(R = 0.98)(见图摘要)。
ENC排名与GC排名之间的相关性在不同物种中有所不同,根据一个物种的核编码基因是富含AT还是富含GC,以相反的方式塑造密码子使用分布。了解这些模式可能有助于深入了解翻译效率、由CpG DNA甲基化介导的表观遗传学、RNA修饰的表转录组学、RNA二级结构、进化压力以及在基因工程和生物技术中的潜在应用。