• 文献检索
  • 文档翻译
  • 深度研究
  • 学术资讯
  • Suppr Zotero 插件Zotero 插件
  • 邀请有礼
  • 套餐&价格
  • 历史记录
应用&插件
Suppr Zotero 插件Zotero 插件浏览器插件Mac 客户端Windows 客户端微信小程序
定价
高级版会员购买积分包购买API积分包
服务
文献检索文档翻译深度研究API 文档MCP 服务
关于我们
关于 Suppr公司介绍联系我们用户协议隐私条款
关注我们

Suppr 超能文献

核心技术专利:CN118964589B侵权必究
粤ICP备2023148730 号-1Suppr @ 2026

文献检索

告别复杂PubMed语法,用中文像聊天一样搜索,搜遍4000万医学文献。AI智能推荐,让科研检索更轻松。

立即免费搜索

文件翻译

保留排版,准确专业,支持PDF/Word/PPT等文件格式,支持 12+语言互译。

免费翻译文档

深度研究

AI帮你快速写综述,25分钟生成高质量综述,智能提取关键信息,辅助科研写作。

立即免费体验

美国各州药品支出的复杂性。

The complexity of pharmaceutical expenditures across U.S. states.

作者信息

Cross Lisa, Famà Angelo, Pagnottoni Paolo, Pecora Nicolò, Spelta Alessandro

机构信息

Department of Economics and Management, University of Pavia, Pavia, 27100, Italy.

Department of Economics, University of Insubria, Varese, 21100, Italy.

出版信息

Sci Rep. 2025 May 20;15(1):17541. doi: 10.1038/s41598-025-01885-4.

DOI:10.1038/s41598-025-01885-4
PMID:40394119
原文链接:https://pmc.ncbi.nlm.nih.gov/articles/PMC12092636/
Abstract

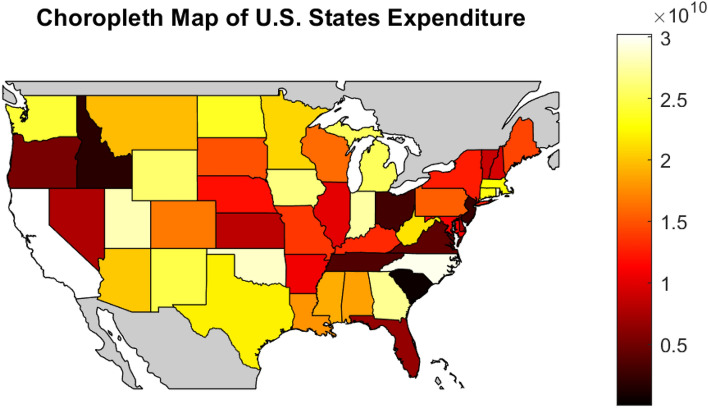
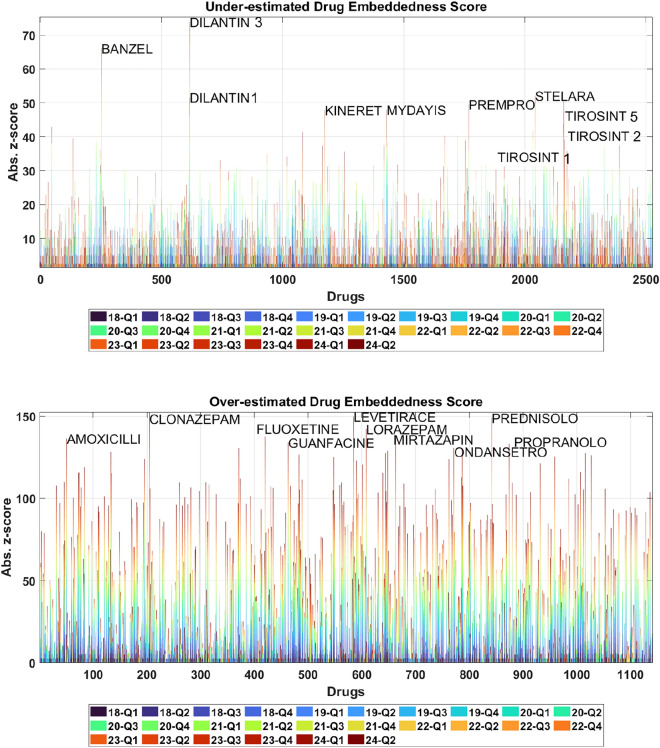
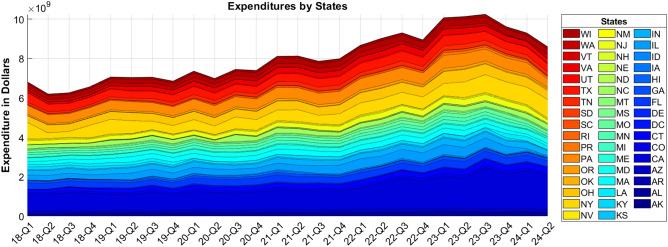
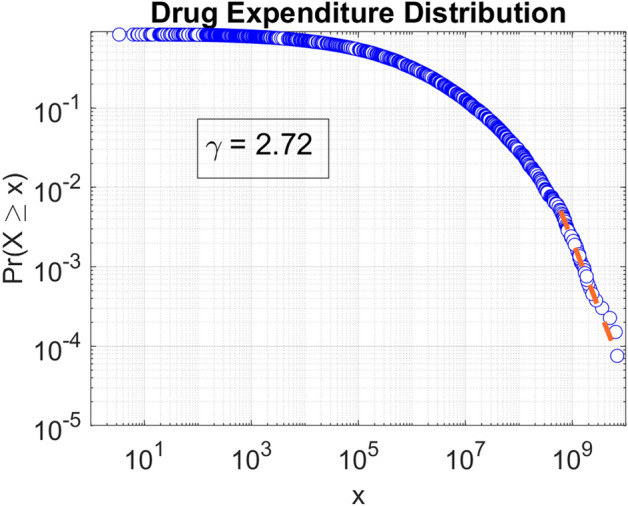
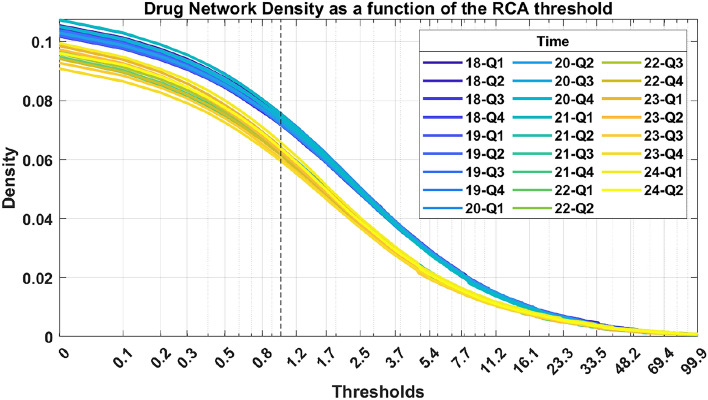
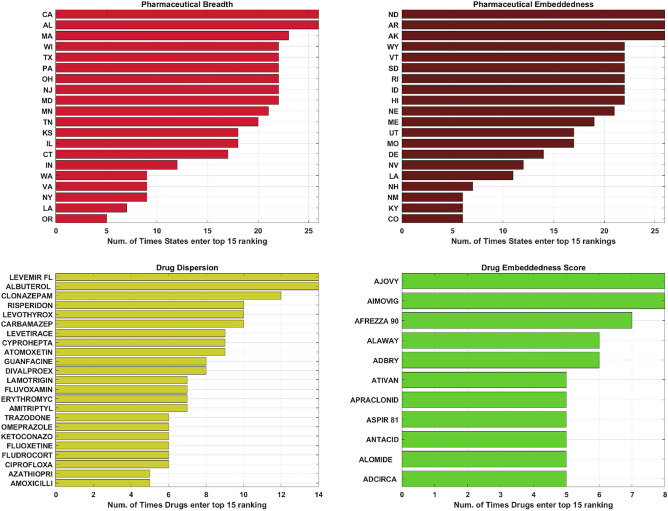
Understanding the complexity of pharmaceutical expenditures across U.S. states is critical for designing efficient healthcare policies and ensuring equitable drug access. This study applies network-based economic complexity methods to analyze state-level Medicaid drug spending, leveraging Medicaid State Drug Utilization Data (SDUD) from 2018 to 2024. Using Revealed Comparative Advantage (RCA) and the Method of Reflections, we quantify the sophistication of pharmaceutical consumption and identify structural inefficiencies in drug reimbursement policies. Our findings reveal substantial heterogeneity in pharmaceutical complexity across states, with highly diversified markets in states like California and Texas, while others, such as Wyoming and West Virginia, exhibit lower complexity due to restrictive formulary policies and healthcare infrastructure limitations. A 15% decline in network density over the study period suggests consolidation in reimbursement practices, influenced by regulatory interventions and cost-containment strategies. Additionally, Medicaid expansion states show a 20% increase in prescription utilization, particularly for antiviral and mental health medications. Null model comparisons highlight systematic deviations from expected expenditure patterns, with states like Arkansas and Nebraska showing lower-than-expected pharmaceutical embeddedness, whereas Massachusetts and California appear more integrated than network models predict. These findings suggest that state-specific policies, provider behavior, and market dynamics significantly shape pharmaceutical expenditures beyond structural network constraints, as well as they offer significant implications for policymakers and healthcare providers seeking to balance cost efficiency with equitable medication distribution.

摘要

了解美国各州药品支出的复杂性对于制定高效的医疗政策和确保公平的药品可及性至关重要。本研究应用基于网络的经济复杂性方法,利用2018年至2024年的医疗补助州药品利用数据(SDUD)来分析州一级的医疗补助药品支出。通过显示性比较优势(RCA)和反射法,我们量化了药品消费的复杂性,并识别了药品报销政策中的结构低效问题。我们的研究结果显示,各州在药品复杂性方面存在显著差异,加利福尼亚州和得克萨斯州等州的市场高度多元化,而怀俄明州和西弗吉尼亚州等其他州由于处方集政策限制和医疗基础设施限制,药品复杂性较低。在研究期间,网络密度下降了15%,这表明在监管干预和成本控制策略的影响下,报销做法出现了整合。此外,医疗补助扩大州的处方利用率提高了20%,特别是抗病毒和精神类药物。零模型比较突出了与预期支出模式的系统性偏差,阿肯色州和内布拉斯加州等州的药品嵌入性低于预期,而马萨诸塞州和加利福尼亚州的整合程度似乎高于网络模型的预测。这些研究结果表明,除了结构性网络限制之外,各州特定的政策、提供者行为和市场动态显著影响着药品支出,同时也为寻求在成本效率与公平药物分配之间取得平衡的政策制定者和医疗服务提供者提供了重要启示。

https://cdn.ncbi.nlm.nih.gov/pmc/blobs/d529/12092636/63329e039a6d/41598_2025_1885_Fig12_HTML.jpg
https://cdn.ncbi.nlm.nih.gov/pmc/blobs/d529/12092636/e0d773f5a88b/41598_2025_1885_Fig1_HTML.jpg
https://cdn.ncbi.nlm.nih.gov/pmc/blobs/d529/12092636/a0273bad8b76/41598_2025_1885_Fig2_HTML.jpg
https://cdn.ncbi.nlm.nih.gov/pmc/blobs/d529/12092636/97d465f0843f/41598_2025_1885_Fig3_HTML.jpg
https://cdn.ncbi.nlm.nih.gov/pmc/blobs/d529/12092636/f1bcc2510467/41598_2025_1885_Fig4_HTML.jpg
https://cdn.ncbi.nlm.nih.gov/pmc/blobs/d529/12092636/1171431fa4d0/41598_2025_1885_Fig5_HTML.jpg
https://cdn.ncbi.nlm.nih.gov/pmc/blobs/d529/12092636/a74105fab65c/41598_2025_1885_Fig6_HTML.jpg
https://cdn.ncbi.nlm.nih.gov/pmc/blobs/d529/12092636/57be417502f8/41598_2025_1885_Fig7_HTML.jpg
https://cdn.ncbi.nlm.nih.gov/pmc/blobs/d529/12092636/ea09c4a4b727/41598_2025_1885_Fig8_HTML.jpg
https://cdn.ncbi.nlm.nih.gov/pmc/blobs/d529/12092636/02d23d8363f5/41598_2025_1885_Fig9_HTML.jpg
https://cdn.ncbi.nlm.nih.gov/pmc/blobs/d529/12092636/8a0ad8e8612c/41598_2025_1885_Fig10_HTML.jpg
https://cdn.ncbi.nlm.nih.gov/pmc/blobs/d529/12092636/1368a9032a49/41598_2025_1885_Fig11_HTML.jpg
https://cdn.ncbi.nlm.nih.gov/pmc/blobs/d529/12092636/63329e039a6d/41598_2025_1885_Fig12_HTML.jpg

相似文献

1
The complexity of pharmaceutical expenditures across U.S. states.美国各州药品支出的复杂性。
Sci Rep. 2025 May 20;15(1):17541. doi: 10.1038/s41598-025-01885-4.
2
Differences in the cost of antidepressants across state Medicaid programs.各州医疗补助计划中抗抑郁药物成本的差异。
J Ment Health Policy Econ. 2008 Mar;11(1):33-47.
3
Drug Expenditure, Price, and Utilization in the U.S. Medicaid: A Trend Analysis for SSRI and SNRI Antidepressants from 1991 to 2018.美国医疗补助计划中的药物支出、价格和利用情况:SSRIs 和 SNRIs 抗抑郁药 1991 年至 2018 年的趋势分析。
J Ment Health Policy Econ. 2021 Mar 1;24(1):3-11.
4
Financing structure dynamics and other determinants of Medicaid pharmaceutical expenditures, 1993-1996.1993 - 1996年医疗补助药品支出的融资结构动态及其他决定因素
J Health Care Finance. 1998 Fall;25(1):59-71.
5
Trends in prescription drug expenditures by Medicaid enrollees.医疗补助计划参保者的处方药支出趋势。
Med Care. 2006 May;44(5 Suppl):I27-35. doi: 10.1097/01.mlr.0000208132.36055.84.
6
An explanatory model for state Medicaid per capita prescription drug expenditures.州医疗补助计划人均处方药支出的解释模型。
Soc Work Public Health. 2012;27(6):537-53. doi: 10.1080/19371910903183086.
7
Forecasting Medicaid Expenditures for Antipsychotic Medications.预测抗精神病药物的医疗补助支出。
Psychiatr Serv. 2015 Jul;66(7):713-8. doi: 10.1176/appi.ps.201400042. Epub 2015 Mar 31.
8
Firm- and drug-specific patterns of generic drug payments by US medicaid programs: 1991-2008.1991 - 2008年美国医疗补助计划中特定公司和药物的仿制药支付模式
Appl Health Econ Health Policy. 2014 Apr;12(2):165-77. doi: 10.1007/s40258-014-0083-z.
9
Pharmaceutical policies: effects of financial incentives for prescribers.药品政策:针对开处方者的经济激励措施的影响。
Cochrane Database Syst Rev. 2015 Aug 4;2015(8):CD006731. doi: 10.1002/14651858.CD006731.pub2.
10
Economic consequences of underuse of generic drugs: evidence from Medicaid and implications for prescription drug benefit plans.使用仿制药不足的经济后果:来自医疗补助计划的证据及对处方药福利计划的启示
Health Serv Res. 2003 Aug;38(4):1051-63. doi: 10.1111/1475-6773.00162.

本文引用的文献

1
The electricity cost burden of durable medical equipment in the United States.美国耐用医疗设备的电费负担。
Sci Rep. 2024 Dec 28;14(1):31152. doi: 10.1038/s41598-024-82464-x.
2
Pharmaceutical Expenditure and Consumption of Recommended Drugs to Avoid in Italy.意大利的药品支出及应避免使用的推荐药物的消费情况。
JAMA Netw Open. 2024 Nov 4;7(11):e2446237. doi: 10.1001/jamanetworkopen.2024.46237.
3
The addition of cannabis to prescription drug monitoring programs and medication fills in Medicaid.将大麻纳入处方药监测计划以及医疗补助计划中的药物配给。
Health Econ. 2025 Feb;34(2):283-296. doi: 10.1002/hec.4911. Epub 2024 Nov 4.
4
Costs of Drug Development and Research and Development Intensity in the US, 2000-2018.2000-2018 年美国药品研发成本和研发强度
JAMA Netw Open. 2024 Jun 3;7(6):e2415445. doi: 10.1001/jamanetworkopen.2024.15445.
5
Changes in Health Care Workers' Economic Outcomes Following Medicaid Expansion.医疗补助扩张后医疗保健工作者经济状况的变化。
JAMA. 2024 Feb 27;331(8):687-695. doi: 10.1001/jama.2023.27014.
6
Geographic Variation in Health Insurance Coverage:United States, 2022.医疗保险覆盖范围的地域差异:美国,2022 年。
Natl Health Stat Report. 2023 Nov(194):1-15.
7
Pharmaceutical policies: effects of regulating drug insurance schemes.药品政策:规范药品保险计划的影响
Cochrane Database Syst Rev. 2022 May 3;5(5):CD011703. doi: 10.1002/14651858.CD011703.pub2.
8
National trends in prescription drug expenditures and projections for 2022.全国处方药支出趋势和 2022 年预测。
Am J Health Syst Pharm. 2022 Jul 8;79(14):1158-1172. doi: 10.1093/ajhp/zxac102.
9
Predicting health-related social needs in Medicaid and Medicare populations using machine learning.利用机器学习预测医疗补助和医疗保险人群的与健康相关的社会需求。
Sci Rep. 2022 Mar 16;12(1):4554. doi: 10.1038/s41598-022-08344-4.
10
Step Therapy's Balancing Act - Protecting Patients while Addressing High Drug Prices.阶梯治疗的平衡之举——在应对高昂药价的同时保护患者。
N Engl J Med. 2022 Mar 10;386(10):901-904. doi: 10.1056/NEJMp2117582. Epub 2022 Mar 5.