Vasilev Yuriy, Pamova Anastasia, Bobrovskaya Tatiana, Vladzimirskyy Anton, Omelyanskaya Olga, Astapenko Elena, Kruchinkin Artem, Vladimir Novik, Arzamasov Kirill
Research and Practical Clinical Center for Diagnostics and Telemedicine Technologies of the Moscow Health Care Department, Moscow, Russia.
National Medical and Surgical Center named after N.I. Pirogov of the Ministry of Health of the Russian Federation, Moscow, Russia.
Front Artif Intell. 2025 Jul 15;8:1607348. doi: 10.3389/frai.2025.1607348. eCollection 2025.
Creating training and testing datasets for machine learning algorithms to measure linear dimensions of organs is a tedious task. There are no universally accepted methods for evaluating outliers or anomalies in such datasets. This can cause errors in machine learning and compromise the quality of end products. The goal of this study is to identify optimal methods for detecting organ anomalies and outliers in medical datasets designed to train and test neural networks in morphometrics.
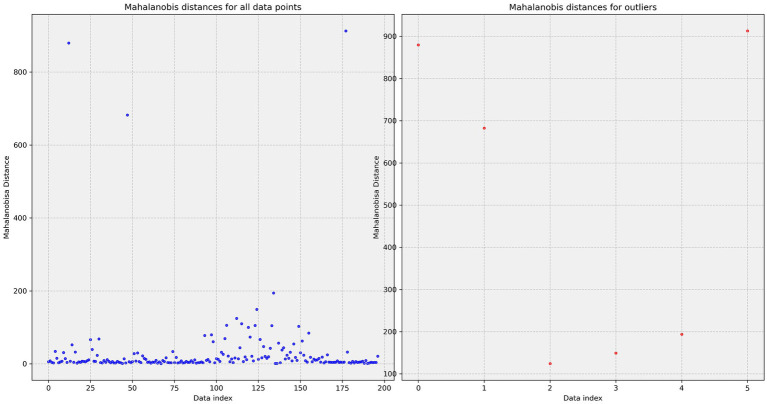
A dataset was created containing linear measurements of the spleen obtained from CT scans. Labelling was performed by three radiologists. The total number of studies included in the sample was = 197 patients. Using visual methods (1.5 interquartile range; heat map; boxplot; histogram; scatter plot), machine learning algorithms (Isolation forest; Density-Based Spatial Clustering of Applications with Noise; K-nearest neighbors algorithm; Local outlier factor; One-class support vector machines; EllipticEnvelope; Autoencoders), and mathematical statistics (z-score, Grubb's test; Rosner's test).
We identified measurement errors, input errors, abnormal size values and non-standard shapes of the organ (sickle-shaped, round, triangular, additional lobules). The most effective methods included visual techniques (including boxplots and histograms) and machine learning algorithms such is OSVM, KNN and autoencoders. A total of 32 outlier anomalies were found.
Curation of complex morphometric datasets must involve thorough mathematical and clinical analyses. Relying solely on mathematical statistics or machine learning methods appears inadequate.
为机器学习算法创建用于测量器官线性尺寸的训练和测试数据集是一项繁琐的任务。目前尚无普遍接受的方法来评估此类数据集中的异常值或异常情况。这可能会导致机器学习中的错误,并影响最终产品的质量。本研究的目的是确定在形态计量学中用于训练和测试神经网络的医学数据集中检测器官异常和异常值的最佳方法。
创建了一个包含从CT扫描获得的脾脏线性测量值的数据集。由三位放射科医生进行标注。样本中纳入的研究总数为197例患者。使用视觉方法(1.5倍四分位数间距;热图;箱线图;直方图;散点图)、机器学习算法(孤立森林;基于密度的空间聚类应用噪声;K近邻算法;局部离群因子;单类支持向量机;椭圆包络;自动编码器)以及数理统计方法(z分数、格拉布斯检验;罗斯纳检验)。
我们识别出测量误差、输入误差、器官大小异常值以及非标准形状(镰刀形、圆形、三角形、额外小叶)。最有效的方法包括视觉技术(包括箱线图和直方图)以及机器学习算法,如单类支持向量机、K近邻算法和自动编码器。共发现32个异常值异常情况。
复杂形态计量数据集的管理必须涉及全面的数学和临床分析。仅依靠数理统计或机器学习方法似乎并不充分。