Garcia-Gutierrez Irene, Dueñas-Requena Irene, Sanchez-Garcia Violeta, Solorzano-Zepeda Cristiana, Santos-Benito Samuel, de la Hoz-Caballer Belen, Antolin-Amerigo Dario
Allergy Department, Marqués de Valdecilla University Hospital, Santander, Spain.
Instituto de Investigación Marqués de Valdecilla, Santander, Spain.
JMIR Form Res. 2025 Aug 26;9:e71276. doi: 10.2196/71276.
Environmental exposure chambers (EECs) provide a controlled and reproducible setting for studying allergic rhinitis, allowing standardized exposure to aeroallergens. However, real-time symptom monitoring remains challenging, particularly as patients must be observed remotely while inside the chamber.
This study aimed to design, implement, and evaluate an integrated eHealth system that leverages digital tools for data collection and real-time clinical monitoring during EEC exposures. The goal was to streamline workflow, enhance data reliability, and improve patient safety during allergen challenges.
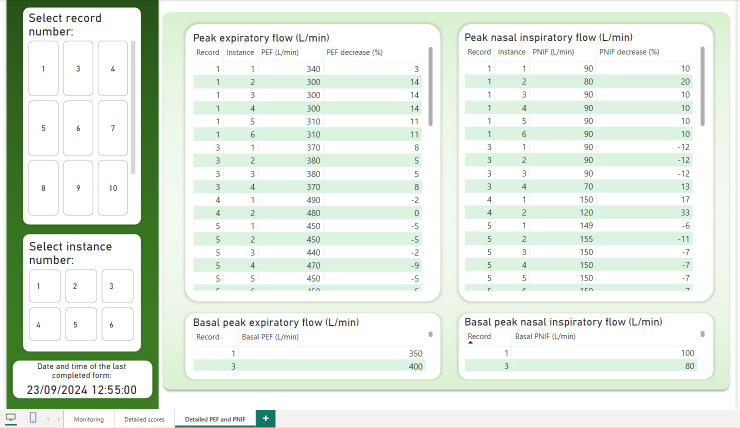
We conducted a prospective pilot study in a validated EEC at Ramón y Cajal University Hospital. A total of 34 provocation tests were conducted: 27 in patients with confirmed grass pollen allergy and 7 in nonallergic controls. All exposures took place outside the pollen season using standardized Phleum pratense (grass pollen) at concentrations of 940±100 grains/m³. Clinical data were collected using REDCap (Research Electronic Data Capture; Vanderbilt University), a secure electronic data capture platform. Surveys were automatically scheduled and included standardized instruments: Visual Analog Scale (VAS), Total Nasal Symptom Score (TNSS), Total Ocular Symptom Score (TOSS), asthma symptom questionnaires, peak expiratory flow (PEF), and peak nasal inspiratory flow (PNIF). Data were visualized in real time using Power BI dashboards (Microsoft Corp).
Among allergic patients, 85% had a positive response to the allergen exposure, with a median TNSS of 6 (IQR 6-7), while controls showed no positive reactions. Mean exposure time for positive cases was 48.9 minutes (SD 28.3), as patients were withdrawn early upon reaching symptom thresholds. The REDCap system was configured to collect symptom surveys at 15-minute intervals, allowing up to 6 entries per patient during exposure, depending on clinical tolerance. This setup enabled consistent symptom monitoring and integration with Power BI for real-time visualization. All records were successfully synchronized between REDCap and Power BI. Informal feedback from medical staff highlighted improved workflow and usability.
The integration of REDCap with Power BI enabled automated, real-time tracking of symptoms during EEC exposures. This eHealth solution enhanced clinical oversight, supported timely decision-making, and ensured patient safety. The platform provides a flexible and reproducible model for use in allergen exposure studies and other clinical settings requiring structured remote monitoring. Clinical response data are reported in a separate validation study.
环境暴露舱(EECs)为研究过敏性鼻炎提供了一个可控且可重复的环境,能够对空气过敏原进行标准化暴露。然而,实时症状监测仍然具有挑战性,尤其是在患者身处舱内时必须进行远程观察。
本研究旨在设计、实施并评估一个集成的电子健康系统,该系统利用数字工具在EEC暴露期间进行数据收集和实时临床监测。目标是简化工作流程,提高数据可靠性,并在过敏原激发试验期间提高患者安全性。
我们在拉蒙·y·卡哈尔大学医院经验证的EEC中进行了一项前瞻性试点研究。共进行了34次激发试验:27次针对确诊的草花粉过敏患者,7次针对非过敏对照者。所有暴露均在花粉季节之外进行,使用浓度为940±100粒/立方米的标准化早熟禾(草花粉)。临床数据使用REDCap(研究电子数据采集;范德比尔特大学)收集,这是一个安全的电子数据采集平台。调查自动安排,包括标准化工具:视觉模拟量表(VAS)、总鼻症状评分(TNSS)、总眼症状评分(TOSS)、哮喘症状问卷、呼气峰值流速(PEF)和鼻吸气峰值流速(PNIF)。数据使用Power BI仪表板(微软公司)进行实时可视化。
在过敏患者中,85%对过敏原暴露有阳性反应,TNSS中位数为6(四分位间距6 - 7),而对照组未显示阳性反应。阳性病例的平均暴露时间为48.9分钟(标准差28.3),因为患者在达到症状阈值后提前退出。REDCap系统配置为每隔15分钟收集一次症状调查,根据临床耐受性,每位患者在暴露期间最多可录入6次。这种设置实现了一致的症状监测,并与Power BI集成以进行实时可视化。所有记录在REDCap和Power BI之间成功同步。医务人员的非正式反馈强调了工作流程和可用性的改善。
REDCap与Power BI的集成实现了EEC暴露期间症状的自动化实时跟踪。这种电子健康解决方案加强了临床监督,支持及时决策,并确保了患者安全。该平台为过敏原暴露研究和其他需要结构化远程监测的临床环境提供了一个灵活且可重复的模型。临床反应数据在另一项验证研究中报告。