• 文献检索
  • 文档翻译
  • 深度研究
  • 学术资讯
  • Suppr Zotero 插件Zotero 插件
  • 邀请有礼
  • 套餐&价格
  • 历史记录
应用&插件
Suppr Zotero 插件Zotero 插件浏览器插件Mac 客户端Windows 客户端微信小程序
定价
高级版会员购买积分包购买API积分包
服务
文献检索文档翻译深度研究API 文档MCP 服务
关于我们
关于 Suppr公司介绍联系我们用户协议隐私条款
关注我们

Suppr 超能文献

核心技术专利:CN118964589B侵权必究
粤ICP备2023148730 号-1Suppr @ 2026

文献检索

告别复杂PubMed语法,用中文像聊天一样搜索,搜遍4000万医学文献。AI智能推荐,让科研检索更轻松。

立即免费搜索

文件翻译

保留排版,准确专业,支持PDF/Word/PPT等文件格式,支持 12+语言互译。

免费翻译文档

深度研究

AI帮你快速写综述,25分钟生成高质量综述,智能提取关键信息,辅助科研写作。

立即免费体验

疾病数据的地质统计学分析:利用泊松克里金法和p场模拟对癌症死亡风险的空间不确定性进行可视化和传播

Geostatistical analysis of disease data: visualization and propagation of spatial uncertainty in cancer mortality risk using Poisson kriging and p-field simulation.

作者信息

Goovaerts Pierre

机构信息

BioMedware, Inc., Ann Arbor, MI, USA.

出版信息

Int J Health Geogr. 2006 Feb 9;5:7. doi: 10.1186/1476-072X-5-7.

DOI:10.1186/1476-072X-5-7
PMID:16469095
原文链接:https://pmc.ncbi.nlm.nih.gov/articles/PMC1388192/
Abstract

BACKGROUND

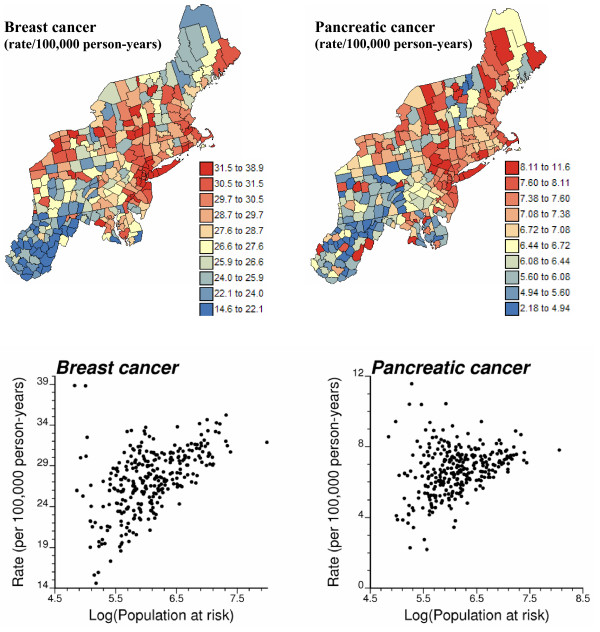
Smoothing methods have been developed to improve the reliability of risk cancer estimates from sparsely populated geographical entities. Filtering local details of the spatial variation of the risk leads however to the detection of larger clusters of low or high cancer risk while most spatial outliers are filtered out. Static maps of risk estimates and the associated prediction variance also fail to depict the uncertainty attached to the spatial distribution of risk values and does not allow its propagation through local cluster analysis. This paper presents a geostatistical methodology to generate multiple realizations of the spatial distribution of risk values. These maps are then fed into spatial operators, such as in local cluster analysis, allowing one to assess how risk spatial uncertainty translates into uncertainty about the location of spatial clusters and outliers. This novel approach is applied to age-adjusted breast and pancreatic cancer mortality rates recorded for white females in 295 US counties of the Northeast (1970-1994). A public-domain executable with example datasets is provided.

RESULTS

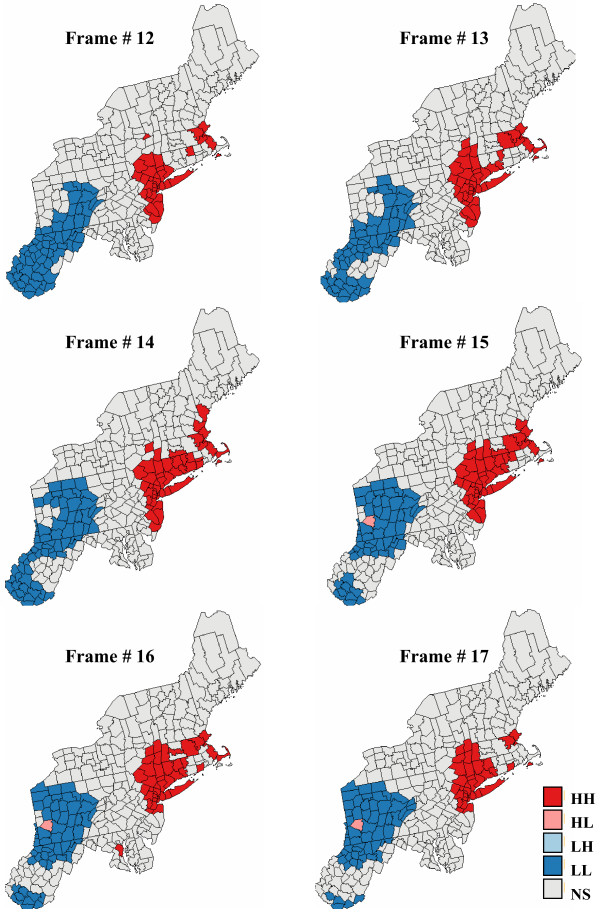
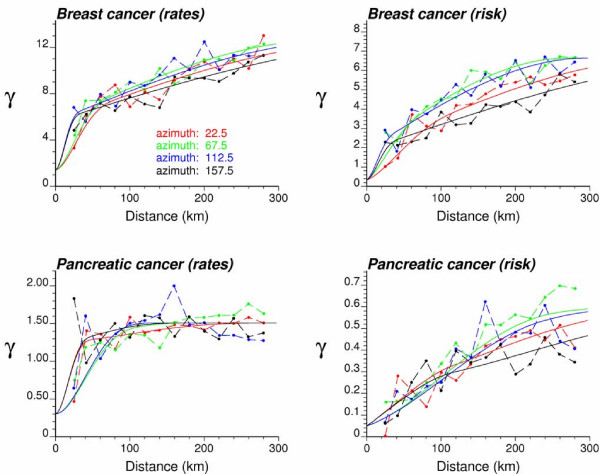
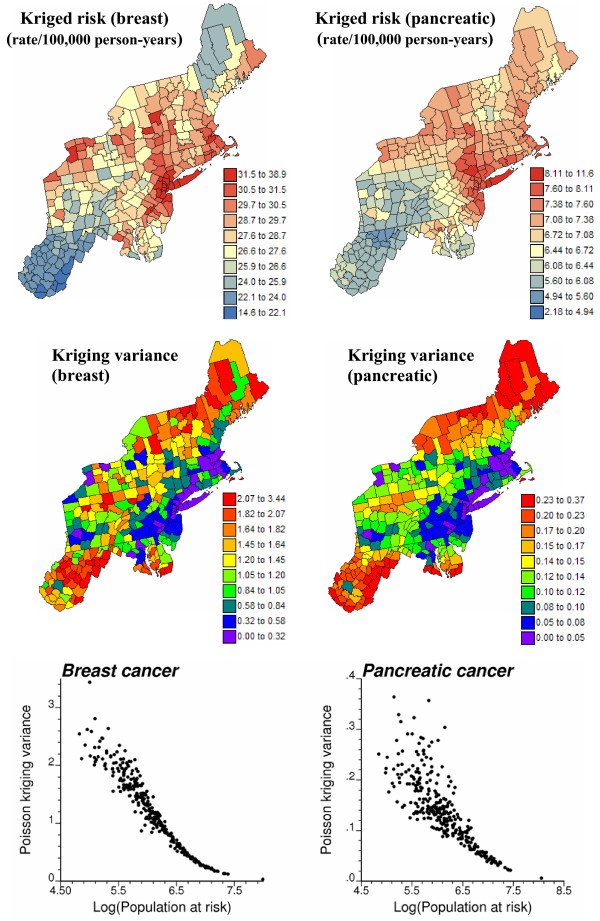
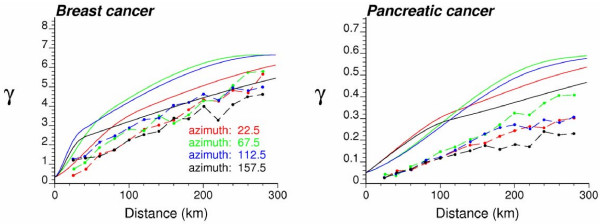
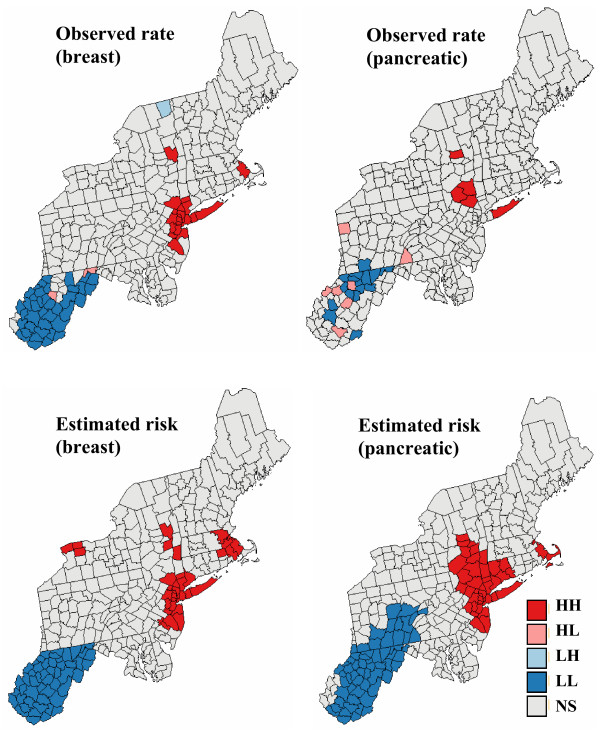
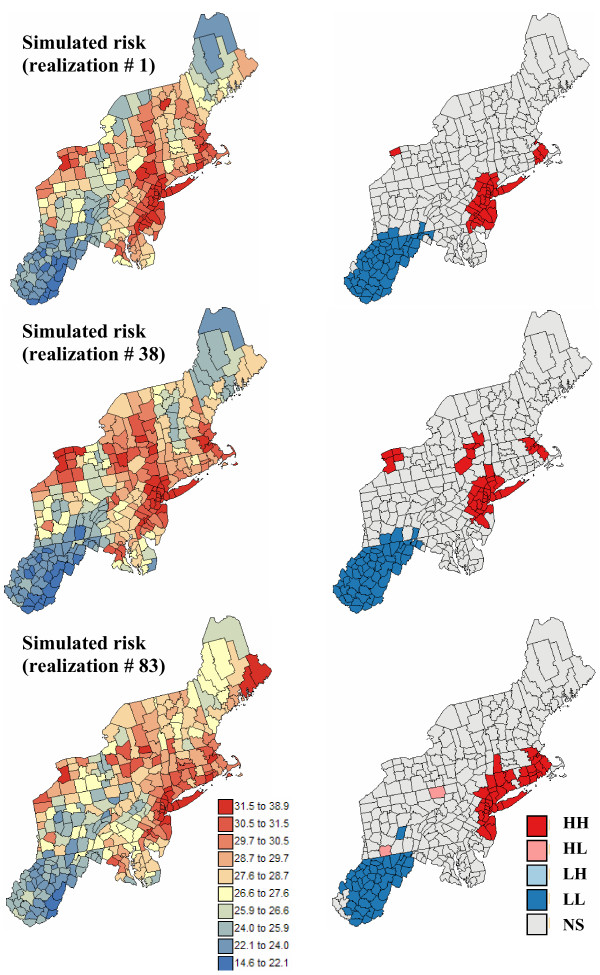
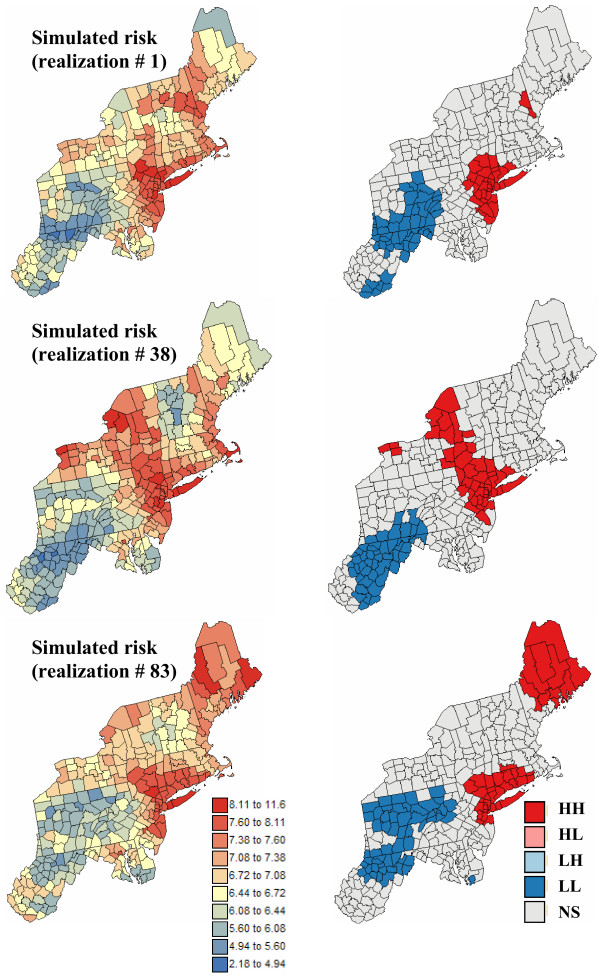
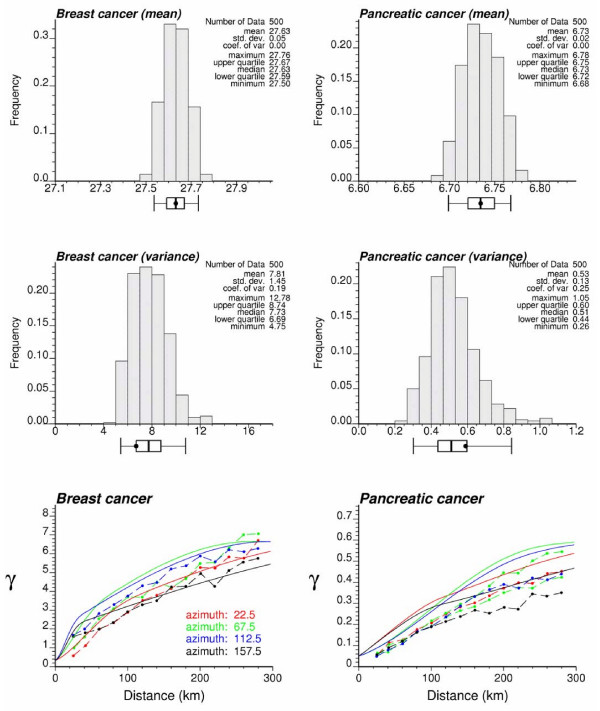
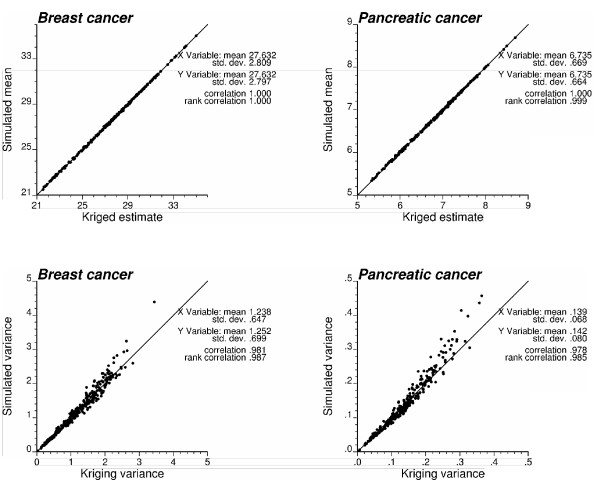
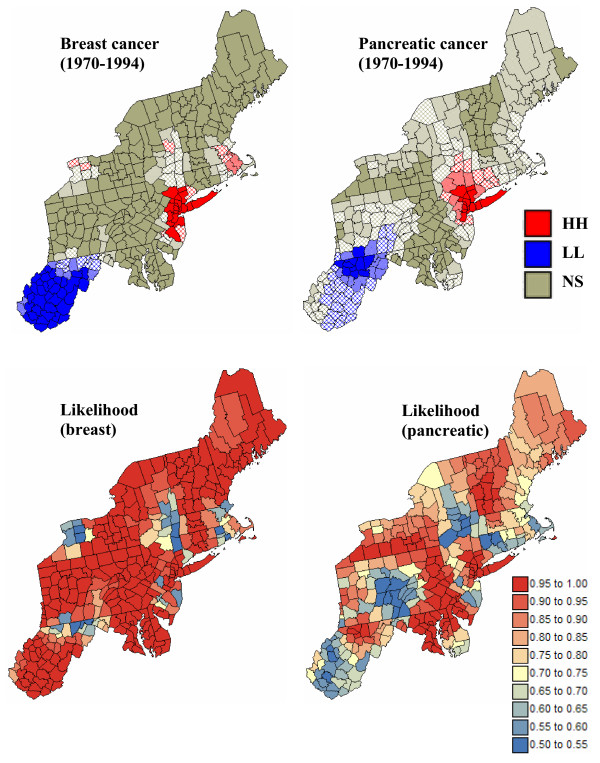
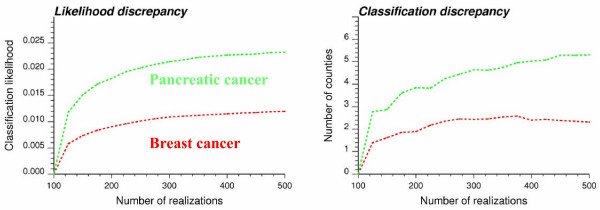
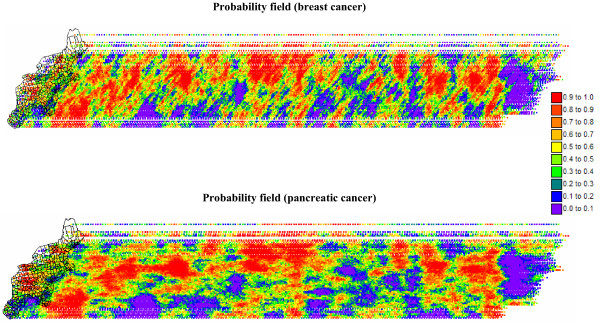
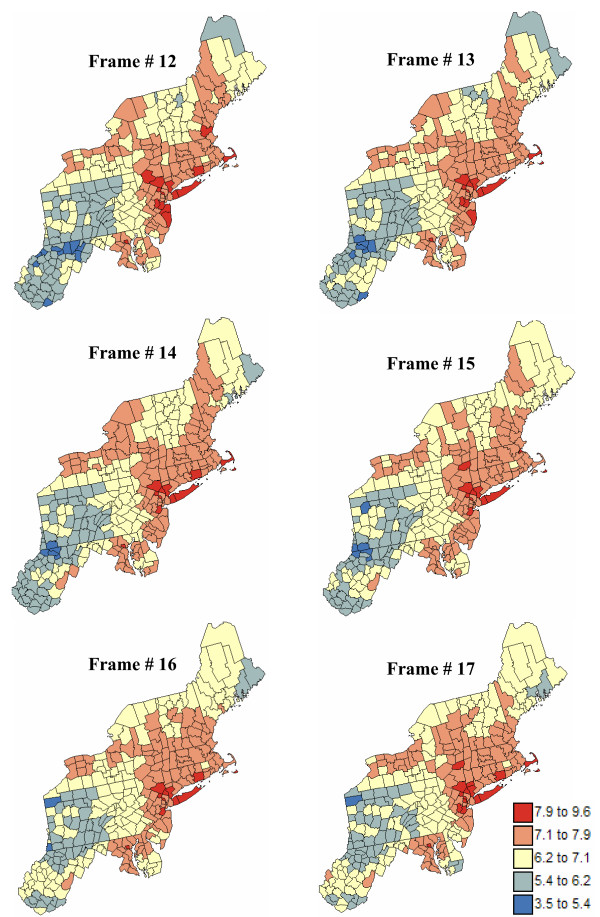
Geostatistical simulation generates risk maps that are more variable than the smooth risk map estimated by Poisson kriging and reproduce better the spatial pattern captured by the risk semivariogram model. Local cluster analysis of the set of simulated risk maps leads to a clear visualization of the lower reliability of the classification obtained for pancreatic cancer versus breast cancer: only a few counties in the large cluster of low risk detected in West Virginia and Southern Pennsylvania are significant over 90% of all simulations. On the other hand, the cluster of high breast cancer mortality in Niagara county, detected after application of Poisson kriging, appears on 60% of simulated risk maps. Sensitivity analysis shows that 500 realizations are needed to achieve a stable classification for pancreatic cancer, while convergence is reached for less than 300 realizations for breast cancer.

CONCLUSION

The approach presented in this paper enables researchers to generate a set of simulated risk maps that are more realistic than a single map of smoothed mortality rates and allow the propagation of cancer risk uncertainty through local cluster analysis. Coupled with visualization and querying capabilities of geographical information systems, animated display of realizations can highlight areas that depart consistently from the general behavior observed across the region, guiding further investigation and control activities.

摘要

背景

已开发出平滑方法,以提高从人口稀少的地理区域得出的癌症风险估计的可靠性。然而,对风险空间变化的局部细节进行滤波会导致检测到更大的低风险或高风险集群,而大多数空间异常值会被滤除。风险估计的静态地图以及相关的预测方差也无法描绘风险值空间分布所附带的不确定性,并且不允许其通过局部聚类分析进行传播。本文提出了一种地质统计学方法,用于生成风险值空间分布的多个实现。然后将这些地图输入到空间算子中,例如在局部聚类分析中,从而使人们能够评估风险空间不确定性如何转化为空间集群和异常值位置的不确定性。这种新颖的方法应用于美国东北部295个县(1970 - 1994年)白人女性的年龄调整后乳腺癌和胰腺癌死亡率。提供了一个带有示例数据集的公共领域可执行文件。

结果

地质统计学模拟生成的风险地图比通过泊松克里金法估计的平滑风险地图更具变异性,并且能更好地再现由风险半变异函数模型捕获的空间模式。对模拟风险地图集进行局部聚类分析,可以清晰地看到胰腺癌与乳腺癌分类可靠性的差异:在西弗吉尼亚州和宾夕法尼亚州南部检测到的低风险大集群中,只有少数几个县在所有模拟中超过90%是显著的。另一方面,在应用泊松克里金法后检测到的尼亚加拉县高乳腺癌死亡率集群出现在60%的模拟风险地图上。敏感性分析表明,胰腺癌需要500次实现才能达到稳定分类,而乳腺癌不到300次实现就可达到收敛。

结论

本文提出的方法使研究人员能够生成一组比单一平滑死亡率地图更现实的模拟风险地图,并允许癌症风险不确定性通过局部聚类分析进行传播。结合地理信息系统的可视化和查询功能,实现的动态显示可以突出那些与整个区域观察到的一般行为持续不同的区域,指导进一步的调查和控制活动。

https://cdn.ncbi.nlm.nih.gov/pmc/blobs/2591/1388192/c07ec1aa8013/1476-072X-5-7-18.jpg
https://cdn.ncbi.nlm.nih.gov/pmc/blobs/2591/1388192/52e6872e6ad7/1476-072X-5-7-1.jpg
https://cdn.ncbi.nlm.nih.gov/pmc/blobs/2591/1388192/bdfec202cad2/1476-072X-5-7-2.jpg
https://cdn.ncbi.nlm.nih.gov/pmc/blobs/2591/1388192/d7911345ca04/1476-072X-5-7-3.jpg
https://cdn.ncbi.nlm.nih.gov/pmc/blobs/2591/1388192/a9569abbf510/1476-072X-5-7-4.jpg
https://cdn.ncbi.nlm.nih.gov/pmc/blobs/2591/1388192/c4704daf26cd/1476-072X-5-7-5.jpg
https://cdn.ncbi.nlm.nih.gov/pmc/blobs/2591/1388192/b9f5c077fd3c/1476-072X-5-7-6.jpg
https://cdn.ncbi.nlm.nih.gov/pmc/blobs/2591/1388192/b2638a23032f/1476-072X-5-7-7.jpg
https://cdn.ncbi.nlm.nih.gov/pmc/blobs/2591/1388192/17e354e3576e/1476-072X-5-7-8.jpg
https://cdn.ncbi.nlm.nih.gov/pmc/blobs/2591/1388192/f2a10b8bfabc/1476-072X-5-7-9.jpg
https://cdn.ncbi.nlm.nih.gov/pmc/blobs/2591/1388192/a56ad604f264/1476-072X-5-7-10.jpg
https://cdn.ncbi.nlm.nih.gov/pmc/blobs/2591/1388192/2fbedbca49cb/1476-072X-5-7-11.jpg
https://cdn.ncbi.nlm.nih.gov/pmc/blobs/2591/1388192/e1697c099dd5/1476-072X-5-7-12.jpg
https://cdn.ncbi.nlm.nih.gov/pmc/blobs/2591/1388192/6900c0bb76d8/1476-072X-5-7-13.jpg
https://cdn.ncbi.nlm.nih.gov/pmc/blobs/2591/1388192/650c987100c7/1476-072X-5-7-14.jpg
https://cdn.ncbi.nlm.nih.gov/pmc/blobs/2591/1388192/f028b641dce9/1476-072X-5-7-15.jpg
https://cdn.ncbi.nlm.nih.gov/pmc/blobs/2591/1388192/d92375bb808d/1476-072X-5-7-16.jpg
https://cdn.ncbi.nlm.nih.gov/pmc/blobs/2591/1388192/6b1e1e2c389d/1476-072X-5-7-17.jpg
https://cdn.ncbi.nlm.nih.gov/pmc/blobs/2591/1388192/c07ec1aa8013/1476-072X-5-7-18.jpg

相似文献

1
Geostatistical analysis of disease data: visualization and propagation of spatial uncertainty in cancer mortality risk using Poisson kriging and p-field simulation.疾病数据的地质统计学分析:利用泊松克里金法和p场模拟对癌症死亡风险的空间不确定性进行可视化和传播
Int J Health Geogr. 2006 Feb 9;5:7. doi: 10.1186/1476-072X-5-7.
2
Geostatistical analysis of disease data: accounting for spatial support and population density in the isopleth mapping of cancer mortality risk using area-to-point Poisson kriging.疾病数据的地统计分析:在使用面积到点的泊松克里金法绘制癌症死亡风险等值线图时考虑空间支持和人口密度。
Int J Health Geogr. 2006 Nov 30;5:52. doi: 10.1186/1476-072X-5-52.
3
How does Poisson kriging compare to the popular BYM model for mapping disease risks?与用于绘制疾病风险图的流行的贝叶斯层次模型(BYM)相比,泊松克里金法如何?
Int J Health Geogr. 2008 Feb 4;7:6. doi: 10.1186/1476-072X-7-6.
4
Geostatistical analysis of disease data: estimation of cancer mortality risk from empirical frequencies using Poisson kriging.疾病数据的地质统计学分析:使用泊松克里金法从经验频率估计癌症死亡风险。
Int J Health Geogr. 2005 Dec 14;4:31. doi: 10.1186/1476-072X-4-31.
5
Application of Poisson kriging to the mapping of cholera and dysentery incidence in an endemic area of Bangladesh.泊松克里格法在孟加拉国一个地方病流行区霍乱和痢疾发病率绘图中的应用。
Int J Health Geogr. 2006 Oct 13;5:45. doi: 10.1186/1476-072X-5-45.
6
Accounting for rate instability and spatial patterns in the boundary analysis of cancer mortality maps.在癌症死亡率地图的边界分析中考虑率的不稳定性和空间模式。
Environ Ecol Stat. 2008 Dec;15(4):421-446. doi: 10.1007/s10651-007-0064-6.
7
Adjusting for sampling variability in sparse data: geostatistical approaches to disease mapping.调整稀疏数据中的抽样变异性:疾病制图的地质统计学方法。
Int J Health Geogr. 2011 Oct 6;10:54. doi: 10.1186/1476-072X-10-54.
8
Accounting for regional background and population size in the detection of spatial clusters and outliers using geostatistical filtering and spatial neutral models: the case of lung cancer in Long Island, New York.在使用地理统计滤波和空间中性模型检测空间聚类和离群值时考虑区域背景和人口规模:以纽约长岛的肺癌为例。
Int J Health Geogr. 2004 Jul 23;3(1):14. doi: 10.1186/1476-072X-3-14.
9
Folic acid supplementation and malaria susceptibility and severity among people taking antifolate antimalarial drugs in endemic areas.在流行地区,服用抗叶酸抗疟药物的人群中,叶酸补充剂与疟疾易感性和严重程度的关系。
Cochrane Database Syst Rev. 2022 Feb 1;2(2022):CD014217. doi: 10.1002/14651858.CD014217.
10
A two-stage approach to estimate spatial and spatio-temporal disease risks in the presence of local discontinuities and clusters.一种在存在局部不连续性和聚集性的情况下估计空间和时空疾病风险的两阶段方法。
Stat Methods Med Res. 2019 Sep;28(9):2595-2613. doi: 10.1177/0962280218767975. Epub 2018 Apr 13.

引用本文的文献

1
From Natural Resources Evaluation to Spatial Epidemiology: 25 Years in the Making.从自然资源评估到空间流行病学:二十五年磨一剑。
Math Geosci. 2021 Feb;53(2):239-266. doi: 10.1007/s11004-020-09886-x. Epub 2020 Aug 28.
2
Estimating uncertainty in geospatial modelling at multiple spatial resolutions: the pattern of delivery via caesarean section in Tanzania.评估多空间分辨率下地理空间建模的不确定性:坦桑尼亚剖宫产分娩模式
BMJ Glob Health. 2020 Feb 10;4(Suppl 5):e002092. doi: 10.1136/bmjgh-2019-002092. eCollection 2019.
3
Spatial association between outdoor air pollution and lung cancer incidence in China.

本文引用的文献

1
Geostatistical analysis of disease data: estimation of cancer mortality risk from empirical frequencies using Poisson kriging.疾病数据的地质统计学分析:使用泊松克里金法从经验频率估计癌症死亡风险。
Int J Health Geogr. 2005 Dec 14;4:31. doi: 10.1186/1476-072X-4-31.
2
A comparison of Bayesian spatial models for disease mapping.用于疾病地图绘制的贝叶斯空间模型比较。
Stat Methods Med Res. 2005 Feb;14(1):35-59. doi: 10.1191/0962280205sm388oa.
3
Small area mapping of prostate cancer incidence in New York State (USA) using fully Bayesian hierarchical modelling.
中国户外空气污染与肺癌发病率的空间关联。
BMC Public Health. 2019 Oct 26;19(1):1377. doi: 10.1186/s12889-019-7740-y.
4
Border analysis for spatial clusters.空间聚类的边界分析。
Int J Health Geogr. 2018 Feb 17;17(1):5. doi: 10.1186/s12942-018-0124-1.
5
Exploring spatial patterns of sudden cardiac arrests in the city of Toronto using Poisson kriging and Hot Spot analyses.使用泊松克里金法和热点分析探索多伦多市心脏骤停的空间模式。
PLoS One. 2017 Jul 3;12(7):e0180721. doi: 10.1371/journal.pone.0180721. eCollection 2017.
6
A multivariate geostatistical methodology to delineate areas of potential interest for future sedimentary gold exploration.一种用于划定未来沉积型金矿勘探潜在感兴趣区域的多元地质统计学方法。
Math Geosci. 2016 Nov;48(8):921-939. doi: 10.1007/s11004-015-9632-8. Epub 2016 Feb 1.
7
Geostatistics: a common link between medical geography, mathematical geology, and medical geology.地质统计学:医学地理学、数学地质学和医学地质学之间的共同纽带。
J South Afr Inst Min Metall. 2014 Aug;114:605-612.
8
Spatial clustering of tuberculosis incidence in the North of Iran.伊朗北部结核病发病率的空间聚集性。
Glob J Health Sci. 2014 Sep 24;6(6):288-94. doi: 10.5539/gjhs.v6n6p288.
9
Spatial relationship quantification between environmental, socioeconomic and health data at different geographic levels.不同地理层面环境、社会经济与健康数据之间的空间关系量化
Int J Environ Res Public Health. 2014 Apr 3;11(4):3765-86. doi: 10.3390/ijerph110403765.
10
Assessing and mapping spatial associations among oral cancer mortality rates, concentrations of heavy metals in soil, and land use types based on multiple scale data.基于多尺度数据评估和绘制口腔癌死亡率、土壤中重金属浓度与土地利用类型之间的空间关联。
Int J Environ Res Public Health. 2014 Feb 21;11(2):2148-68. doi: 10.3390/ijerph110202148.
使用全贝叶斯层次模型对美国纽约州前列腺癌发病率进行小区域绘图。
Int J Health Geogr. 2004 Dec 8;3(1):29. doi: 10.1186/1476-072X-3-29.
4
Visualization and exploratory analysis of epidemiologic data using a novel space time information system.使用新型时空信息系统对流行病学数据进行可视化和探索性分析。
Int J Health Geogr. 2004 Nov 8;3(1):26. doi: 10.1186/1476-072X-3-26.
5
Accounting for regional background and population size in the detection of spatial clusters and outliers using geostatistical filtering and spatial neutral models: the case of lung cancer in Long Island, New York.在使用地理统计滤波和空间中性模型检测空间聚类和离群值时考虑区域背景和人口规模:以纽约长岛的肺癌为例。
Int J Health Geogr. 2004 Jul 23;3(1):14. doi: 10.1186/1476-072X-3-14.
6
Interpreting posterior relative risk estimates in disease-mapping studies.疾病地图绘制研究中后验相对风险估计值的解读
Environ Health Perspect. 2004 Jun;112(9):1016-25. doi: 10.1289/ehp.6740.
7
Mapping disease and mortality rates using empirical Bayes estimators.使用经验贝叶斯估计量绘制疾病和死亡率图表。
J R Stat Soc Ser C Appl Stat. 1991;40(2):283-94.
8
Bayesian prediction of spatial count data using generalized linear mixed models.使用广义线性混合模型对空间计数数据进行贝叶斯预测。
Biometrics. 2002 Jun;58(2):280-6. doi: 10.1111/j.0006-341x.2002.00280.x.
9
Alternate ranging methods for cancer mortality maps.癌症死亡率地图的替代测距方法。
J Natl Cancer Inst. 2000 Apr 5;92(7):534-43. doi: 10.1093/jnci/92.7.534.
10
Exploring spatial patterns of mortality: the new atlas of United States mortality.探索死亡率的空间模式:美国死亡率新地图集
Stat Med. 1999 Dec 15;18(23):3211-20. doi: 10.1002/(sici)1097-0258(19991215)18:23<3211::aid-sim311>3.0.co;2-q.