Avruskin Gillian A, Jacquez Geoffrey M, Meliker Jaymie R, Slotnick Melissa J, Kaufmann Andrew M, Nriagu Jerome O
BioMedware Inc,, 516 N, State St,, Ann Arbor, MI 48104, USA.
Int J Health Geogr. 2004 Nov 8;3(1):26. doi: 10.1186/1476-072X-3-26.
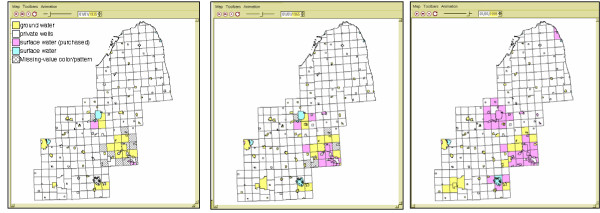
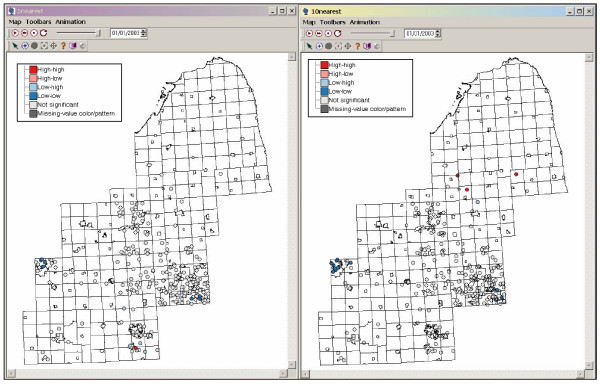
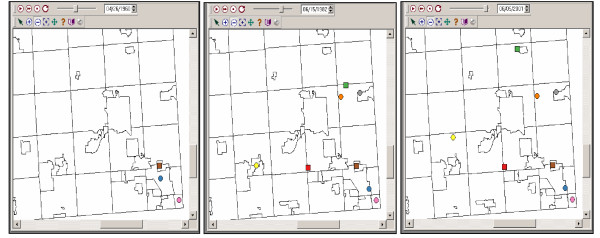
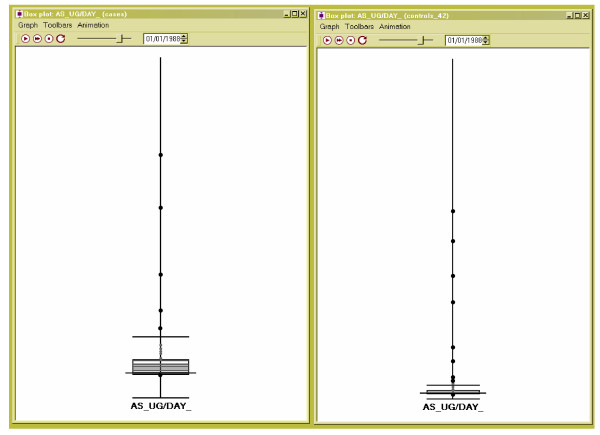
Recent years have seen an expansion in the use of Geographic Information Systems (GIS) in environmental health research. In this field GIS can be used to detect disease clustering, to analyze access to hospital emergency care, to predict environmental outbreaks, and to estimate exposure to toxic compounds. Despite these advances the inability of GIS to properly handle temporal information is increasingly recognised as a significant constraint. The effective representation and visualization of both spatial and temporal dimensions therefore is expected to significantly enhance our ability to undertake environmental health research using time-referenced geospatial data. Especially for diseases with long latency periods (such as cancer) the ability to represent, quantify and model individual exposure through time is a critical component of risk estimation. In response to this need a STIS - a Space Time Information System has been developed to visualize and analyze objects simultaneously through space and time. RESULTS: In this paper we present a "first use" of a STIS in a case-control study of the relationship between arsenic exposure and bladder cancer in south eastern Michigan. Individual arsenic exposure is reconstructed by incorporating spatiotemporal data including residential mobility and drinking water habits. The unique contribution of the STIS is its ability to visualize and analyze residential histories over different temporal scales. Participant information is viewed and statistically analyzed using dynamic views in which values of an attribute change through time. These views include tables, graphs (such as histograms and scatterplots), and maps. In addition, these views can be linked and synchronized for complex data exploration using cartographic brushing, statistical brushing, and animation. CONCLUSION: The STIS provides new and powerful ways to visualize and analyze how individual exposure and associated environmental variables change through time. We expect to see innovative space-time methods being utilized in future environmental health research now that the successful "first use" of a STIS in exposure reconstruction has been accomplished.
近年来,地理信息系统(GIS)在环境卫生研究中的应用不断扩展。在该领域,GIS可用于检测疾病聚集情况、分析医院急诊服务的可及性、预测环境疫情爆发以及估算有毒化合物暴露情况。尽管取得了这些进展,但人们越来越认识到GIS无法妥善处理时间信息是一个重大限制。因此,有效呈现和可视化空间与时间维度有望显著增强我们利用时间参考地理空间数据开展环境卫生研究的能力。特别是对于潜伏期较长的疾病(如癌症),通过时间来呈现、量化和模拟个体暴露的能力是风险评估的关键组成部分。为满足这一需求,已开发出一种时空信息系统(STIS),用于同时通过空间和时间对对象进行可视化和分析。
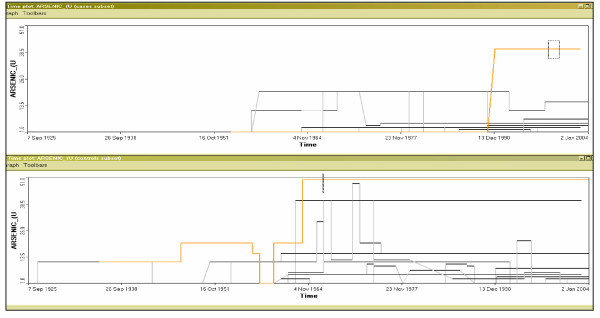
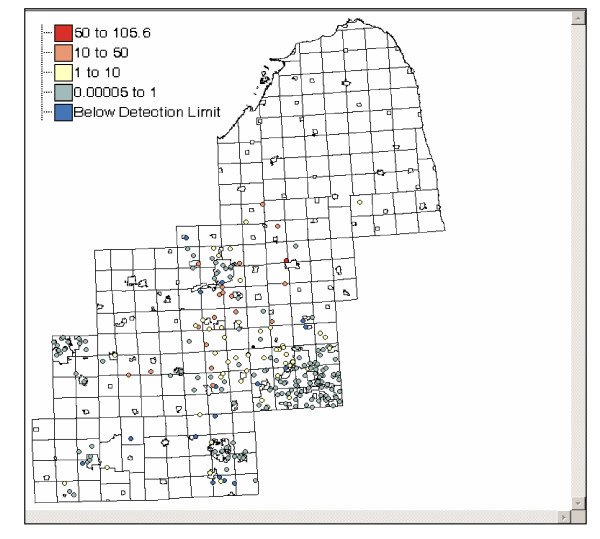
在本文中,我们展示了STIS在密歇根州东南部砷暴露与膀胱癌关系的病例对照研究中的“首次应用”。通过纳入包括居住流动性和饮用水习惯在内的时空数据,重建个体砷暴露情况。STIS的独特贡献在于其能够在不同时间尺度上可视化和分析居住历史。使用动态视图查看和统计分析参与者信息,其中属性值随时间变化。这些视图包括表格、图表(如直方图和散点图)以及地图。此外,这些视图可以通过地图擦除、统计擦除和动画进行链接和同步,以进行复杂的数据探索。
STIS提供了新的强大方法来可视化和分析个体暴露及相关环境变量如何随时间变化。鉴于STIS在暴露重建方面的成功“首次应用”,我们预计未来环境卫生研究将采用创新的时空方法。