Hawes Debra, Downey Susan, Pearce Celeste Leigh, Bartow Sue, Wan Peggy, Pike Malcolm C, Wu Anna H
Department of Pathology, Keck School of Medicine, University of Southern California, 2011 Zonal Avenue, Los Angeles, CA 90089, USA.
Breast Cancer Res. 2006;8(2):R24. doi: 10.1186/bcr1408. Epub 2006 Apr 28.
Increased mammographic density is a strong risk factor for breast cancer. The reasons for this are not clear; two obvious possibilities are increased epithelial cell proliferation in mammographically dense areas and increased breast epithelium in women with mammographically dense breasts. We addressed this question by studying the number of epithelial cells in terminal duct lobular units (TDLUs) and in ducts, and their proliferation rates, as they related to local breast densities defined histologically within individual women.
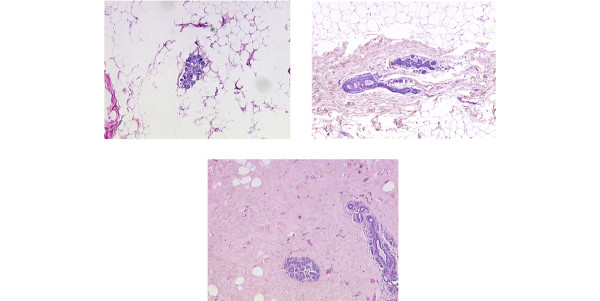
We studied deep breast tissue away from subcutaneous fat obtained from 12 healthy women undergoing reduction mammoplasty. A slide from each specimen was stained with the cell-proliferation marker MIB1. Each slide was divided into (sets of) areas of low, medium and high density of connective tissue (CT; highly correlated with mammographic densities). Within each of the areas, the numbers of epithelial cells in TDLUs and ducts, and the numbers MIB1 positive, were counted.
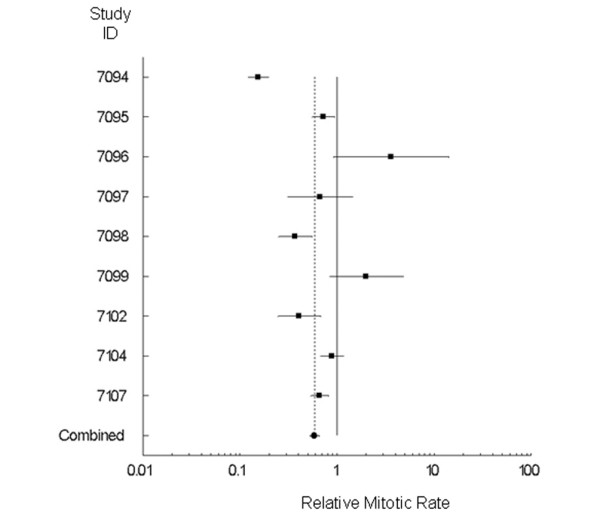
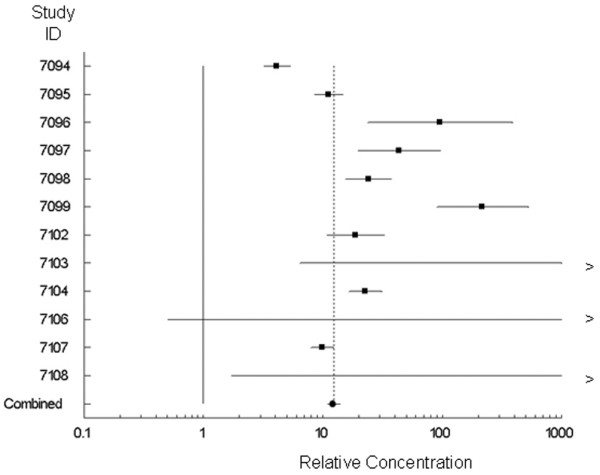
The relative concentration (RC) of epithelial cells in high compared with low CT density areas was 12.3 (95% confidence interval (CI) 10.9 to 13.8) in TDLUs and 34.1 (95% CI 26.9 to 43.2) in ducts. There was a much smaller difference between medium and low CT density areas: RC = 1.4 (95% CI 1.2 to 1.6) in TDLUs and 1.9 (95% CI 1.5 to 2.3) in ducts. The relative mitotic rate (RMR; MIB1 positive) of epithelial cells in high compared with low CT density areas was 0.59 (95% CI 0.53 to 0.66) in TDLUs and 0.65 (95% CI 0.53 to 0.79) in ducts; the figures for the comparison of medium with low CT density areas were 0.58 (95% CI 0.48 to 0.70) in TDLUs and 0.66 (95% CI 0.44 to 0.97) in ducts.
Breast epithelial cells are overwhelmingly concentrated in high CT density areas. Their proliferation rate in areas of high and medium CT density is lower than that in low CT density areas. The increased breast cancer risk associated with increased mammographic densities may simply be a reflection of increased epithelial cell numbers. Why epithelium is concentrated in high CT density areas remains to be explained.
乳腺钼靶密度增加是乳腺癌的一个重要危险因素。其原因尚不清楚;两种明显的可能性是,在乳腺钼靶密度高的区域上皮细胞增殖增加,以及乳腺钼靶密度高的女性乳腺上皮增多。我们通过研究终末导管小叶单位(TDLUs)和导管中的上皮细胞数量及其增殖率来探讨这个问题,这些与个体女性组织学定义的局部乳腺密度相关。
我们研究了12名接受缩乳术的健康女性皮下脂肪以外的深部乳腺组织。每个标本的一张玻片用细胞增殖标记物MIB1染色。每张玻片被分成结缔组织(CT;与乳腺钼靶密度高度相关)低密度、中密度和高密度区域(组)。在每个区域内,计数TDLUs和导管中的上皮细胞数量以及MIB1阳性细胞数量。
与低CT密度区域相比,高CT密度区域TDLUs中上皮细胞的相对浓度(RC)为12.3(95%置信区间(CI)10.9至13.8),导管中为34.1(95%CI 26.9至43.2)。中CT密度区域和低CT密度区域之间的差异要小得多:TDLUs中RC = 1.4(95%CI 1.2至1.6),导管中为1.9(95%CI 1.5至2.3)。与低CT密度区域相比,高CT密度区域TDLUs中上皮细胞的相对有丝分裂率(RMR;MIB1阳性)为0.59(95%CI 0.53至0.66),导管中为0.65(95%CI 0.53至0.79);中CT密度区域与低CT密度区域比较的数字,TDLUs中为0.58(95%CI 0.48至0.70),导管中为0.66(95%CI 0.44至0.97)。
乳腺上皮细胞绝大多数集中在高CT密度区域。它们在高CT密度和中CT密度区域的增殖率低于低CT密度区域。与乳腺钼靶密度增加相关的乳腺癌风险增加可能仅仅是上皮细胞数量增加的反映。上皮细胞为何集中在高CT密度区域仍有待解释。