Verhaak Roel G W, Sanders Mathijs A, Bijl Maarten A, Delwel Ruud, Horsman Sebastiaan, Moorhouse Michael J, van der Spek Peter J, Löwenberg Bob, Valk Peter J M
Department of Hematology, Erasmus University Medical Center, Rotterdam, The Netherlands.
BMC Bioinformatics. 2006 Jul 12;7:337. doi: 10.1186/1471-2105-7-337.
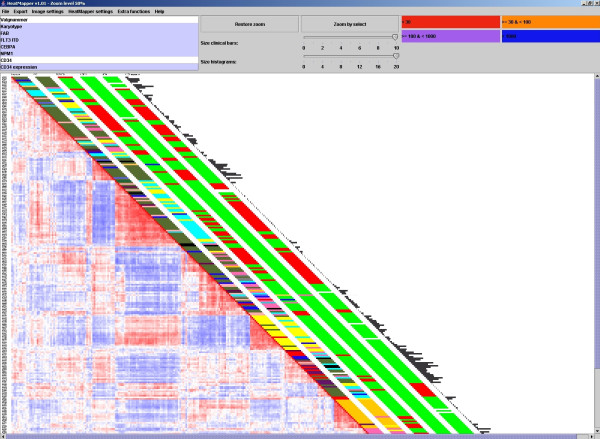
Accurate interpretation of data obtained by unsupervised analysis of large scale expression profiling studies is currently frequently performed by visually combining sample-gene heatmaps and sample characteristics. This method is not optimal for comparing individual samples or groups of samples. Here, we describe an approach to visually integrate the results of unsupervised and supervised cluster analysis using a correlation plot and additional sample metadata.
We have developed a tool called the HeatMapper that provides such visualizations in a dynamic and flexible manner and is available from http://www.erasmusmc.nl/hematologie/heatmapper/.
The HeatMapper allows an accessible and comprehensive visualization of the results of gene expression profiling and cluster analysis.
目前,通过对大规模表达谱研究进行无监督分析获得的数据的准确解读,常常是通过直观地合并样本-基因热图和样本特征来完成的。这种方法在比较单个样本或样本组时并非最优。在此,我们描述一种使用关联图和额外样本元数据来直观整合无监督和有监督聚类分析结果的方法。
我们开发了一种名为HeatMapper的工具,它能以动态且灵活的方式提供此类可视化,可从http://www.erasmusmc.nl/hematologie/heatmapper/获取。
HeatMapper能够对基因表达谱和聚类分析结果进行便捷且全面的可视化。