Truntzer Caroline, Mercier Catherine, Estève Jacques, Gautier Christian, Roy Pascal
CNRS, UMR 5558--Equipe Biostatistique Santé, Villeurbanne, France.
BMC Bioinformatics. 2007 Mar 13;8:90. doi: 10.1186/1471-2105-8-90.
With the advance of microarray technology, several methods for gene classification and prognosis have been already designed. However, under various denominations, some of these methods have similar approaches. This study evaluates the influence of gene expression variance structure on the performance of methods that describe the relationship between gene expression levels and a given phenotype through projection of data onto discriminant axes.
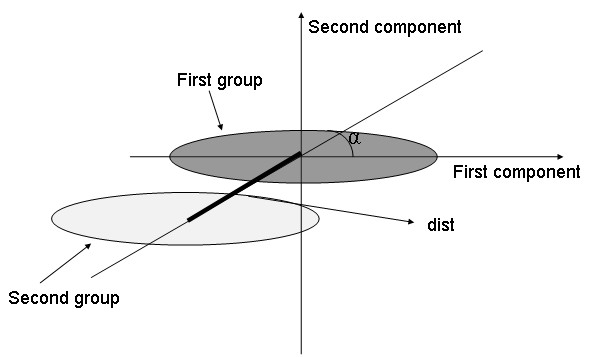
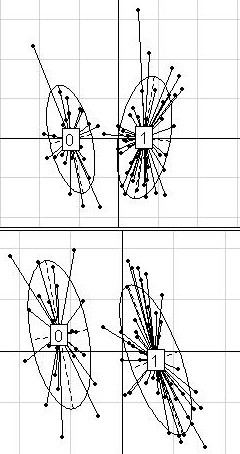
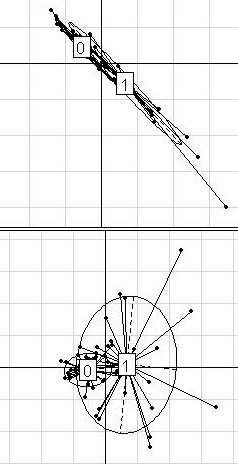
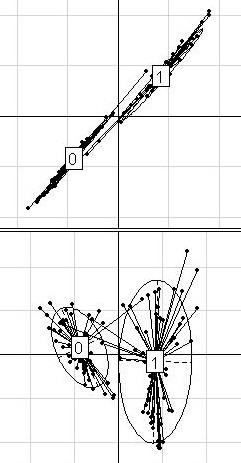
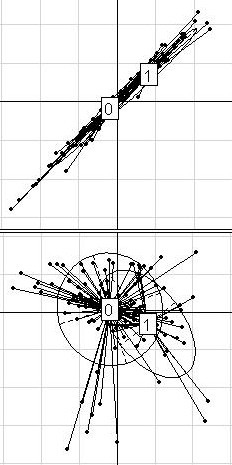
We compared Between-Group Analysis and Discriminant Analysis (with prior dimension reduction through Partial Least Squares or Principal Components Analysis). A geometric approach showed that these two methods are strongly related, but differ in the way they handle data structure. Yet, data structure helps understanding the predictive efficiency of these methods. Three main structure situations may be identified. When the clusters of points are clearly split, both methods perform equally well. When the clusters superpose, both methods fail to give interesting predictions. In intermediate situations, the configuration of the clusters of points has to be handled by the projection to improve prediction. For this, we recommend Discriminant Analysis. Besides, an innovative way of simulation generated the three main structures by modelling different partitions of the whole variance into within-group and between-group variances. These simulated datasets were used in complement to some well-known public datasets to investigate the methods behaviour in a large diversity of structure situations. To examine the structure of a dataset before analysis and preselect an a priori appropriate method for its analysis, we proposed a two-graph preliminary visualization tool: plotting patients on the Between-Group Analysis discriminant axis (x-axis) and on the first and the second within-group Principal Components Analysis component (y-axis), respectively.
Discriminant Analysis outperformed Between-Group Analysis because it allows for the dataset structure. An a priori knowledge of that structure may guide the choice of the analysis method. Simulated datasets with known properties are valuable to assess and compare the performance of analysis methods, then implementation on real datasets checks and validates the results. Thus, we warn against the use of unchallenging datasets for method comparison, such as the Golub dataset, because their structure is such that any method would be efficient.
随着微阵列技术的发展,已经设计出了几种基因分类和预后的方法。然而,在各种名称下,其中一些方法有相似的方法。本研究评估了基因表达方差结构对通过将数据投影到判别轴上来描述基因表达水平与给定表型之间关系的方法性能的影响。
我们比较了组间分析和判别分析(通过偏最小二乘法或主成分分析进行先验降维)。一种几何方法表明这两种方法密切相关,但在处理数据结构的方式上有所不同。然而,数据结构有助于理解这些方法的预测效率。可以识别出三种主要的结构情况。当点簇明显分开时,两种方法表现同样良好。当簇重叠时,两种方法都无法给出有趣的预测。在中间情况下,点簇的配置必须通过投影来处理以改善预测。为此,我们推荐判别分析。此外,一种创新的模拟方法通过将整个方差建模为组内方差和组间方差的不同划分来生成三种主要结构。这些模拟数据集被用于补充一些知名的公共数据集,以研究方法在各种结构情况下的行为。为了在分析前检查数据集的结构并预先选择一种适合其分析的先验方法,我们提出了一种双图初步可视化工具:分别将患者绘制在组间分析判别轴(x轴)以及第一和第二组内主成分分析成分(y轴)上。
判别分析优于组间分析,因为它考虑了数据集结构。对该结构的先验知识可以指导分析方法的选择。具有已知属性的模拟数据集对于评估和比较分析方法的性能很有价值,然后在真实数据集上的实施可以检查和验证结果。因此,我们警告不要使用像Golub数据集这样缺乏挑战性的数据集进行方法比较,因为它们的结构使得任何方法都会有效。