• 文献检索
  • 文档翻译
  • 深度研究
  • 学术资讯
  • Suppr Zotero 插件Zotero 插件
  • 邀请有礼
  • 套餐&价格
  • 历史记录
应用&插件
Suppr Zotero 插件Zotero 插件浏览器插件Mac 客户端Windows 客户端微信小程序
定价
高级版会员购买积分包购买API积分包
服务
文献检索文档翻译深度研究API 文档MCP 服务
关于我们
关于 Suppr公司介绍联系我们用户协议隐私条款
关注我们

Suppr 超能文献

核心技术专利:CN118964589B侵权必究
粤ICP备2023148730 号-1Suppr @ 2026

文献检索

告别复杂PubMed语法,用中文像聊天一样搜索,搜遍4000万医学文献。AI智能推荐,让科研检索更轻松。

立即免费搜索

文件翻译

保留排版,准确专业,支持PDF/Word/PPT等文件格式,支持 12+语言互译。

免费翻译文档

深度研究

AI帮你快速写综述,25分钟生成高质量综述,智能提取关键信息,辅助科研写作。

立即免费体验

与金标准数据集差异表达检验相对应的假定零分布是强度依赖性的。

Putative null distributions corresponding to tests of differential expression in the Golden Spike dataset are intensity dependent.

作者信息

Gaile Daniel P, Miecznikowski Jeffrey C

机构信息

Department of Biostatistics, University at Buffalo, Buffalo, New York, USA.

出版信息

BMC Genomics. 2007 Apr 19;8:105. doi: 10.1186/1471-2164-8-105.

DOI:10.1186/1471-2164-8-105
PMID:17445265
原文链接:https://pmc.ncbi.nlm.nih.gov/articles/PMC1892022/
Abstract

BACKGROUND

We provide a re-analysis of the Golden Spike dataset, a first generation "spike-in" control microarray dataset. The original analysis of the Golden Spike dataset was presented in a manuscript by Choe et al. and raised questions concerning the performance of several statistical methods for the control of the false discovery rate (across a set of tests for differential expression). These original findings are now in question as it has been reported that the p-values associated with the tests of differential expression for null probesets (i.e., probesets designed to be fold change 1 across the two arms of the experiment) are not uniformly distributed. Two recent publications have speculated as to the reasons the null distributions are non-uniform. A publication by Dabney and Storey concludes that the non-uniform distributions of null p-values are the direct consequence of an experimental design which requires technical replicates to approximate biological replicates. Irizarry et al. identify four characteristics of the feature level data (three related to experimental design and one artifact). Irizarry et al. argue that the four observed characteristics imply that the assumptions common to most pre-processing algorithms are not satisfied and hence the expression measure methodologies considered by Choe et al. are likely to be flawed.

RESULTS

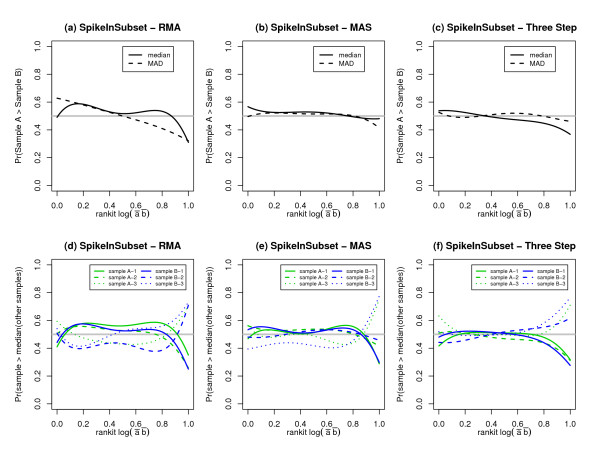
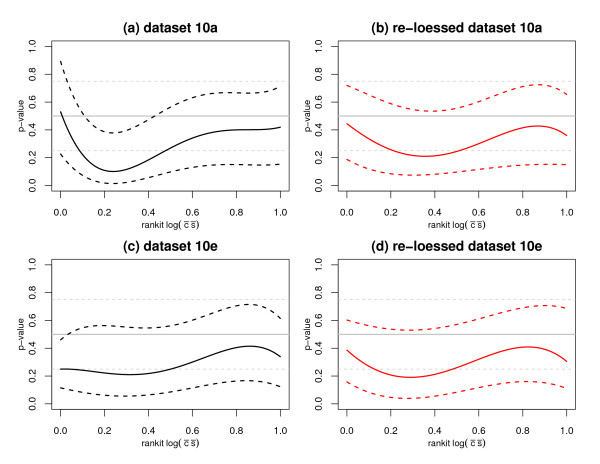
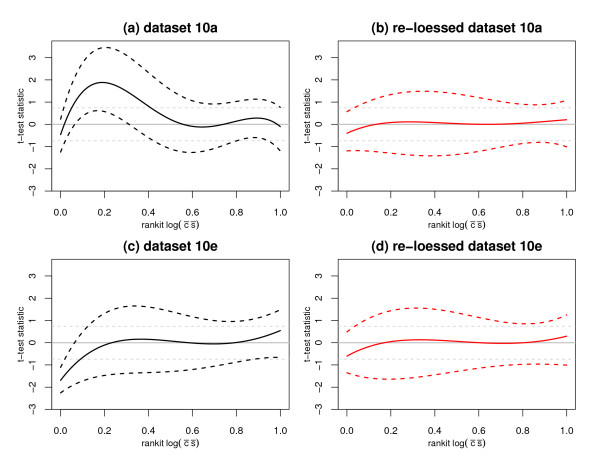
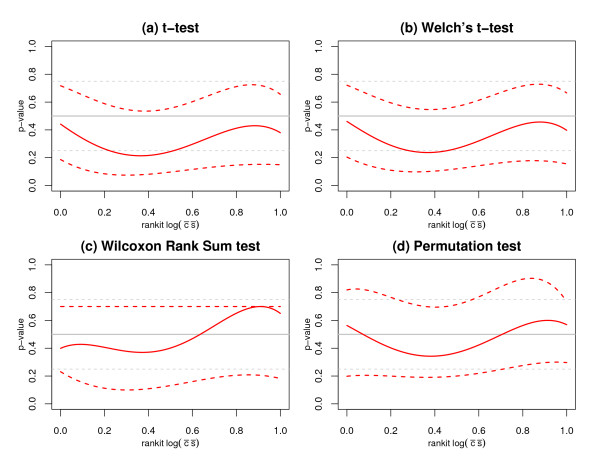
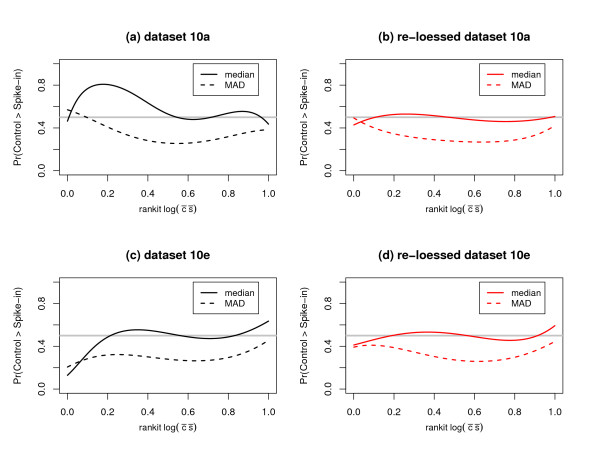
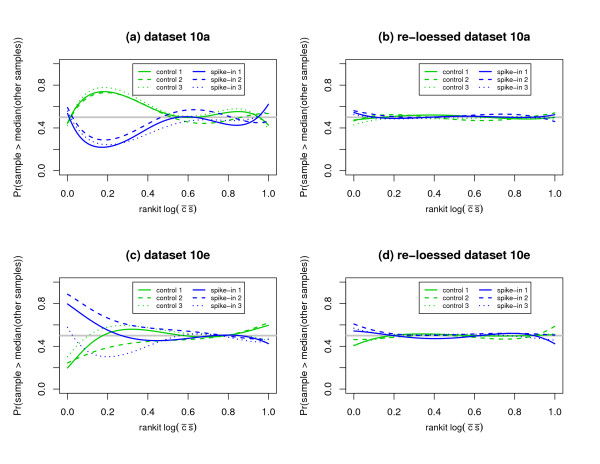
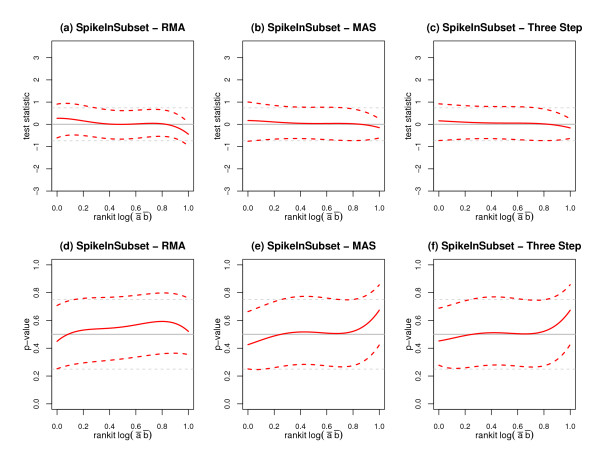
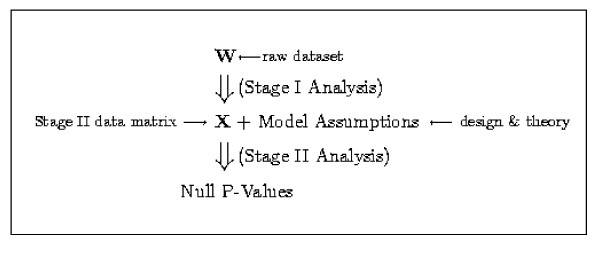
We replicate and extend the analyses of Dabney and Storey and present our results in the context of a two stage analysis. We provide evidence that the Stage I pre-processing algorithms considered in Dabney and Storey fail to provide expression values that are adequately centered or scaled. Furthermore, we demonstrate that the distributions of the p-values, test statistics, and probabilities associated with the relative locations and variabilities of the Stage II expression values vary with signal intensity. We provide diagnostic plots and a simple logistic regression based test statistic to detect these intensity related defects in the processed data.

CONCLUSION

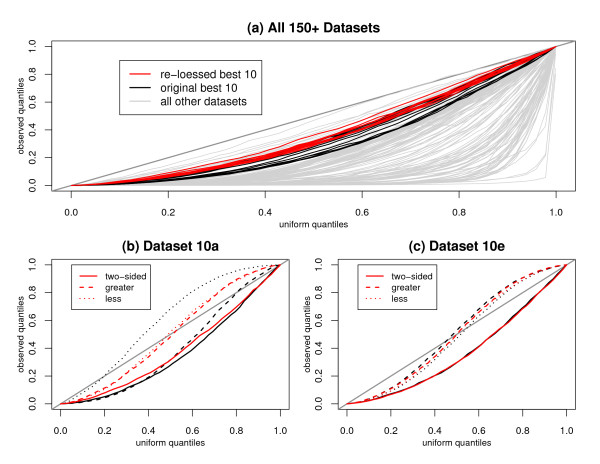
We agree with Dabney and Storey that the null p-values considered in Choe et al. are indeed non-uniform. We also agree with the conclusion that, given current pre-processing technologies, the Golden Spike dataset should not serve as a reference dataset to evaluate false discovery rate controlling methodologies. However, we disagree with the assessment that the non-uniform p-values are merely the byproduct of testing for differential expression under the incorrect assumption that chip data are approximate to biological replicates. Whereas Dabney and Storey attribute the non-uniform p-values to violations of the Stage II model assumptions, we provide evidence that the non-uniformity can be attributed to the failure of the Stage I analyses to correct for systematic biases in the raw data matrix. Although we do not speculate as to the root cause of these systematic biases, the observations made in Irizarry et al. appear to be consistent with our findings. Whereas Irizarry et al. describe the effect of the experimental design on the feature level data, we consider the effect on the underlying multivariate distribution of putative null p-values. We demonstrate that the putative null distributions corresponding to the pre-processing algorithms considered in Choe et al. are all intensity dependent. This dependence serves to invalidate statistical inference based upon standard two sample test statistics. We identify a flaw in the characterization of the appropriate "null" probesets described in Choe et al. and we provide a corrected analysis which reduces (but does not eliminate) the intensity dependent effects.

https://cdn.ncbi.nlm.nih.gov/pmc/blobs/8f16/1892022/03d0a220da9e/1471-2164-8-105-9.jpg
https://cdn.ncbi.nlm.nih.gov/pmc/blobs/8f16/1892022/f43f1e6c786b/1471-2164-8-105-1.jpg
https://cdn.ncbi.nlm.nih.gov/pmc/blobs/8f16/1892022/72cb81775d66/1471-2164-8-105-2.jpg
https://cdn.ncbi.nlm.nih.gov/pmc/blobs/8f16/1892022/5fc58c981f3e/1471-2164-8-105-3.jpg
https://cdn.ncbi.nlm.nih.gov/pmc/blobs/8f16/1892022/7446b015864b/1471-2164-8-105-4.jpg
https://cdn.ncbi.nlm.nih.gov/pmc/blobs/8f16/1892022/eb4cfbb1dcbb/1471-2164-8-105-5.jpg
https://cdn.ncbi.nlm.nih.gov/pmc/blobs/8f16/1892022/869a261e60bc/1471-2164-8-105-6.jpg
https://cdn.ncbi.nlm.nih.gov/pmc/blobs/8f16/1892022/12bb53365c70/1471-2164-8-105-7.jpg
https://cdn.ncbi.nlm.nih.gov/pmc/blobs/8f16/1892022/fc592fc77753/1471-2164-8-105-8.jpg
https://cdn.ncbi.nlm.nih.gov/pmc/blobs/8f16/1892022/03d0a220da9e/1471-2164-8-105-9.jpg
摘要

背景

我们对金标准数据集进行了重新分析,这是一个第一代“掺入式”对照微阵列数据集。Choe等人的一篇论文中展示了对金标准数据集的原始分析,并对几种用于控制错误发现率(在一组差异表达测试中)的统计方法的性能提出了疑问。由于有报道称与无效探针集(即设计为在实验的两个臂上的倍数变化为1的探针集)的差异表达测试相关的p值并非均匀分布,这些原始发现现在受到了质疑。最近的两篇论文推测了无效分布不均匀的原因。Dabney和Storey的一篇论文得出结论,无效p值的非均匀分布是实验设计的直接结果,该实验设计需要技术重复来近似生物学重复。Irizarry等人确定了特征水平数据的四个特征(三个与实验设计有关,一个是人为因素)。Irizarry等人认为观察到的这四个特征意味着大多数预处理算法共有的假设不成立,因此Choe等人考虑的表达测量方法可能存在缺陷。

结果

我们重复并扩展了Dabney和Storey的分析,并在两阶段分析的背景下展示了我们的结果。我们提供证据表明,Dabney和Storey中考虑的第一阶段预处理算法未能提供充分居中或缩放的表达值。此外,我们证明与第二阶段表达值的相对位置和变异性相关的p值、检验统计量和概率的分布随信号强度而变化。我们提供诊断图和一个基于简单逻辑回归的检验统计量,以检测处理后数据中这些与强度相关的缺陷。

结论

我们同意Dabney和Storey的观点,即Choe等人中考虑的无效p值确实不均匀。我们也同意这样的结论,即鉴于当前的预处理技术,金标准数据集不应作为评估错误发现率控制方法的参考数据集。然而,我们不同意那种认为非均匀p值仅仅是在芯片数据近似于生物学重复这一错误假设下进行差异表达测试的副产品的评估。虽然Dabney和Storey将非均匀p值归因于违反第二阶段模型假设,但我们提供证据表明,这种不均匀性可归因于第一阶段分析未能校正原始数据矩阵中的系统偏差。尽管我们没有推测这些系统偏差的根本原因,但Irizarry等人的观察结果似乎与我们的发现一致。Irizarry等人描述了实验设计对特征水平数据的影响,而我们考虑的是对假定无效p值的潜在多元分布的影响。我们证明,Choe等人中考虑的预处理算法对应的假定无效分布都与强度有关。这种依赖性使得基于标准双样本检验统计量的统计推断无效。我们发现了Choe等人中描述的适当“无效”探针集特征的一个缺陷,并提供了一种校正分析,该分析减少了(但没有消除)与强度相关的影响。

相似文献

1
Putative null distributions corresponding to tests of differential expression in the Golden Spike dataset are intensity dependent.与金标准数据集差异表达检验相对应的假定零分布是强度依赖性的。
BMC Genomics. 2007 Apr 19;8:105. doi: 10.1186/1471-2164-8-105.
2
Construction of null statistics in permutation-based multiple testing for multi-factorial microarray experiments.基于排列的多因素微阵列实验多重检验中零统计量的构建。
Bioinformatics. 2006 Jun 15;22(12):1486-94. doi: 10.1093/bioinformatics/btl109. Epub 2006 Mar 30.
3
Comparison of seven methods for producing Affymetrix expression scores based on False Discovery Rates in disease profiling data.基于疾病谱数据中错误发现率的七种生成Affymetrix表达分数方法的比较。
BMC Bioinformatics. 2005 Feb 10;6:26. doi: 10.1186/1471-2105-6-26.
4
Quantile-function based null distribution in resampling based multiple testing.基于重采样的多重检验中基于分位数函数的零分布。
Stat Appl Genet Mol Biol. 2006;5:Article14. doi: 10.2202/1544-6115.1199. Epub 2006 May 21.
5
Estimating p-values in small microarray experiments.在小型微阵列实验中估计p值。
Bioinformatics. 2007 Jan 1;23(1):38-43. doi: 10.1093/bioinformatics/btl548. Epub 2006 Oct 30.
6
[Meta-analysis of the Italian studies on short-term effects of air pollution].[意大利关于空气污染短期影响研究的荟萃分析]
Epidemiol Prev. 2001 Mar-Apr;25(2 Suppl):1-71.
7
An improved nonparametric approach for detecting differentially expressed genes with replicated microarray data.一种用于利用重复微阵列数据检测差异表达基因的改进非参数方法。
Stat Appl Genet Mol Biol. 2006;5:Article30. doi: 10.2202/1544-6115.1246. Epub 2007 Jan 2.
8
Two-part permutation tests for DNA methylation and microarray data.针对DNA甲基化和微阵列数据的两部分排列检验
BMC Bioinformatics. 2005 Feb 22;6:35. doi: 10.1186/1471-2105-6-35.
9
Nonparametric methods for microarray data based on exchangeability and borrowed power.基于可交换性和借势的微阵列数据非参数方法。
J Biopharm Stat. 2005;15(5):783-97. doi: 10.1081/BIP-200067778.
10
To permute or not to permute.是否进行置换。
Bioinformatics. 2006 Sep 15;22(18):2244-8. doi: 10.1093/bioinformatics/btl383. Epub 2006 Jul 26.

引用本文的文献

1
Variation-preserving normalization unveils blind spots in gene expression profiling.保留变异性的归一化揭示了基因表达谱分析中的盲点。
Sci Rep. 2017 Mar 9;7:42460. doi: 10.1038/srep42460.
2
Comparing Imputation Procedures for Affymetrix Gene Expression Datasets Using MAQC Datasets.使用MAQC数据集比较Affymetrix基因表达数据集的插补程序
Adv Bioinformatics. 2013;2013:790567. doi: 10.1155/2013/790567. Epub 2013 Oct 9.
3
Correction of unexpected distributions of P values from analysis of whole genome arrays by rectifying violation of statistical assumptions.

本文引用的文献

1
Feature-level exploration of a published Affymetrix GeneChip control dataset.对已发表的Affymetrix基因芯片对照数据集进行特征级探索。
Genome Biol. 2006;7(8):404. doi: 10.1186/gb-2006-7-8-404.
2
A reanalysis of a published Affymetrix GeneChip control dataset.对已发表的Affymetrix基因芯片对照数据集的重新分析。
Genome Biol. 2006;7(3):401. doi: 10.1186/gb-2006-7-3-401. Epub 2006 Mar 22.
3
Comparison of Affymetrix GeneChip expression measures.Affymetrix基因芯片表达量测量结果的比较
通过纠正统计假设的违反,纠正全基因组芯片分析中意外的 P 值分布。
BMC Genomics. 2013 Mar 11;14:161. doi: 10.1186/1471-2164-14-161.
4
Kernel density weighted loess normalization improves the performance of detection within asymmetrical data.核密度加权局部线性回归平滑标准化可提高非对称数据检测性能。
BMC Bioinformatics. 2011 Jun 1;12:222. doi: 10.1186/1471-2105-12-222.
5
Bayesian optimal discovery procedure for simultaneous significance testing.用于同时进行显著性检验的贝叶斯最优发现程序。
BMC Bioinformatics. 2009 Jan 6;10:5. doi: 10.1186/1471-2105-10-5.
6
Background correction using dinucleotide affinities improves the performance of GCRMA.使用二核苷酸亲和力进行背景校正可提高GCRMA的性能。
BMC Bioinformatics. 2008 Oct 23;9:452. doi: 10.1186/1471-2105-9-452.
7
A comprehensive re-analysis of the Golden Spike data: towards a benchmark for differential expression methods.对金标准数据的全面重新分析:迈向差异表达方法的基准
BMC Bioinformatics. 2008 Mar 26;9:164. doi: 10.1186/1471-2105-9-164.
8
Empirical Bayes models for multiple probe type microarrays at the probe level.探针水平上多探针类型微阵列的经验贝叶斯模型。
BMC Bioinformatics. 2008 Mar 20;9:156. doi: 10.1186/1471-2105-9-156.
9
A reanalysis of a published Affymetrix GeneChip control dataset.对已发表的Affymetrix基因芯片对照数据集的重新分析。
Genome Biol. 2006;7(3):401. doi: 10.1186/gb-2006-7-3-401. Epub 2006 Mar 22.
Bioinformatics. 2006 Apr 1;22(7):789-94. doi: 10.1093/bioinformatics/btk046. Epub 2006 Jan 12.
4
Preferred analysis methods for Affymetrix GeneChips revealed by a wholly defined control dataset.由完全定义的对照数据集揭示的Affymetrix基因芯片的首选分析方法。
Genome Biol. 2005;6(2):R16. doi: 10.1186/gb-2005-6-2-r16. Epub 2005 Jan 28.
5
Bioconductor: open software development for computational biology and bioinformatics.生物导体:用于计算生物学和生物信息学的开源软件开发。
Genome Biol. 2004;5(10):R80. doi: 10.1186/gb-2004-5-10-r80. Epub 2004 Sep 15.
6
Exploration, normalization, and summaries of high density oligonucleotide array probe level data.高密度寡核苷酸阵列探针水平数据的探索、标准化及汇总
Biostatistics. 2003 Apr;4(2):249-64. doi: 10.1093/biostatistics/4.2.249.
7
Summaries of Affymetrix GeneChip probe level data.Affymetrix基因芯片探针水平数据摘要。
Nucleic Acids Res. 2003 Feb 15;31(4):e15. doi: 10.1093/nar/gng015.
8
A comparison of normalization methods for high density oligonucleotide array data based on variance and bias.基于方差和偏差的高密度寡核苷酸阵列数据标准化方法比较
Bioinformatics. 2003 Jan 22;19(2):185-93. doi: 10.1093/bioinformatics/19.2.185.
9
Feature extraction and normalization algorithms for high-density oligonucleotide gene expression array data.用于高密度寡核苷酸基因表达阵列数据的特征提取与归一化算法。
J Cell Biochem Suppl. 2001;Suppl 37:120-5. doi: 10.1002/jcb.10073.