Aho A J, Yli-Hankala A, Lyytikäinen L-P, Jäntti V
Department of Anaesthesia, Tampere University Hospital, PO Box 2000, 33521 Tampere, Finland.
Br J Anaesth. 2009 Feb;102(2):227-33. doi: 10.1093/bja/aen356. Epub 2008 Dec 25.
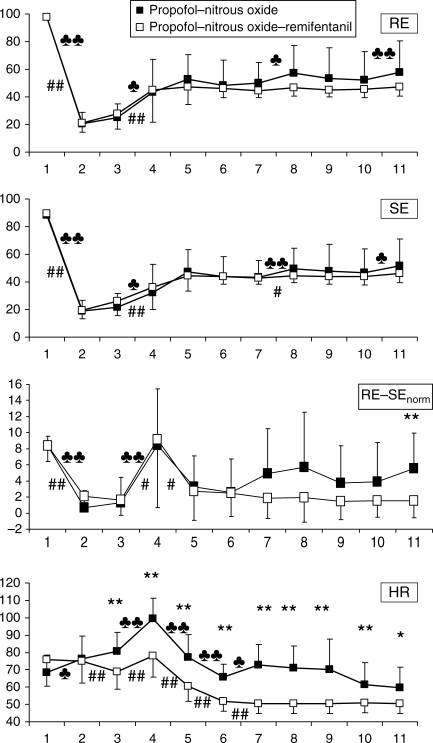
Entropy is an anaesthetic EEG monitoring method, calculating two numerical parameters: State Entropy (SE, range 0-91) and Response Entropy (RE, range 0-100). Low Entropy numbers indicate unconsciousness. SE uses the frequency range 0.8-32 Hz, representing predominantly the EEG activity. RE is calculated at 0.8-47 Hz, consisting of both EEG and facial EMG. RE-SE difference (RE-SE) can indicate EMG, reflecting nociception. We studied RE-SE and EMG in patients anaesthetized without neuromuscular blockers.
Thirty-one women were studied in propofol-nitrous oxide (P) or propofol-nitrous oxide-remifentanil (PR) anaesthesia. Target SE value was 40-60. RE-SE was measured before and after endotracheal intubation, and before and after the commencement of surgery. The spectral content of the signal was analysed off-line. Appearance of EMG on EEG was verified visually.
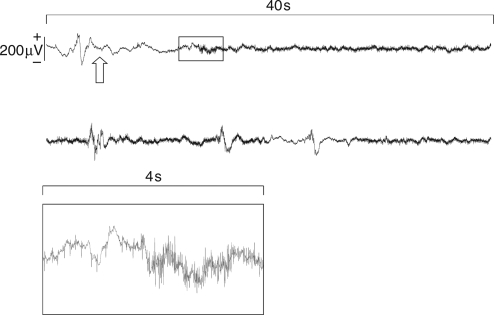
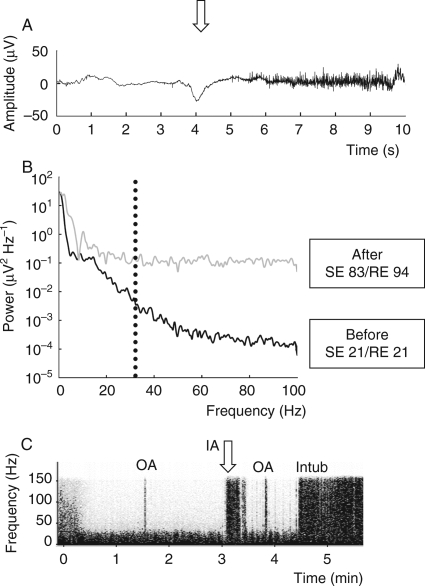
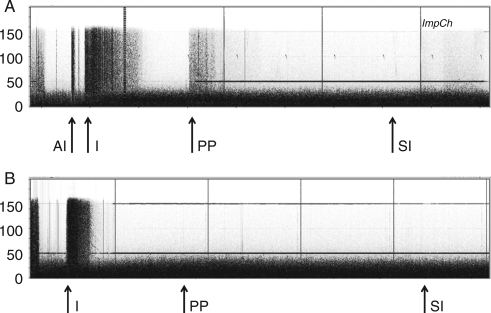
RE, SE, and RE-SE increased during intubation in both groups. Elevated RE was followed by increased SE values in most cases. In these patients, spectral analysis of the signal revealed increased activity starting from low (<20 Hz) frequency area up to the highest measured frequencies. This was associated with appearance of EMG in raw signal. No spectral alterations or EMG were seen in patients with stable Entropy values.
Increased RE is followed by increased SE at nociceptive stimuli in patients not receiving neuromuscular blockers. Owing to their overlapping power spectra, the contribution of EMG and EEG cannot be accurately separated with frequency analysis in the range of 10-40 Hz.
熵是一种麻醉脑电图监测方法,可计算两个数值参数:状态熵(SE,范围0 - 91)和反应熵(RE,范围0 - 100)。低熵值表明无意识状态。SE使用0.8 - 32Hz的频率范围,主要代表脑电图活动。RE在0.8 - 47Hz计算,由脑电图和面部肌电图组成。RE - SE差值(RE - SE)可表明肌电图,反映伤害感受。我们研究了未使用神经肌肉阻滞剂麻醉患者的RE - SE和肌电图情况。
对31名女性患者进行丙泊酚 - 氧化亚氮(P)或丙泊酚 - 氧化亚氮 - 瑞芬太尼(PR)麻醉。目标SE值为40 - 60。在气管插管前后以及手术开始前后测量RE - SE。离线分析信号的频谱内容。通过肉眼验证脑电图上肌电图的出现情况。
两组患者在插管期间RE、SE和RE - SE均升高。在大多数情况下,RE升高后SE值随之增加。对这些患者信号的频谱分析显示,从低频(<20Hz)区域到最高测量频率,活动均增加。这与原始信号中肌电图的出现相关。熵值稳定的患者未观察到频谱改变或肌电图。
在未接受神经肌肉阻滞剂的患者中,伤害性刺激时RE升高后SE也升高。由于它们的功率谱重叠,在10 - 40Hz范围内通过频率分析无法准确分离肌电图和脑电图的贡献。